. 2023 Mar;89(3):1265-1277.
doi: 10.1002/mrm.29508. Epub 2022 Nov 2.

A cryogenic 14-channel 13 C receiver array for 3T human head imaging

Affiliations

A cryogenic 14-channel 13 C receiver array for 3T human head imaging

Wenjun Wang et al. Magn Reson Med. 2023 Mar.

Abstract

Purpose: This article presents a novel 14-channel receive-only array for 13 C human head imaging at 3 T that explores the SNR gain by operating at cryogenic temperature cooled by liquid nitrogen.

Methods: Cryostats are developed to evaluate single-coil bench SNR performance and cool the 14-channel array with liquid nitrogen while having enough thermal insulation between the coils and the sample. The temperature distribution for the coil array is measured. Circuits are adapted to the -189°C environment and implemented in the 14-channel array. 13 C images are acquired with the array at cryogenic and room temperature in a 3T scanner.

Results: Compared with room temperature, the array at cryogenic temperature provides 27%-168% SNR improvement over all voxels and 47% SNR improvement near the image center. The measurements show a decrease of the element noise correlation at cryogenic temperature.

Conclusion: It is demonstrated that higher SNR can be achieved by cryogenically cooling the 14-channel array. A cryogenic array suitable for clinical imaging can be further developed on the array proposed. The cryogenic coil array is most likely suited for scenarios in which high SNR deep in a head and decent SNR on the periphery are required.

Keywords: MRI array; carbon imaging; cryogenic coil; head coil.


Figures

FIGURE 1
FIGURE 1
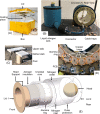
A, Cryostat #1, a Styrofoam box of 213 × 255 × 125 mm size. B, Cryostat #2 assembly, which consists of a liquid nitrogen tank, a tube connector, and cryostat 2C. The copper‐clad small boxes with two “eyes” each are cable traps. Coils mounted inside cryostat 2C are labeled 1–14 as marked. C, The alumina piece on which coils are mounted inside cryostat 1. D, The inside of the cryostat 2C. Copper rings are fixed by zirconia (ZrO2) screws and nuts on an alumina ring (coils are numbered 5–8). E, Cryostat 2C. Liquid nitrogen flows through nitrogen inlet and exhausts through the nitrogen outlet. Holes are drilled on lid 2 to let wires and cables pass through. A head is drawn as a ball for simplicity of graph drawing. Abbreviation: PCB, printed circuit board
FIGURE 2
FIGURE 2
A, Coil dimensions. The four holes on the ring are for fixing coil on an alumina ring in cryostat 2C shown in Figure 1B,D. B, The schematic of the cable trap. L1 is formed by a coaxial cable. The inset is a photograph of a cable trap with encasement. C, The biasing and matching circuit for preamplifier WMA32C. C1–C6 and L1–L2 comprise the matching circuit. D2, L6, C11, D3, and L7 comprise the active decoupling circuit
FIGURE 3
FIGURE 3
A, Temperature of cryostat #1, and coils 1 and 8 of cryostat 2 versus time. Cryostat #1 needs 6.5 min to cool and sustains temperature for approximately 1 h 10 min. Cryostat #2 needs 30 min to cool and remains useable for approximately 1 h 10 min if no liquid nitrogen is replenished. B, Steady‐state temperature distribution of coils in cryostat #2 if liquid nitrogen is not replenished. Coils 1 and 14 stand on the top of cryostat #2. Coils 7 and 8 lie at the bottom. The lowest temperature (−172.8°C) is found on coil 8. The highest temperature (−125.1°C) is found on coil 14
FIGURE 4
FIGURE 4
The noise correlation of the 14‐channel array at cryogenic (A) and room temperature (B). C, The head‐shaped phantom. D, The experiment setup. At cryogenic temperature, the average absolute values of the off‐diagonal elements of the correlation matrix is |ρ|¯=0.118 (range: 0.004|ρ|0.289). At room temperature, |ρ|¯=0.147, 0.006|ρ|0.424. These correlation values are also listed in Table 2
FIGURE 5
FIGURE 5
Individual coil SNR profiles of the array at cryogenic temperature (A) and at room temperature (B). The signal has an arbitrary unit. Numbers 1–14 on the upper‐right corner of each picture mark the coil numbers that correspond to Figure 3B. The SNR increases at cryogenic temperature for all channels
FIGURE 6
FIGURE 6
A, The SNR map of the cryogenic coil array after coil combination. B, The SNR map of the coil array at room temperature. C, The map of SNR gain, calculated by the array SNR at cryogenic temperature divided by the array SNR at room temperature. The statistical data of regions of interest (ROIs) 1, 2, and 3 that correspond to top, central, and bottom areas are found in Table 3. D, The SNR profile of the centermost four columns of the image in anterior–posterior direction (A‐P). E, The SNR profile of the centermost four rows of the image in right–left direction (R‐L). The SNR follows axes on the left. The SNR gain follows axes on the right. Shaded stripes depict the corresponding ranges of SNR and SNR gain. Solid lines delineate the average SNR or SNR gain. The maximum, central, and average SNR values are listed in Table 2. The highest, lowest, central, and average SNR gain at cryogenic temperature over room temperature are 2.68×, 1.27×, 1.47×, and 1.64×, respectively. F, The benchtop SNR of a single coil at cryogenic and room temperature versus frequency. The abscissa is f32.13MHz. The benchtop room‐temperature SNR at 32.13 MHz is set to 100. Parts (D)–(F) share the same scale of SNR cryo/room ratio
FIGURE 7
FIGURE 7
Retrospective SENSE 1/g factor maps of the coil array at cryogenic temperature with acceleration rate 2 (A), at room temperature with acceleration rate 2 (B), at cryogenic temperature with acceleration rate 3 (C), and at room temperature with acceleration rate 3 (D). Acceleration occurs in the R‐L direction. Abbreviations: Avg., average 1/g factor; Min., minimum 1/g factor

References

    1. Kurhanewicz J, Vigneron DB, Ardenkjaer‐Larsen JH, et al. Hyperpolarized 13C MRI: path to clinical translation in oncology. Neoplasia (United States). 2019;21:1‐16. - PMC - PubMed
    1. Serrao EM, Brindle KM. Dynamic nuclear polarisation: the future of imaging in oncology? Porto Biomed J. 2017;2:71‐75. - PMC - PubMed
    1. Saito K, Matsumoto S, Takakusagi Y, et al. 13C‐MR spectroscopic imaging with hyperpolarized [1‐13C]pyruvate detects early response to radiotherapy in SCC tumors and HT‐29 tumors. Clin Cancer Res. 2015;21:5073‐5081. - PMC - PubMed
    1. de Graaf RA. Basic principles. In Vivo NMR Spectroscopy: Principles and Techniques. 2nd ed. John Wiley & Sons; 2007:1‐42.
    1. Ardenkjaer‐Larsen JH, Fridlund B, Gram A, et al. Increase in signal‐to‐noise ratio of > 10,000 times in liquid‐state NMR. Proc Natl Acad Sci U S A. 2003;100:10158‐10163. - PMC - PubMed

Publication types