

Mucosal and Systemic Responses to Severe Acute Respiratory Syndrome Coronavirus 2 Vaccination Determined by Severity of Primary Infection
- PMID: 36321826
- PMCID: PMC9769618
- DOI: 10.1128/msphere.00279-22
Mucosal and Systemic Responses to Severe Acute Respiratory Syndrome Coronavirus 2 Vaccination Determined by Severity of Primary Infection
Abstract
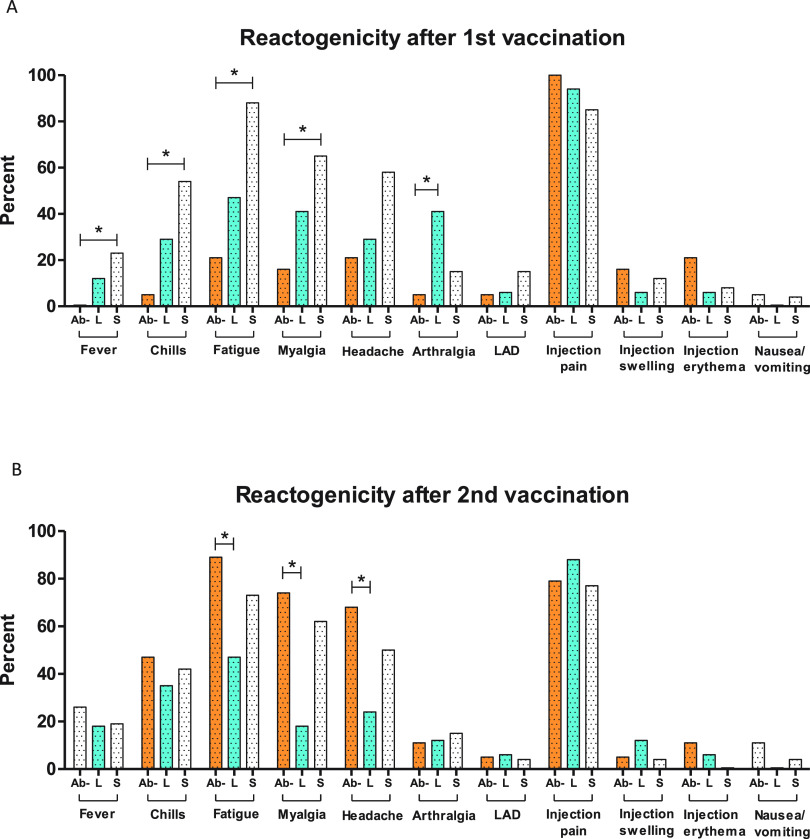
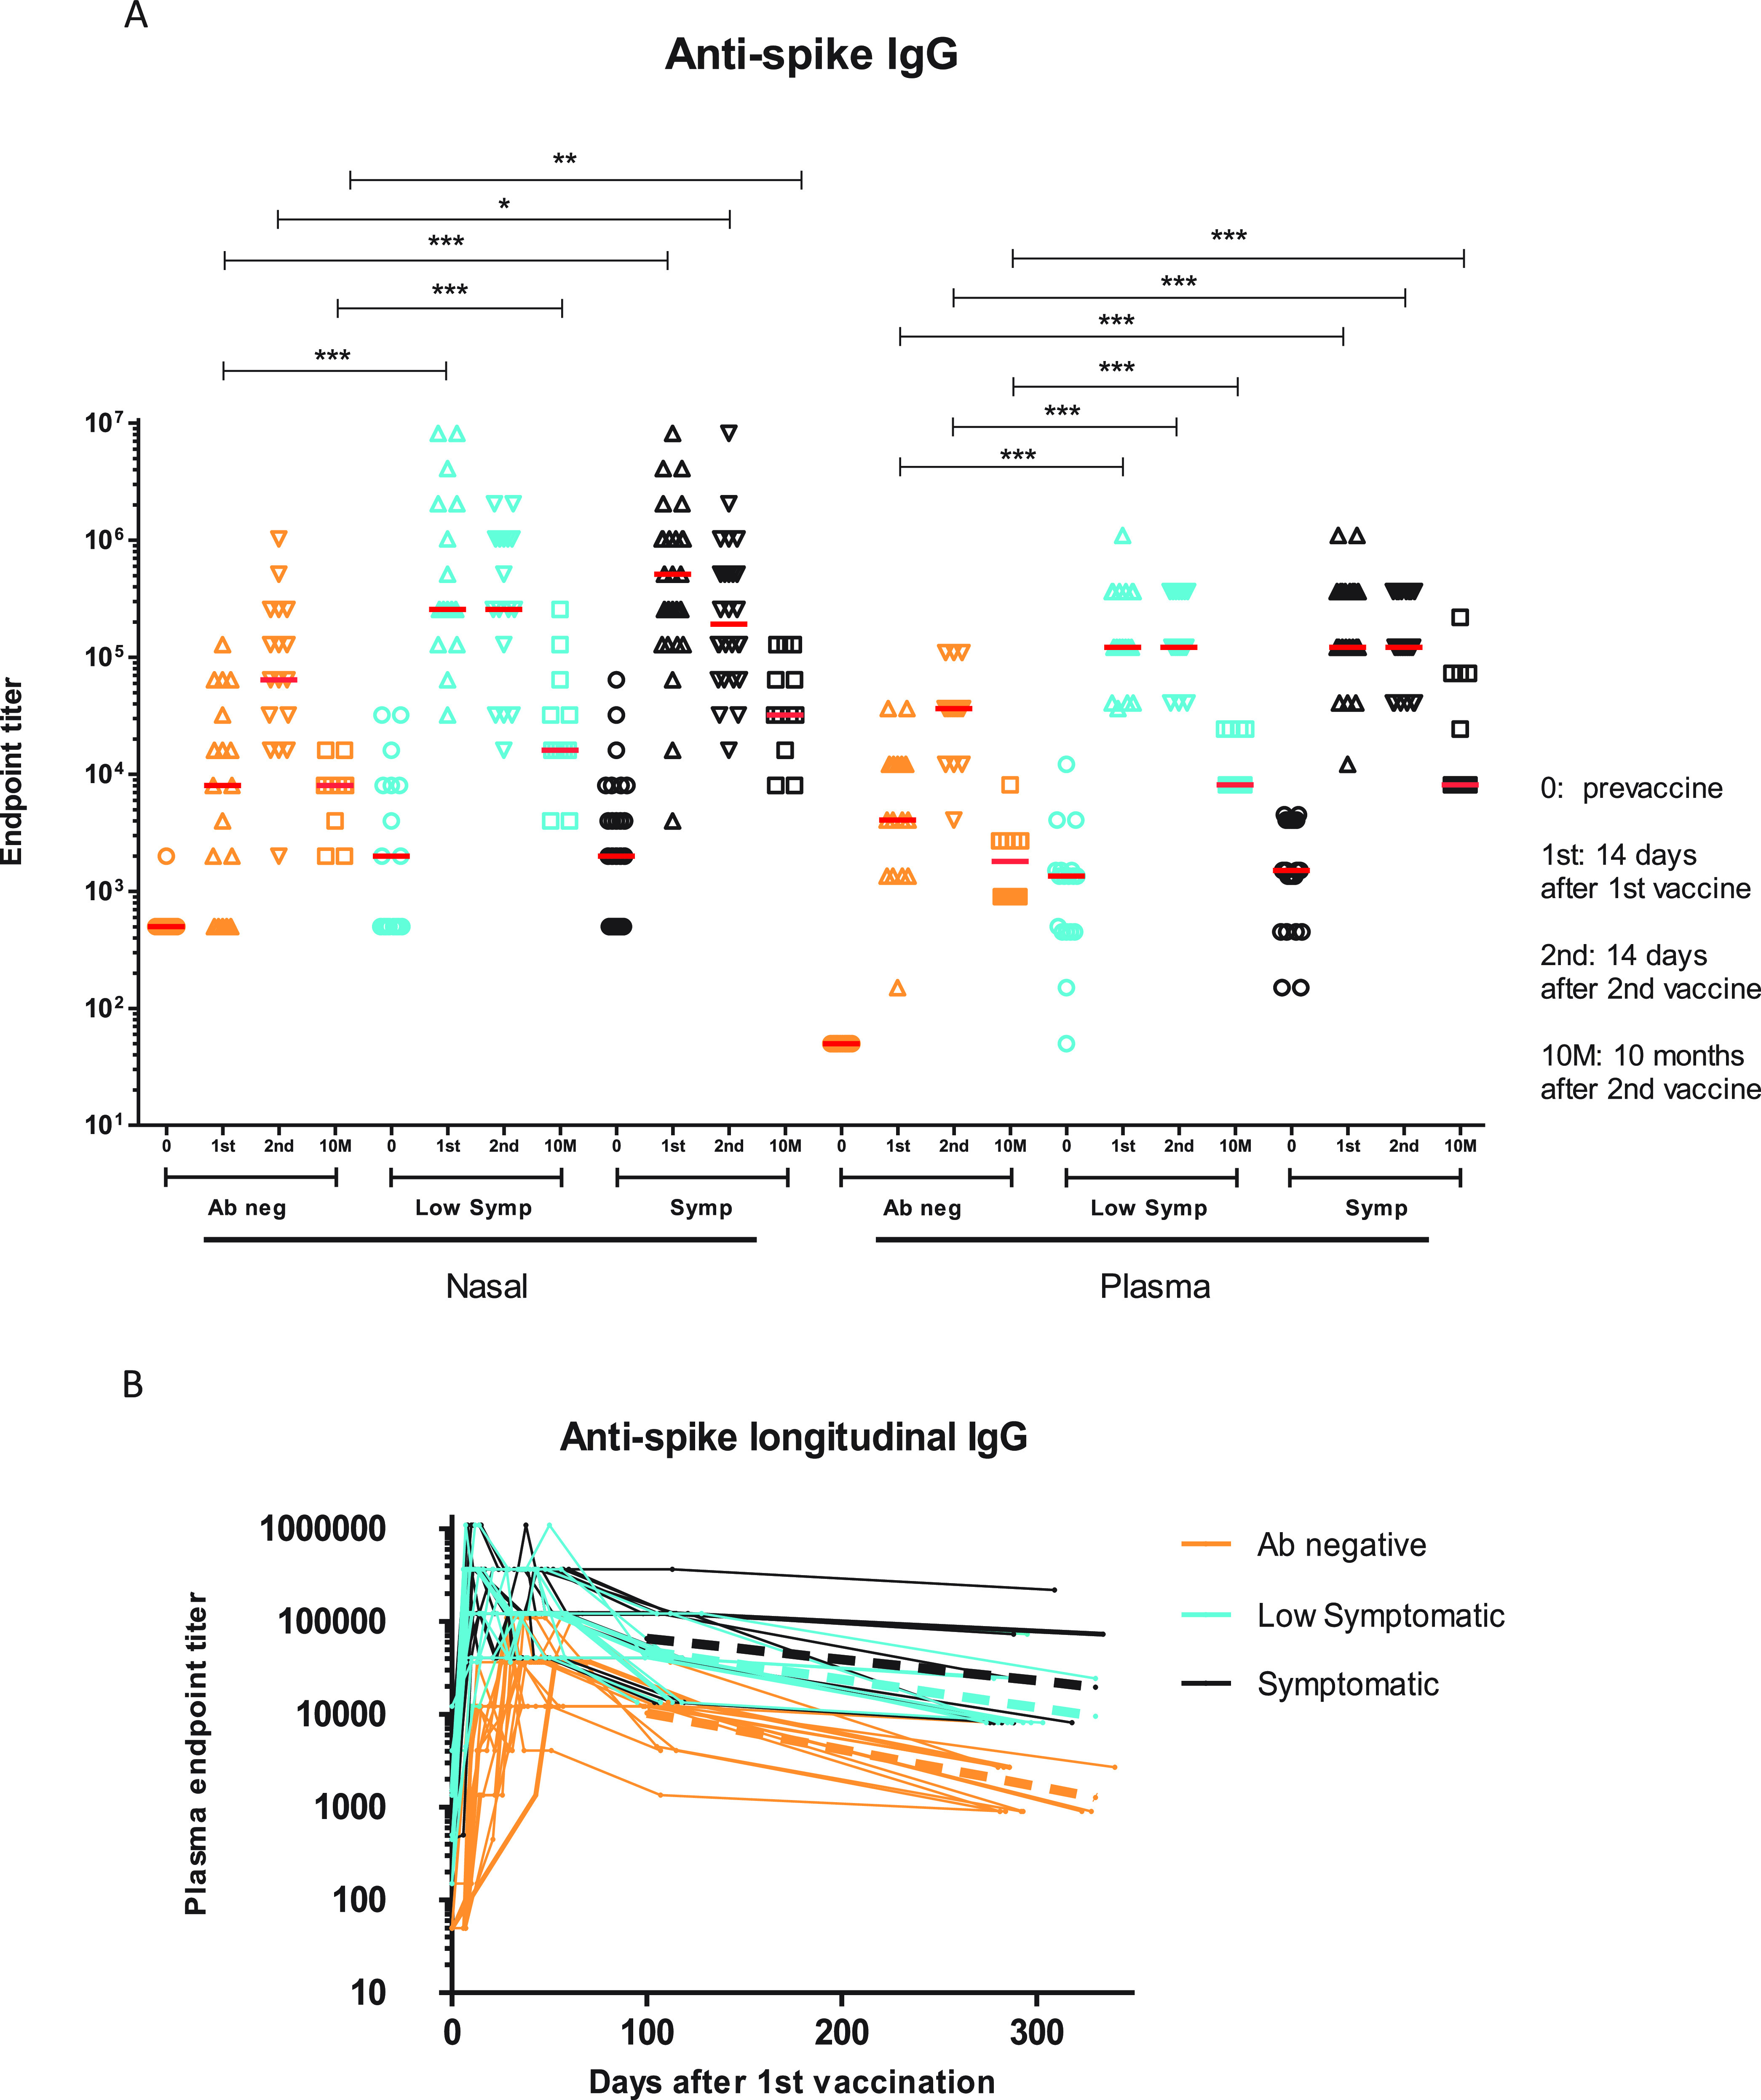
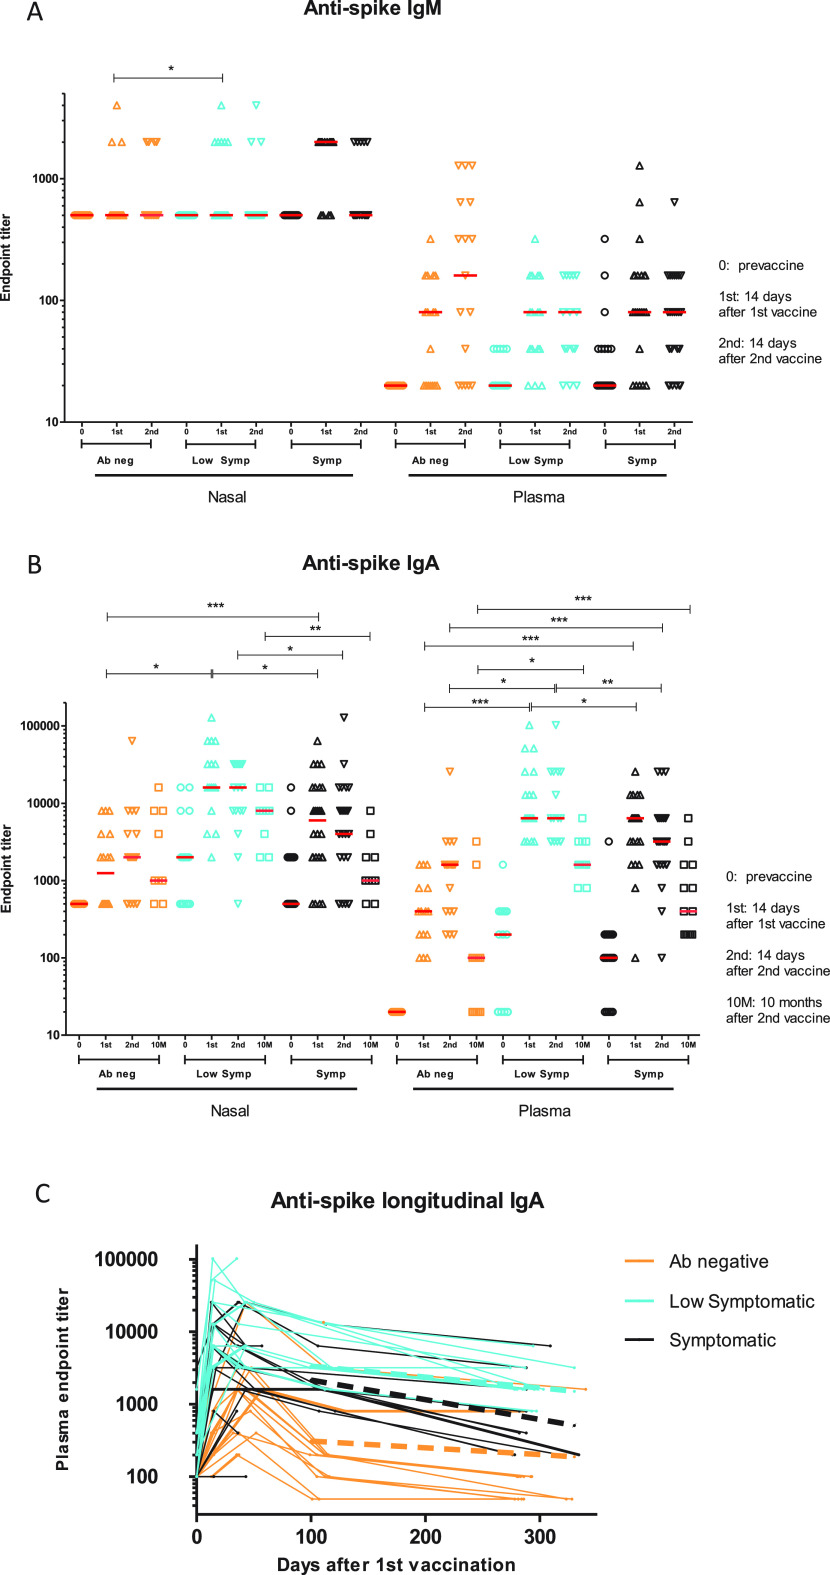
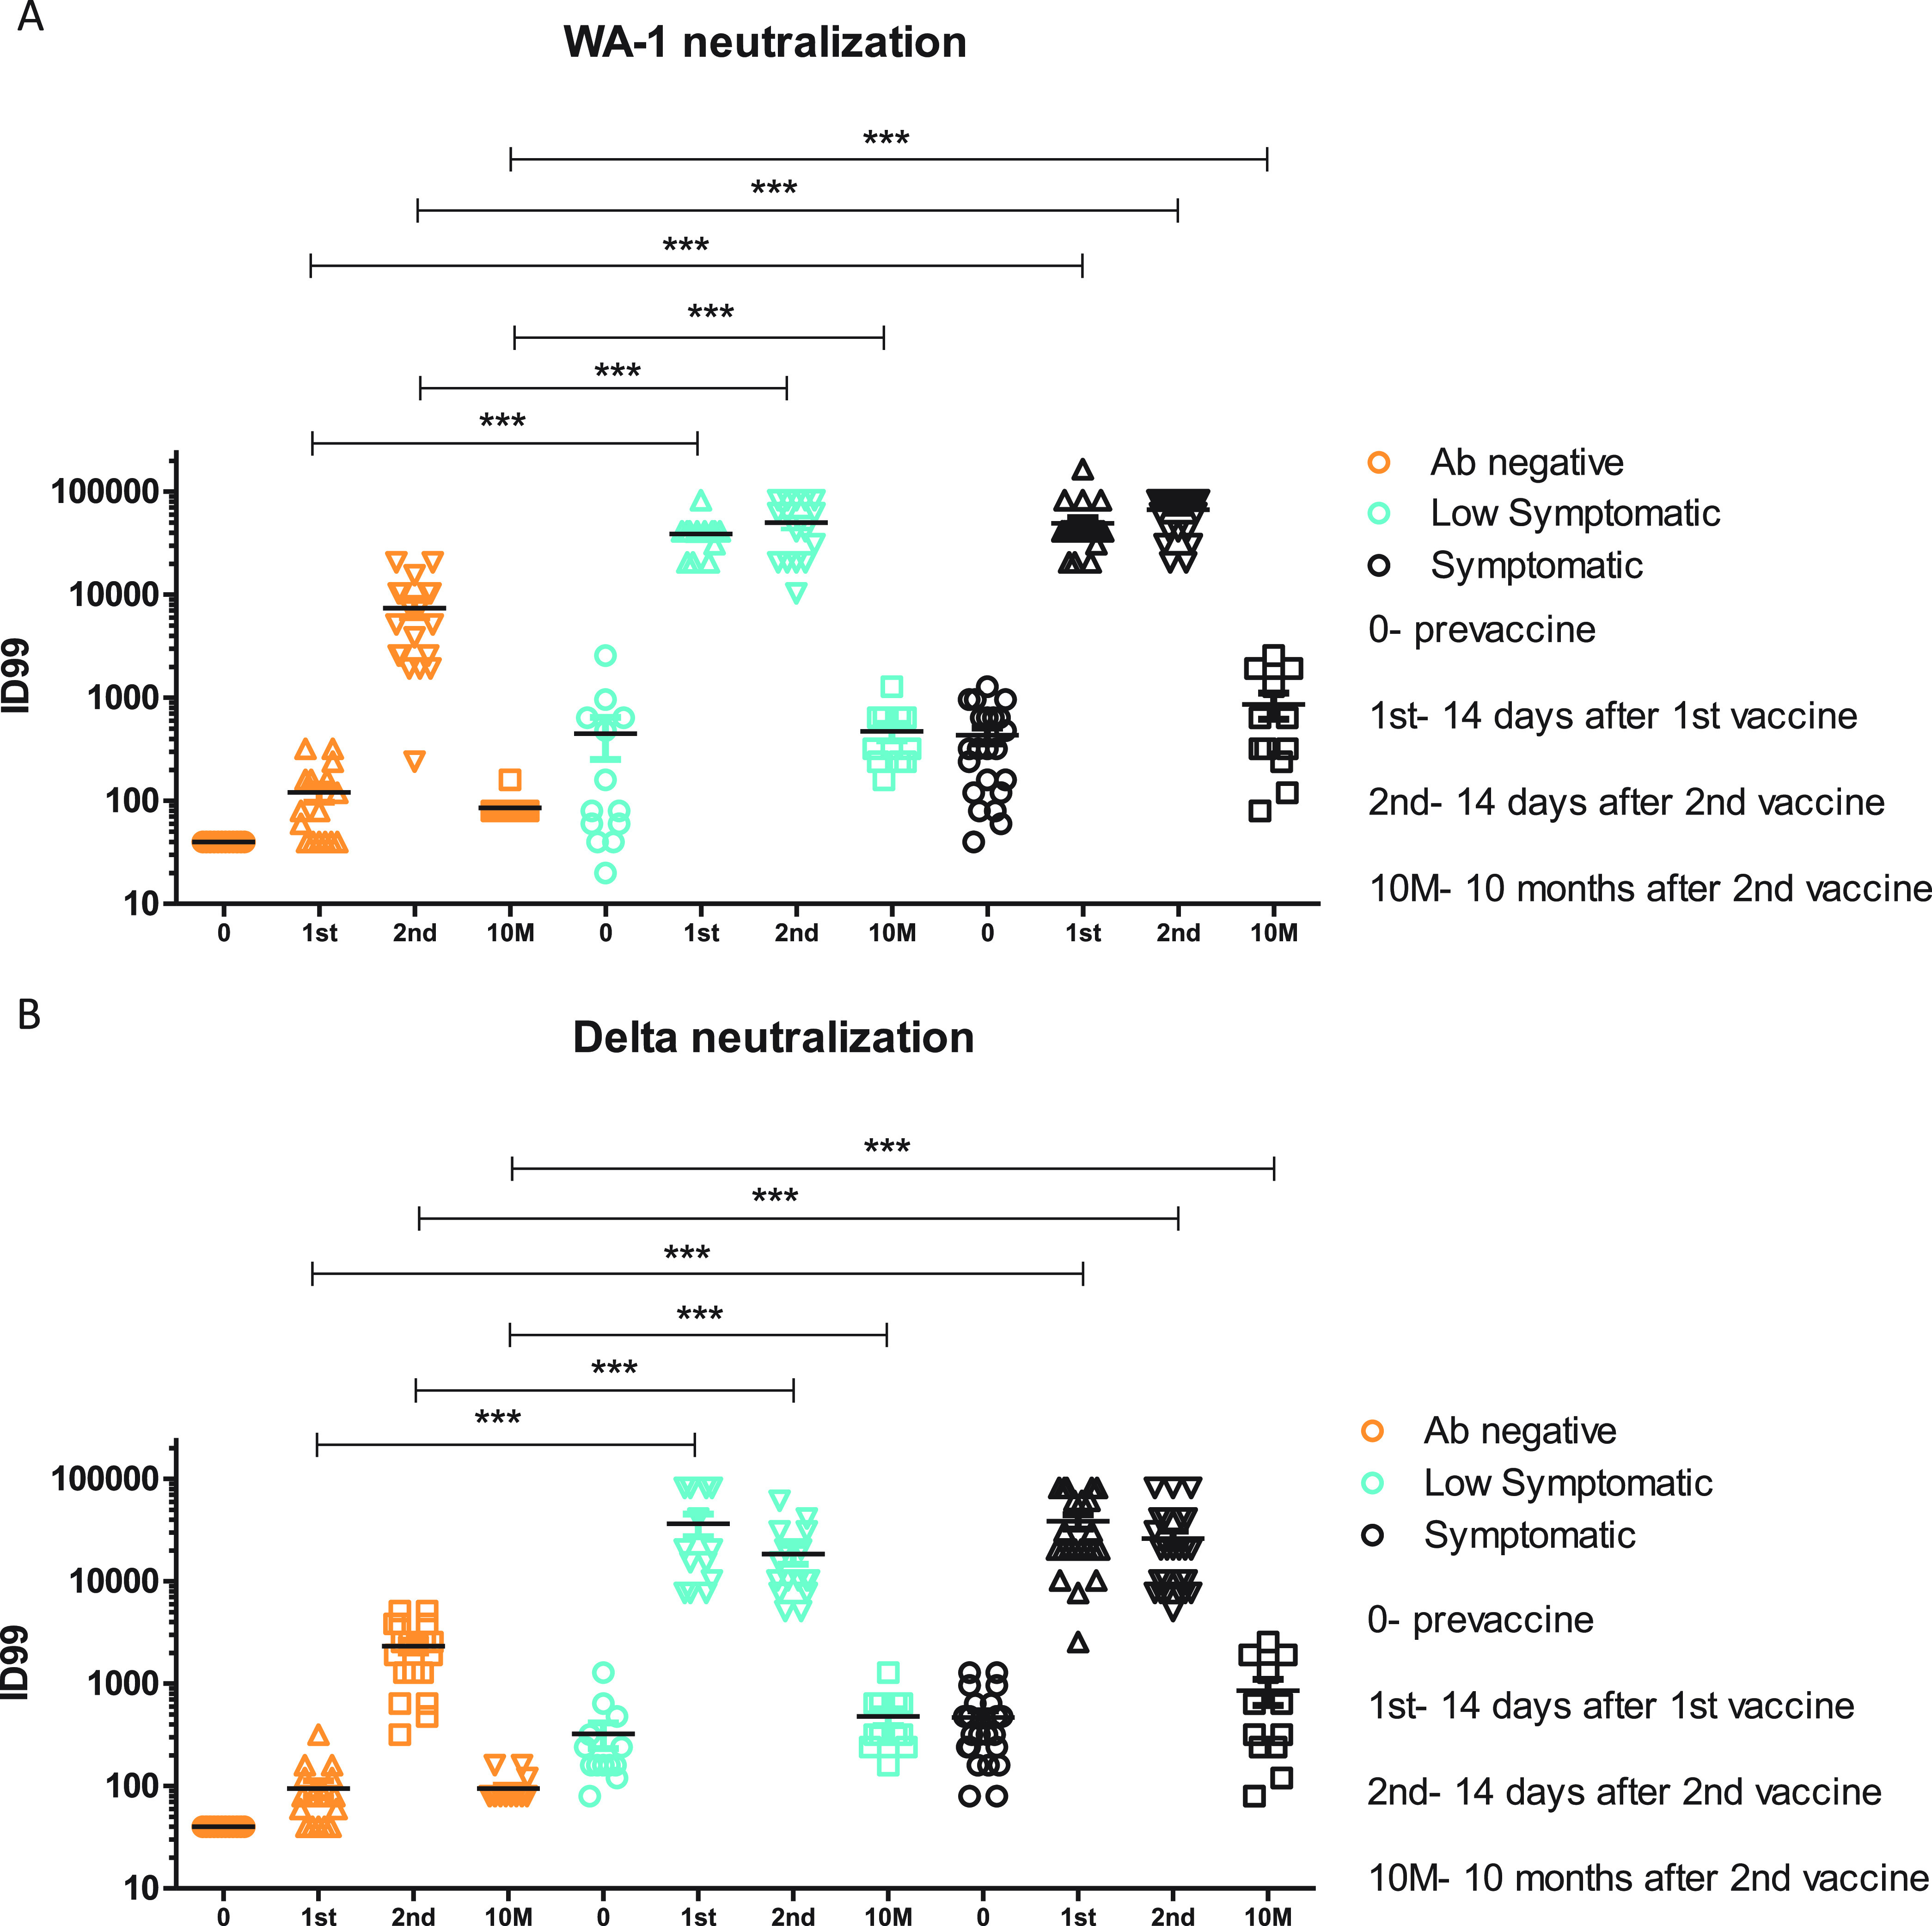
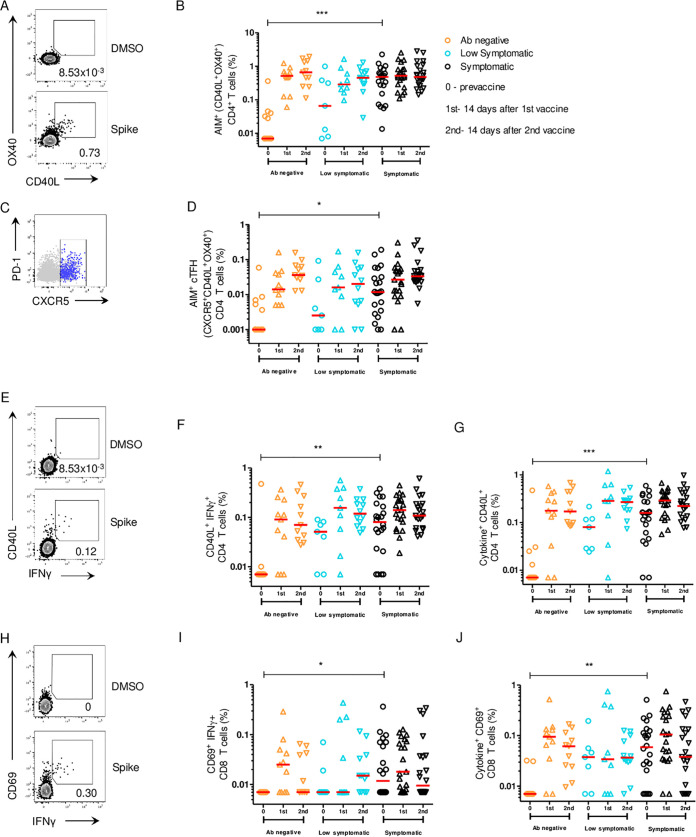
With much of the world infected with or vaccinated against severe acute respiratory syndrome coronavirus 2 (commonly abbreviated SARS-CoV-2; abbreviated here SARS2), understanding the immune responses to the SARS2 spike (S) protein in different situations is crucial to controlling the pandemic. We studied the clinical, systemic, mucosal, and cellular responses to two doses of SARS2 mRNA vaccines in 62 individuals with and without prior SARS2 infection that were divided into three groups based on antibody serostatus prior to vaccination and/or degree of disease symptoms among those with prior SARS2 infection: antibody negative (naive), low symptomatic, and symptomatic. Antibody negative were subjects who were antibody negative (i.e., those with no prior infection). Low symptomatic subjects were those who were antibody negative and had minimal or no symptoms at time of SARS2 infection. Symptomatic subjects were those who were antibody positive and symptomatic at time of SARS2 infection. All three groups were then studied when they received their SARS2 mRNA vaccines. In the previously SARS2-infected (based on antibody test) low symptomatic and symptomatic groups, reactogenic symptoms related to a recall response were elicited after the first vaccination. Anti-S trimer IgA and IgG titers, and neutralizing antibody titers, peaked after the 1st vaccination in the previously SARS2-infected groups and were significantly higher than for the SARS2 antibody-negative group in the plasma and nasal samples at most time points. Nasal and plasma IgA antibody responses were significantly higher in the low symptomatic group than in the symptomatic group at most time points. After the first vaccination, differences in cellular immunity were not evident between groups, but the activation-induced cell marker (AIM+) CD4+ cell response correlated with durability of IgG humoral immunity against the SARS2 S protein. In those SARS2-infected subjects, severity of infection dictated plasma and nasal IgA responses in primary infection as well as response to vaccination (peak responses and durability), which could have implications for continued protection against reinfection. Lingering differences between the SARS2-infected and SARS2-naive up to 10 months postvaccination could explain the decreased reinfection rates in the SARS2-infected vaccinees recently reported and suggests that additional strategies (such as boosting of the SARS2-naive vaccinees) are needed to narrow the differences observed between these groups. IMPORTANCE This study on SARS2 vaccination in those with and without previous exposure to the virus demonstrates that severity of infection dictates IgA responses in primary infection as well as response to vaccination (peak responses and durability), which could have implications for continued protection against reinfection.
Keywords: IgA; IgG; SARS-CoV-2; mucosal immunity; systemic response; vaccination.
Conflict of interest statement
The authors declare a conflict of interest. A.D.H. supported by CDC grant U01CK000556-02-01. S.C. supported by NIH NIAID CCHI AI142742. This work was supported in part by Merit Award # I01 BX005469-01 from the United States (U.S.) Department of Veterans Affairs Biomedical Laboratory Research and Development Service. The contents do not represent the views of the U.S. Department of Veterans Affairs or the United States Government.
Figures
References
-
- Pouwels KB, Pritchard E, Matthews PC, Stoesser N, Eyre DW, Vihta K-D, House T, Hay J, Bell JI, Newton JN, Farrar J, Crook D, Cook D, Rourke E, Studley R, Peto TEA, Diamond I, Walker AS. 2021. Effect of Delta variant on viral burden and vaccine effectiveness against new SARS-CoV-2 infections in the UK. Nat Med 27:2127–2135. doi: 10.1038/s41591-021-01548-7. - DOI - PMC - PubMed
-
- Thomas SJ, Moreira ED, Kitchin N, Absalon J, Gurtman A, Lockhart S, Perez JL, Pérez Marc G, Polack FP, Zerbini C, Bailey R, Swanson KA, Xu X, Roychoudhury S, Koury K, Bouguermouh S, Kalina WV, Cooper D, Frenck RW, Hammitt LL, Türeci Ö, Nell H, Schaefer A, Ünal S, Yang Q, Liberator P, Tresnan DB, Mather S, Dormitzer PR, Şahin U, Gruber WC, Jansen KU, C4591001 Clinical Trial Group . 2021. Safety and efficacy of the BNT162b2 mRNA Covid-19 vaccine through 6 months. N Engl J Med 385:1761–1773. doi: 10.1056/NEJMoa2110345. - DOI - PMC - PubMed
-
- Hashem AM, Algaissi A, Almahboub SA, Alfaleh MA, Abujamel TS, Alamri SS, Alluhaybi KA, Hobani HI, AlHarbi RH, Alsulaiman RM, ElAssouli M-Z, Hala S, Alharbi NK, Alhabbab RY, AlSaieedi AA, Abdulaal WH, Bukhari A, AL-Somali AA, Alofi FS, Khogeer AA, Pain A, Alkayyal AA, Almontashiri NAM, Ahmad BM, Li X. 2020. Early humoral response correlates with disease severity and outcomes in COVID-19 patients. Viruses 12:1390. doi: 10.3390/v12121390. - DOI - PMC - PubMed
-
- Benner SE, Patel EU, Laeyendecker O, Pekosz A, Littlefield K, Eby Y, Fernandez RE, Miller J, Kirby CS, Keruly M, Klock E, Baker OR, Schmidt HA, Shrestha R, Burgess I, Bonny TS, Clarke W, Caturegli P, Sullivan D, Shoham S, Quinn TC, Bloch EM, Casadevall A, Tobian AAR, Redd AD. 2020. SARS-CoV-2 antibody avidity responses in COVID-19 patients and convalescent plasma donors. J Infect Dis 222:1974–1984. doi: 10.1093/infdis/jiaa581. - DOI - PMC - PubMed
Publication types
MeSH terms
Substances
Grants and funding
LinkOut - more resources
Full Text Sources
Medical
Research Materials
Miscellaneous
