. 2022 Nov 2;17(11):e0275623.
doi: 10.1371/journal.pone.0275623. eCollection 2022.

RASCL: Rapid Assessment of Selection in CLades through molecular sequence analysis

Affiliations

RASCL: Rapid Assessment of Selection in CLades through molecular sequence analysis

Alexander G Lucaci et al. PLoS One. .

Abstract

An important unmet need revealed by the COVID-19 pandemic is the near-real-time identification of potentially fitness-altering mutations within rapidly growing SARS-CoV-2 lineages. Although powerful molecular sequence analysis methods are available to detect and characterize patterns of natural selection within modestly sized gene-sequence datasets, the computational complexity of these methods and their sensitivity to sequencing errors render them effectively inapplicable in large-scale genomic surveillance contexts. Motivated by the need to analyze new lineage evolution in near-real time using large numbers of genomes, we developed the Rapid Assessment of Selection within CLades (RASCL) pipeline. RASCL applies state of the art phylogenetic comparative methods to evaluate selective processes acting at individual codon sites and across whole genes. RASCL is scalable and produces automatically updated regular lineage-specific selection analysis reports: even for lineages that include tens or hundreds of thousands of sampled genome sequences. Key to this performance is (i) generation of automatically subsampled high quality datasets of gene/ORF sequences drawn from a selected "query" viral lineage; (ii) contextualization of these query sequences in codon alignments that include high-quality "background" sequences representative of global SARS-CoV-2 diversity; and (iii) the extensive parallelization of a suite of computationally intensive selection analysis tests. Within hours of being deployed to analyze a novel rapidly growing lineage of interest, RASCL will begin yielding JavaScript Object Notation (JSON)-formatted reports that can be either imported into third-party analysis software or explored in standard web-browsers using the premade RASCL interactive data visualization dashboard. By enabling the rapid detection of genome sites evolving under different selective regimes, RASCL is well-suited for near-real-time monitoring of the population-level selective processes that will likely underlie the emergence of future variants of concern in measurably evolving pathogens with extensive genomic surveillance.


Conflict of interest statement

The authors have declared that no competing interests exist

Figures

Fig 1
Fig 1. The RASCL application overview.
We highlight the high-level architecture of the RASCL workflow. These include what we call multiple Phases, including a (1) Map and Compress step, where input query and background whole genome sequences are separated into individual genes from the viral genome by mapping to the reference gene. For each gene we then extract the representative gene diversity using genetic distance clustering. (2) is where we prepare our gene alignments for selection analysis. We accomplish this by merging alignments from the background and query datasets into a “combined” dataset. From this, we infer a phylogenetic tree and annotate it based on query and background sequences. (3) We perform selection analyses in HyPhy (described in further detail in the Methods section). (4) We combine the results of selection analyses across the viral genome by mapping substitutions to each position in the viral genome to create a selection ‘profile’ for each statistically significant site into an interpretable JSON-formatted file. These combined results are then used for further post-hoc or downstream analysis or ingested by our interactive notebook.
Fig 2
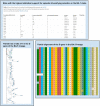
Fig 2. Example visualization using our interactive notebook.
Here, we highlight some of the features of our interactive notebook which was created to facilitate result exploration. Key features include: (1) tables with statistically significant results for each selection analysis, (2) the ability to explore the full phylogenetic tree or a site-level tree to explore selection acting on individual sites and (3) we provide a multiple sequence alignment viewer for any of the genes in the results.
Fig 3
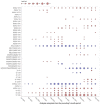
Fig 3. Evolutionary trajectories of 40 high-priority selected sites (from Table 4).
If a site was found to be positively (red) or negatively (blue) selected during a specific time, a bubble will be drawn at a corresponding point on the plot. The area of the bubble is scaled as -log10 p, where p is the p-value of the FEL likelihood ratio test. Larger bubbles correspond to smaller p-values; p-values are not directly comparable between different time windows and different genes due to differences in sample sizes and other factors. The x-axis shows the endpoint of the time-window, e.g., March 30th, 2021, will correspond to the analysis performed with the data from January 1, 2021, to March 30, 2021. Figures like this can be generated with the “Evidence of natural selection history operating on SARS-CoV-2 genomes” ObservableHQ notebook (https://observablehq.com/@spond/sars-cov-2-selected-sites).
Fig 4
Fig 4. Temporal trends of the substitution combinations at selected sites represented in Table 4 in the Spike gene for B.1.621 (μ) sequences in 2021 (from left to right: S/27, S/146, S/147, S/1258, S/1259).
The symbol “.” denotes the reference residue at that site. Figures like this can be generated using Trends in mutational patterns across SARS-CoV-2 Spike enabled by data from https://observablehq.com/@spond/spike-trends. Additional search parameters include “B.1.621[pangolin] AND 20210101[after]”. Notebook link: https://observablehq.com/@spond/spike-trends.
Fig 5
Fig 5. Temporal trends of the substitution combinations at all sites represented in Table 4 in the RDRP (RNA-dependent RNA polymerase) gene for B.1.621 (μ) sequences in 2021 (from left to right: RDRP/26, RDRP/228, RDRP/344, RDRP/364, RDRP/443, RDRP/449, RDRP/521, RDRP/879).
The symbol “.” denotes the reference residue at that site. Figures like this can be generated using Trends in mutational patterns across SARS-CoV-2 Spike enabled by data from https://observablehq.com/@spond/spike-trends. Additional search parameters include “B.1.621[pangolin] AND 20210101[after]”. Notebook link https://observablehq.com/@spond/spike-trends.
Fig 6
Fig 6. Spike protein crystal structure annotation 6CRZ (https://www.rcsb.org/structure/6CRZ) with MEME sites, a measure of episodic selection (These sites are listed in Table 4).
The color legend for these figures is as follows: the N-Terminal domain (NTD) region is highlighted in Blue, the Receptor binding domain (RBD) region is highlighted in Green, The Heptad Repeat (HR) region is highlighted in Ruby, MEME (Positively selected) sites are highlighted in Orange. To interact with the figure above visit: https://observablehq.com/@aglucaci/categorical-ngl-rascl-mu.

Update of

References

    1. Harvey WT, Carabelli AM, Jackson B, Gupta RK, Thomson EC, Harrison EM, et al. SARS-CoV-2 variants, spike mutations and immune escape. Nat Rev Microbiol. 2021. Jul;19(7):409–24. doi: 10.1038/s41579-021-00573-0 - DOI - PMC - PubMed
    1. Arenas M. Trends in substitution models of molecular evolution. Front Genet. 2015;6:319. doi: 10.3389/fgene.2015.00319 - DOI - PMC - PubMed
    1. Kosakovsky Pond SL, Poon AFY, Velazquez R, Weaver S, Hepler NL, Murrell B, et al. HyPhy 2.5-A Customizable Platform for Evolutionary Hypothesis Testing Using Phylogenies. Mol Biol Evol. 2020. Jan 1;37(1):295–9. doi: 10.1093/molbev/msz197 - DOI - PMC - PubMed
    1. Weaver S, Shank SD, Spielman SJ, Li M, Muse SV, Kosakovsky Pond SL. Datamonkey 2.0: A Modern Web Application for Characterizing Selective and Other Evolutionary Processes. Mol Biol Evol. 2018. Mar 1;35(3):773–7. doi: 10.1093/molbev/msx335 - DOI - PMC - PubMed
    1. Benvenuto D, Giovanetti M, Ciccozzi A, Spoto S, Angeletti S, Ciccozzi M. The 2019-new coronavirus epidemic: Evidence for virus evolution. J Med Virol. 2020. Apr;92(4):455–9. doi: 10.1002/jmv.25688 - DOI - PMC - PubMed

Publication types