. 2022 Nov 2;14(669):eabq4433.
doi: 10.1126/scitranslmed.abq4433. Epub 2022 Nov 2.

An immune dysfunction score for stratification of patients with acute infection based on whole-blood gene expression

Eddie Cano-Gamez  1   2 Katie L Burnham  2 Cyndi Goh  1   3 Alice Allcock  1 Zunaira H Malick  1 Lauren Overend  1 Andrew Kwok  1 David A Smith  1   4 Hessel Peters-Sengers  5   6   7 David Antcliffe  8 GAinS InvestigatorsStuart McKechnie  9 Brendon P Scicluna  5   10   11 Tom van der Poll  5 Anthony C Gordon  8 Charles J Hinds  12 Emma E Davenport  2 Julian C Knight  1   4 Nigel WebsterHelen GalleyJane TaylorSally HallJenni AddisonSian RoughtonHeather TennantAchyut GuleriNatalia WaddingtonDilshan ArawwawalaJohn DurcanAlasdair ShortKaren SwanSarah WilliamsSusan SmolenChristine Mitchell-InwangTony GordonEmily ErringtonMaie TempletonPyda VenateshGeraldine WardMarie McCauleySimon BaudouinCharley HighamJasmeet SoarSally GrierElaine HallStephen BrettDavid KitsonRobert WilsonLaura MountfordJuan MorenoPeter HallJackie HewlettStuart McKechnieChristopher GarrardJulian MilloDuncan YoungPaula HuttonPenny ParsonsAlex SmithsRoser Faras-ArrayaJasmeet SoarParizade RaymodeJonathan ThompsonSarah BowreySandra KazembeNatalie RichPrem AndreouDawn HalesEmma RobertsSimon FletcherMelissa RosbergenGeorgina GlisterJeronimo Moreno CuestaJulian BionJoanne MillarElsa Jane PerryHeather WillisNatalie MitchellSebastian RuelRonald CarreraJude WildeAnnette NilsonSarah LeesAtul KapilaNicola JacquesJane AtkinsonAbby BrownHeather ProwseAnton KrigeMartin BlandLynne BullockDonna HarrisonGary MillsJohn HumphreysKelsey ArmitageShond LahaJacqueline BaldwinAngela WalshNicola DohertyStephen DrageLaura Ortiz-Ruiz de GordoaSarah LowesCharley HighamHelen WalshVerity CalderCatherine SwanHeather PayneDavid HigginsSarah AndrewsSarah MapplebackCharles HindChris GarrardD WatsonEleanor McLeesAlice PurdyMartin StotzAdaeze Ochelli-OkpueStephen BonnerIain WhiteheadKeith HugilVictoria GoodridgeLouisa CawthorMartin KuperSheik PaharyGeoffrey BellinganRichard MarshallHugh MontgomeryJung Hyun RyuGeorgia BercadesSusan BoludaAndrew BentleyKatie MccalmanFiona JefferiesJulian KnightEmma DavenportKatie BurnhamNarelle MaugeriJayachandran RadhakrishnanYuxin MiAlice AllcockCyndi Goh
Affiliations

An immune dysfunction score for stratification of patients with acute infection based on whole-blood gene expression

Eddie Cano-Gamez et al. Sci Transl Med. .

Abstract

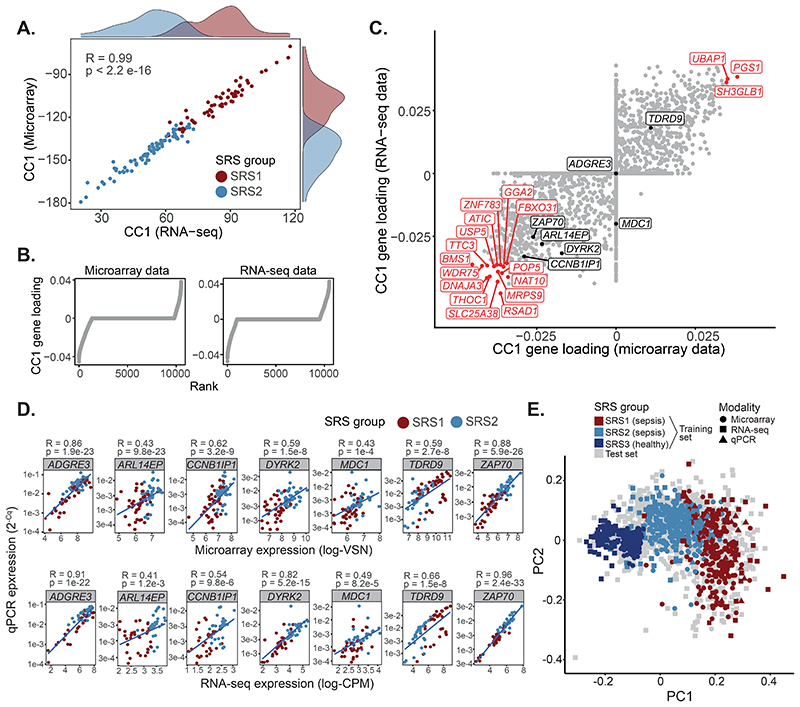
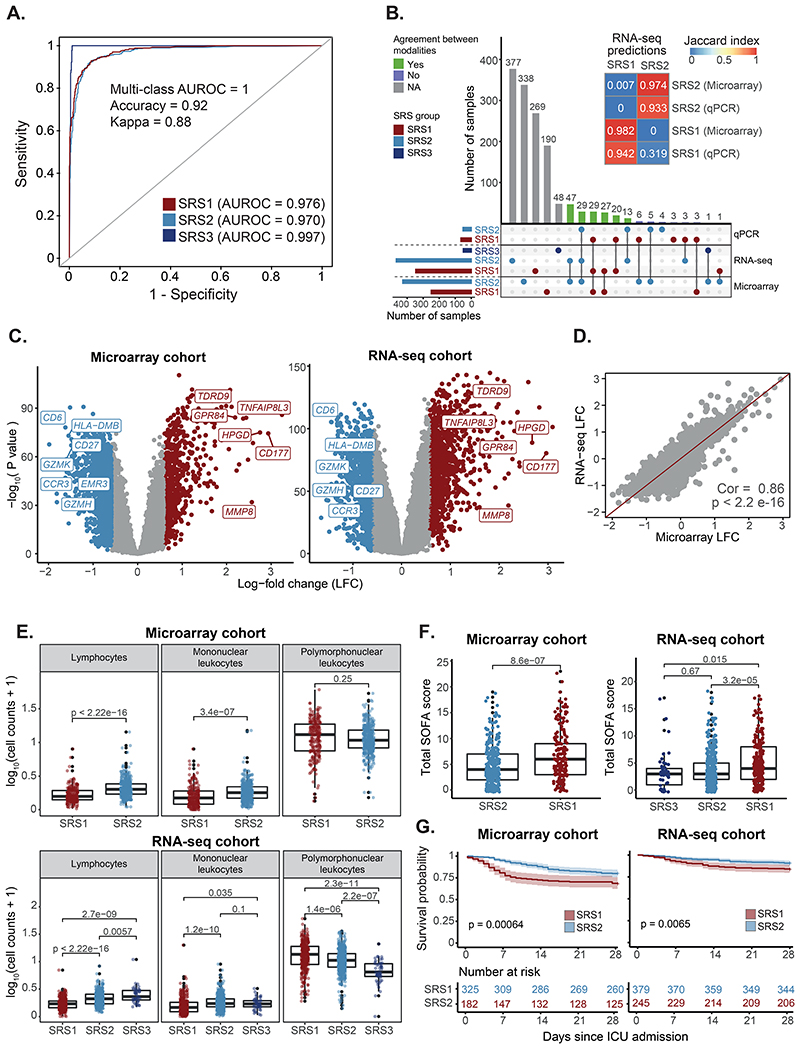
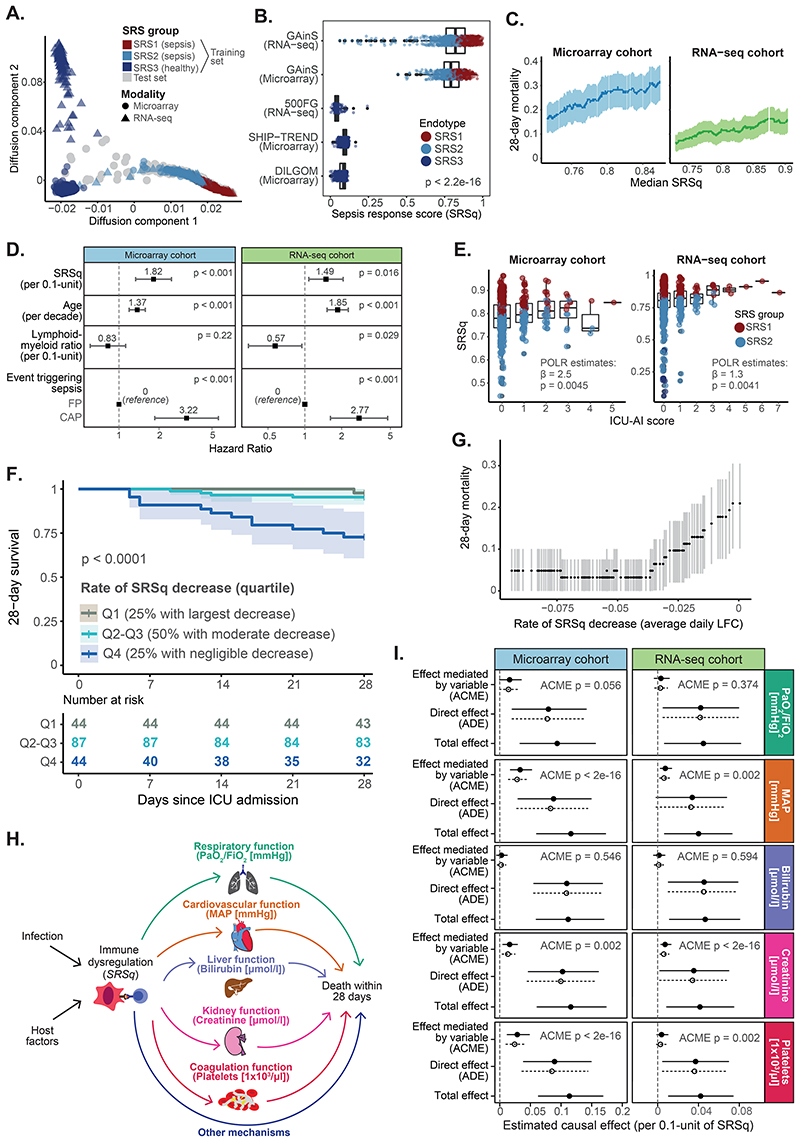
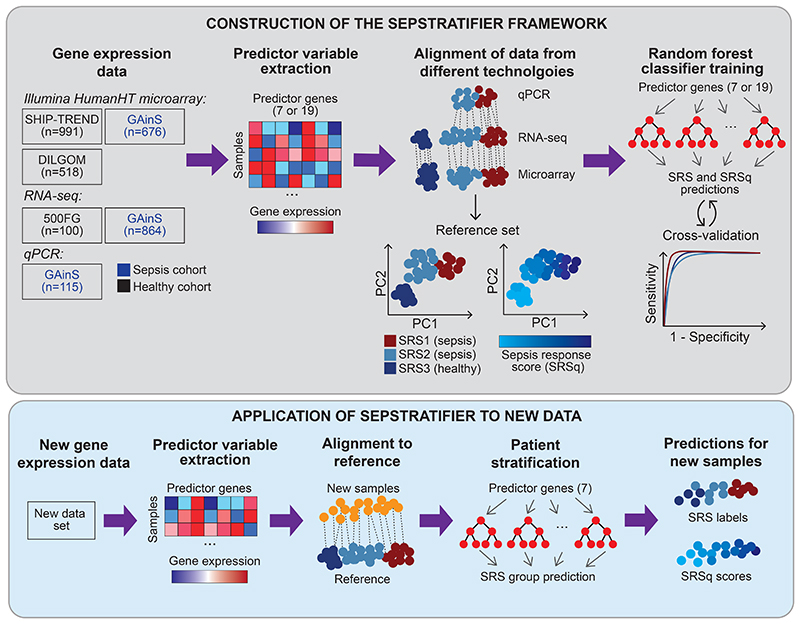
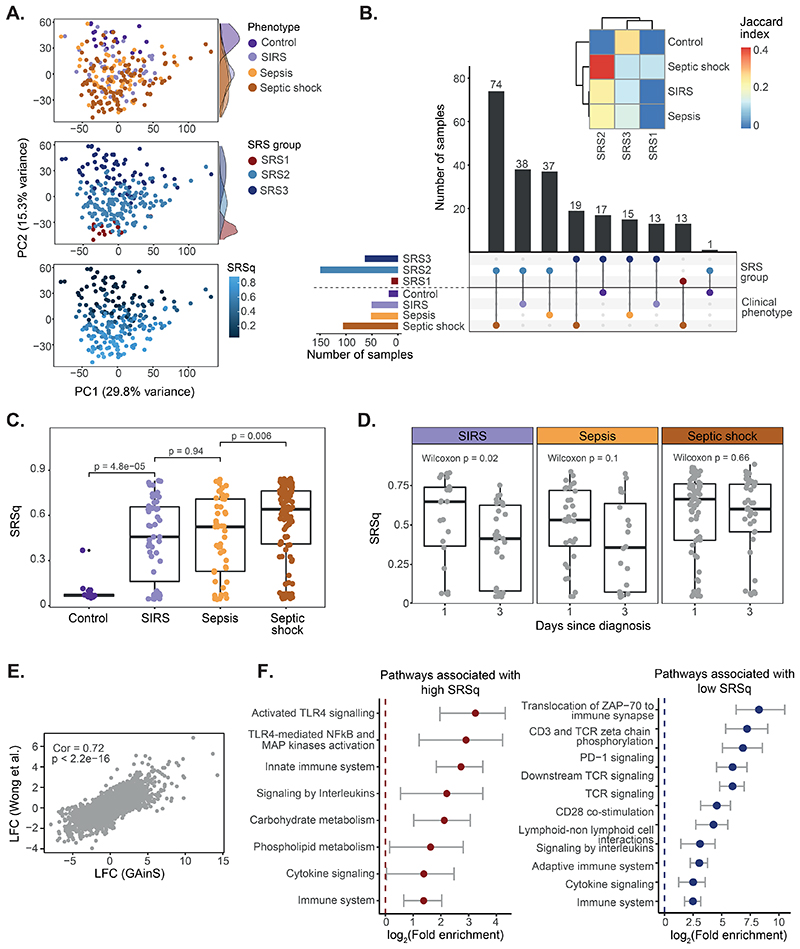
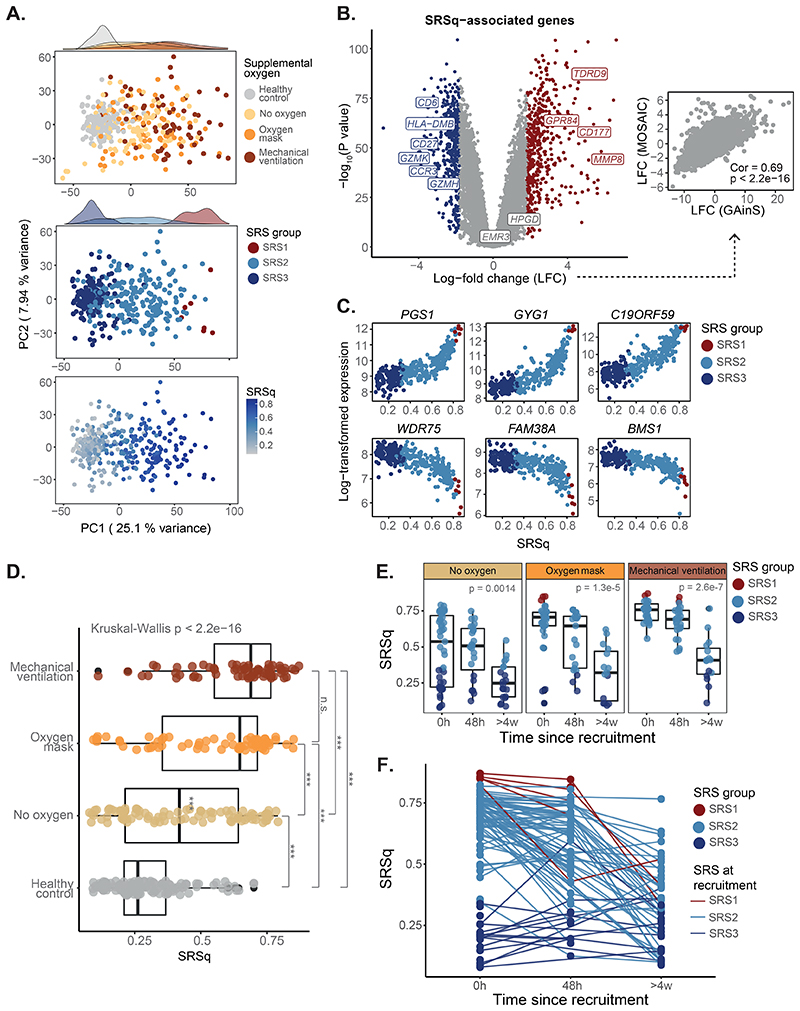
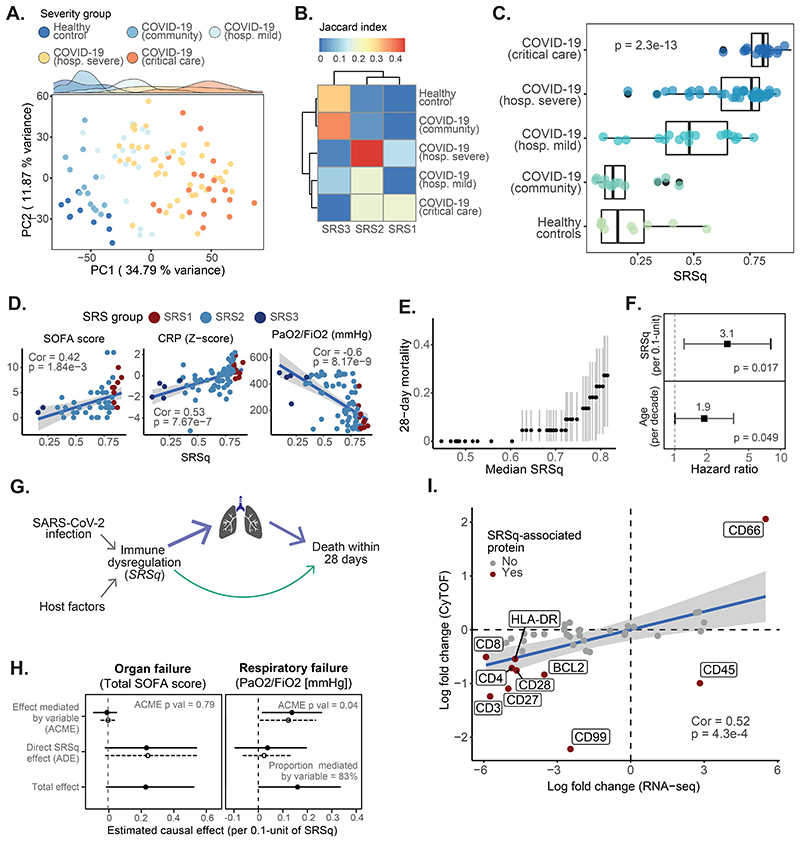
Dysregulated host responses to infection can lead to organ dysfunction and sepsis, causing millions of global deaths each year. To alleviate this burden, improved prognostication and biomarkers of response are urgently needed. We investigated the use of whole-blood transcriptomics for stratification of patients with severe infection by integrating data from 3149 samples from patients with sepsis due to community-acquired pneumonia or fecal peritonitis admitted to intensive care and healthy individuals into a gene expression reference map. We used this map to derive a quantitative sepsis response signature (SRSq) score reflective of immune dysfunction and predictive of clinical outcomes, which can be estimated using a 7- or 12-gene signature. Last, we built a machine learning framework, SepstratifieR, to deploy SRSq in adult and pediatric bacterial and viral sepsis, H1N1 influenza, and COVID-19, demonstrating clinically relevant stratification across diseases and revealing some of the physiological alterations linking immune dysregulation to mortality. Our method enables early identification of individuals with dysfunctional immune profiles, bringing us closer to precision medicine in infection.


Conflict of interest statement

Competing interests

ACG has received consulting fees as part of a Data Monitoring Committee from 30 Respiratory paid to his institution. All remaining authors declare that they have no competing interests.

Figures

Fig. 1
Fig. 1. Construction of a reference map of gene expression in sepsis using data from three different platforms.
(A) CCA analysis of GAinS samples with RNA-seq and microarray data available. Histograms represent marginal SRS1 (red) and SRS2 (blue) distributions. R = Pearson correlation; p = correlation p value. (B) Contribution of each gene to CC1, ranked increasingly. (C) CC1 contribution of each microarray (X axis) and RNA-seq (Y axis) feature. Black and red dots indicate genes in the Davenport signature and amongst the top 1% highest CC1 contributors, respectively. (D) Correlation of microarray/RNA-seq (X axis) and qRT-PCR (Y axis) measurements. Best linear fits are shown. R = Pearson correlation; p = correlation p value. (E) A reference map of sepsis based on the Davenport signature (PCA visualization). Dots represent samples, with shapes indicating profiling platform and colors SRS group.
Fig. 2
Fig. 2. Stratification of patients with sepsis based on whole blood gene expression.
(A) Receiver operating characteristic (ROC) curves showing cross-validation performance. AUROCs = area under the ROC curve. (B) UpSet plot showing prediction agreement between modalities. Colors indicate SRS classes (horizontal) and cross-modality agreement (vertical). Gray bars indicate samples with only one modality available. The heatmap (top) shows the level of cross-modality agreement (Jaccard index). (C) Volcano plot showing SRS1/SRS2 differential gene expression. Red indicates upregulation in SRS1 and blue upregulation in SRS2. (D) Correlation between SRS-associated log-fold changes from microarray and RNA-seq. The identity line is shown as a reference. Cor = Pearson correlation; p = correlation p value. (E) Cell count distribution per SRS group. p = T-test (top) or Kruskal-Wallis (bottom) p value. (F) SOFA score distribution per SRS group at the latest available time point. p = T-test (left) or Kruskal-Wallis (right) p value. (G) Kaplan-Meier curves of 28-day survival per SRS group, defined at the latest available time point. Shades indicate 95% confidence intervals. p = log-rank test p value.
Fig. 3
Fig. 3. A quantitative score reflective of immune dysfunction severity.
(A) Diffusion map estimated using the Extended gene signature. Colors indicate SRS group; shapes indicate profiling platforms. (B) Distribution of SRSq across cohorts. p = Kruskal-Wallis test p value. (C) Association between SRSq and mortality in GAinS, as determined using a sliding window approach. Shades represent 95% confidence intervals. (D) Estimated hazard ratios and 95% confidence intervals. (E) SRSq values stratified by ICU-acquired infection score (ICU-AI). β = regression coefficient; p = regression p value. (F) Kaplan-Meier curves of 28-day survival in patients sampled at multiple time points. Patients were stratified into quartiles based on their rate of SRSq reduction over time. Shades indicate 95% confidence intervals. p = log-rank test p value. (G) Association between rate of SRSq reduction and mortality, as determined using a sliding window. Shades represent 95% confidence intervals. (H) Causal model assumed for mediation analysis. Arrows represent causal directions. (I) Mediation effects. Lines indicate 95% confidence intervals, with solid and dotted lines corresponding to the treatment (high SRSq) and control (low SRSq) conditions. ACME = Average Causal Mediation Effect; ADE = Average Direct Effect; p = mediation p value.
Fig. 4
Fig. 4. SepstratifieR’s construction and application to new data.
Schematic representation of how SepstratifieR was built (top panel) and how it is applied to new data (bottom panel). Publicly available data (5, 6) were used to construct sepsis reference maps based on small gene signatures. Next, random forest models were trained to predict SRS and SRSq. When applying SepstratifieR to new samples, genes in the signature of interest are extracted and used to align new samples to the reference map. After alignment, SRS and SRSq were predicted using pre-trained models.
Fig. 5
Fig. 5. Stratification of patients with pediatric sepsis by SRSq.
(A) PCA plots based on whole blood transcriptomes. Samples are colored by illness severity (top), SRS (middle), and SRSq (bottom). (B) UpSet plot showing the agreement between SRS predictions and disease severity. Bar colors indicate SRS groups (top) and clinical phenotypes (bottom). The heatmap (top) quantifies the extent of this agreement (Jaccard indices). (C) SRSq distribution by clinical phenotype; p = Wilcoxon test p value. (D) SRSq distribution by time point and clinical phenotype. p = Wilcoxon test p value. (E) Correlation between SRSq-associated gene expression changes in adult (GAinS) and pediatric sepsis. Cor = Pearson correlation; p = correlation p value. (F) Immune-relevant pathways positively (left) or negatively (right) enriched in SRSq-associated genes.
Fig. 6
Fig. 6. SRSq predicts oxygen requirement and reveals temporal immune dynamics in influenza.
(A) PCA plots based on whole blood transcriptomes. Samples are colored by oxygen requirement (top), SRS (middle), and SRSq (bottom). (B) Volcano plot showing genes differentially expressed along SRSq. Red indicates positive and blue negative associations with SRSq. The scatter plot (right) compares log-fold changes in sepsis (GAinS) and Influenza. Cor = Pearson correlation; p = correlation p value. (C) Top genes positively (top) and negatively (bottom) associated with SRSq. Samples are colored by SRS group. (D) SRSq stratified by supplemental oxygen requirement; p = Kruskal-Wallis test p value, *** = adjusted Dunn’s post-hoc test p < 0.01. (E) SRSq stratified by time since admission and oxygen requirement. Samples are colored by SRS group. p = Kruskal-Wallis test p value. (F) Line plot showing changes of SRSq over time. Line colors indicate SRS group assignment at recruitment.
Fig. 7
Fig. 7. SRSq predicts severity of illness and pinpoints mediators of COVID-19 mortality.
(A) PCA based on whole blood transcriptomes. Samples are colored by clinical severity. (B) Heatmap showing the overlap (as indicated by Jaccard index) between SRS and clinical severity groups. (C) SRSq stratified by clinical severity. p = Kruskal-Wallis test p value. (D) Association between SRSq and clinical variables. Samples are colored by SRS group. Lines indicate best linear fits. Cor = Pearson correlation; p = correlation p value. (E) Association between SRSq and mortality. (F) Estimated hazard ratios and 95% confidence intervals. (G) Causal model used for mediation analysis. Arrows represent causal directions. (H) Results from mediation analysis, with SOFA (left) and P/F ratios (right) as mediators. Lines indicate 95% confidence intervals. Solid and dotted lines represent estimates for the treatment (high SRSq) and control (low SRSq) conditions. ACME = Average Causal Mediation Effect; ADE = Average Direct Effect; p = mediation p value. (I) Correlation between SRSq-associated mRNA (x axis) and protein (y axis) changes. Dark red indicates the protein is significantly associated with SRSq. Cor = Pearson correlation; p = correlation p value.

References

    1. GBD 2019 Diseases and Injuries Collaborators. Global burden of 369 diseases and injuries in 204 countries and territories, 1990-2019: a systematic analysis for the Global Burden of Disease Study 2019. Lancet. 2020;396:1204–1222. - PMC - PubMed
    1. van der Poll T, van de Veerdonk FL, Scicluna BP, Netea MG. The immunopathology of sepsis and potential therapeutic targets. Nat Rev Immunol. 2017;17:407–420. - PubMed
    1. Rudd KE, Johnson SC, Agesa KM, Shackelford KA, Tsoi D, Kievlan DR, Colombara DV, Ikuta KS, Kissoon N, Finfer S, Fleischmann-Struzek C, et al. Global, regional, and national sepsis incidence and mortality, 1990-2017: analysis for the Global Burden of Disease Study. Lancet. 2020;395:200–211. - PMC - PubMed
    1. Sandhu C, Qureshi A, Emili A. Panomics for Precision Medicine. Trends Mol Med. 2018;24:85–101. - PMC - PubMed
    1. Davenport EE, Burnham KL, Radhakrishnan J, Humburg P, Hutton P, Mills TC, Rautanen A, Gordon AC, Garrard C, Hill AVS, Hinds CJ, et al. Genomic landscape of the individual host response and outcomes in sepsis: a prospective cohort study. Lancet Respir Med. 2016;4:259–271. - PMC - PubMed

Publication types

LinkOut - more resources