. 2022 Nov 8;119(45):e2204443119.
doi: 10.1073/pnas.2204443119. Epub 2022 Nov 2.

IER3IP1 is critical for maintaining glucose homeostasis through regulating the endoplasmic reticulum function and survival of β cells

Affiliations

IER3IP1 is critical for maintaining glucose homeostasis through regulating the endoplasmic reticulum function and survival of β cells

Jing Yang et al. Proc Natl Acad Sci U S A. .

Abstract

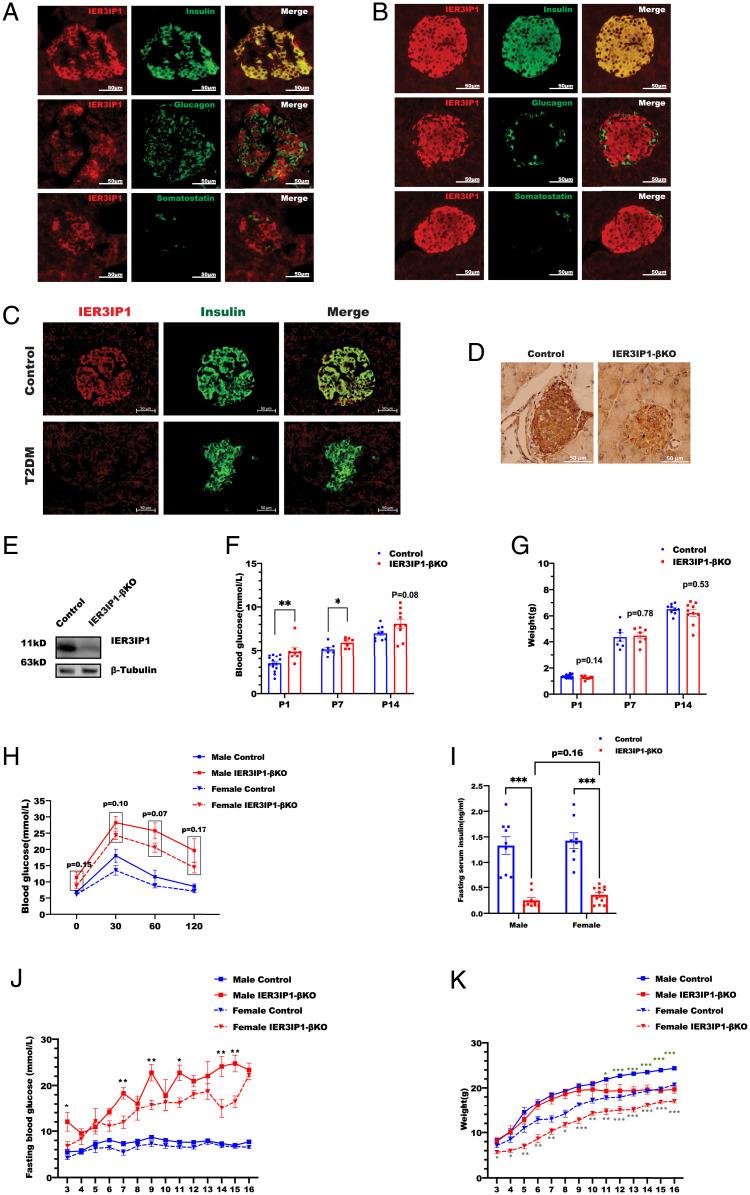
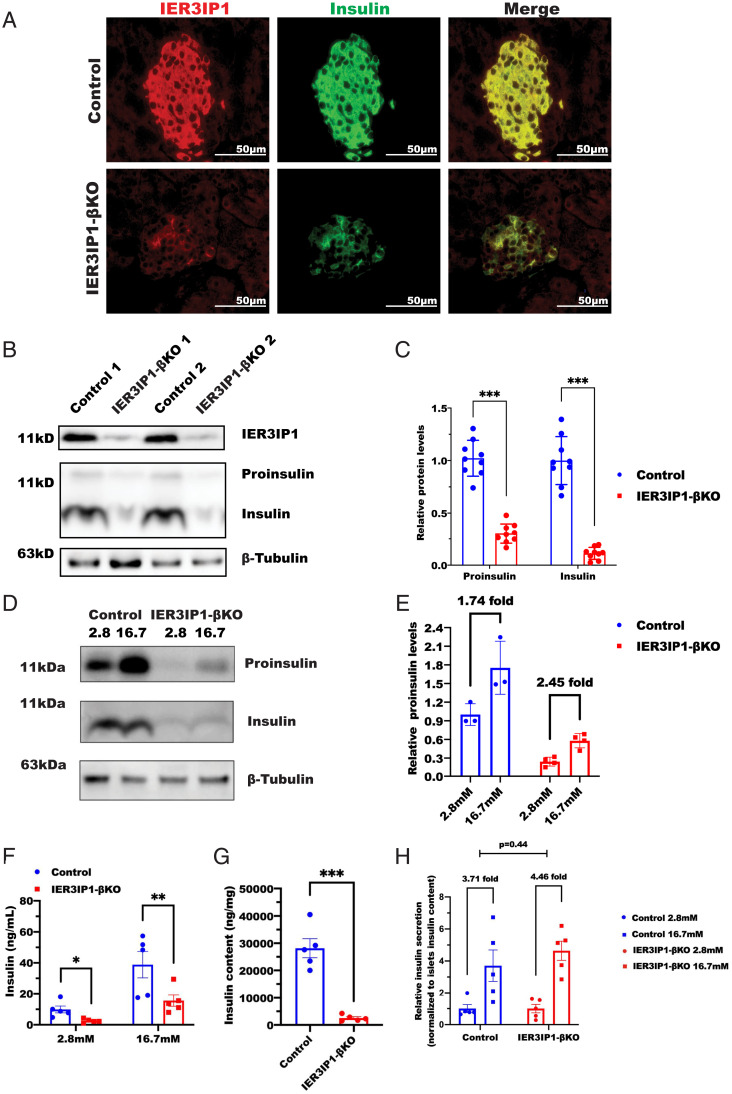
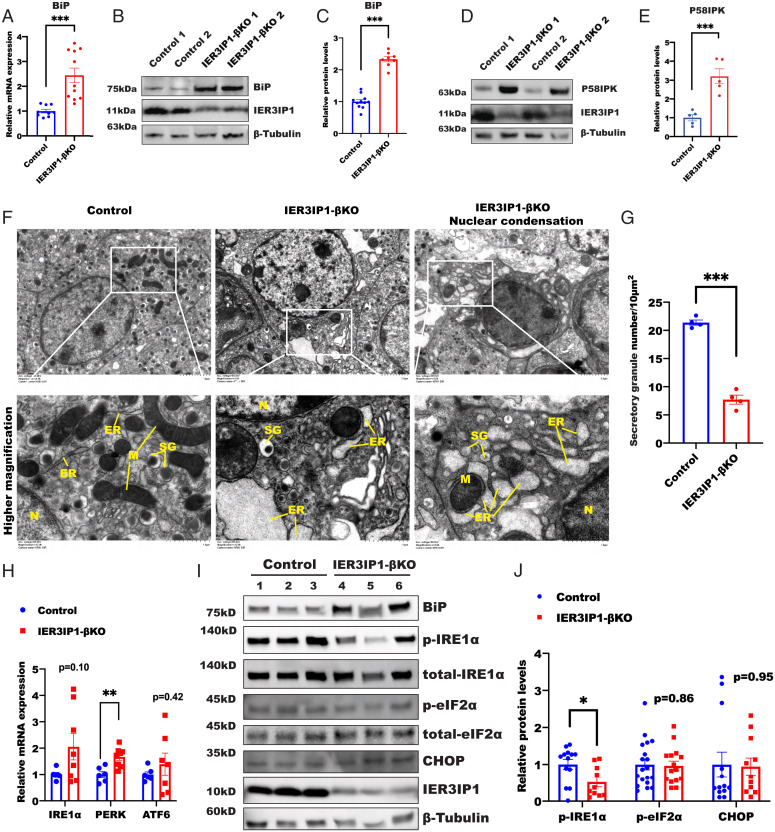
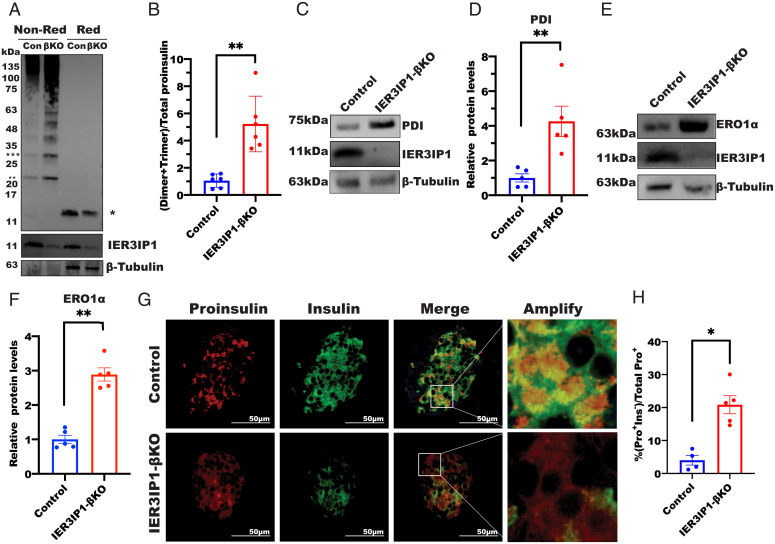
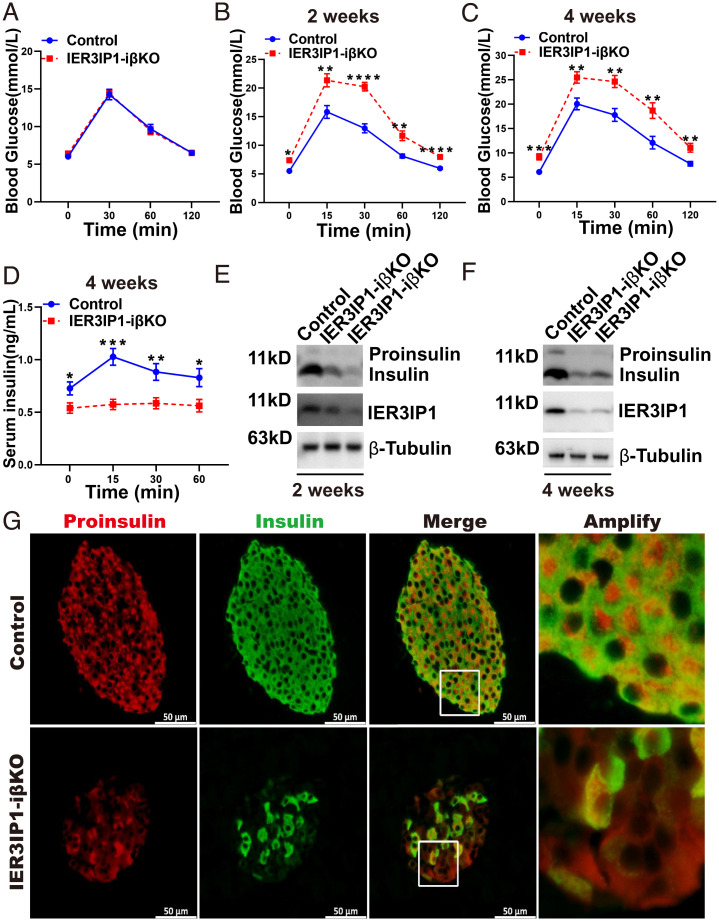
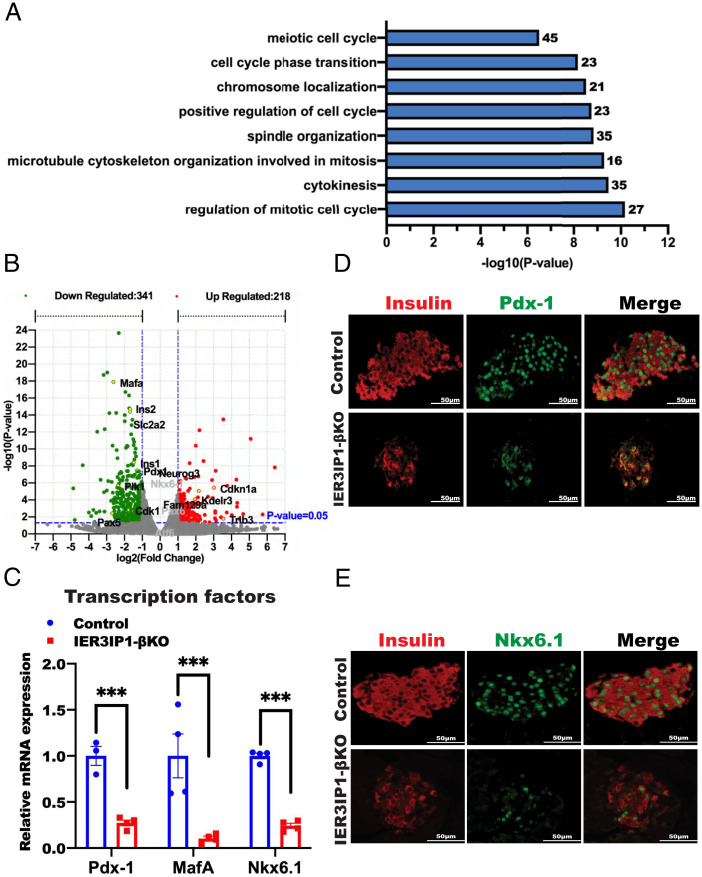
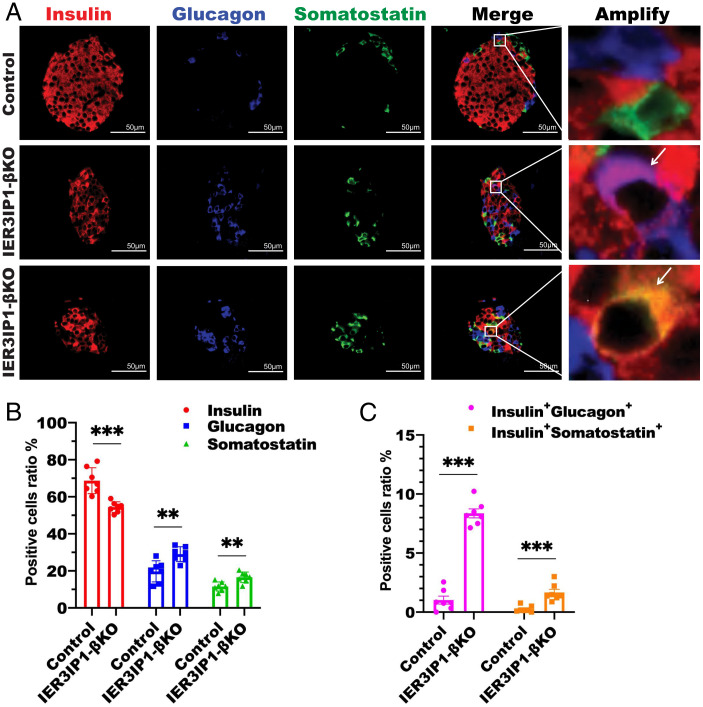
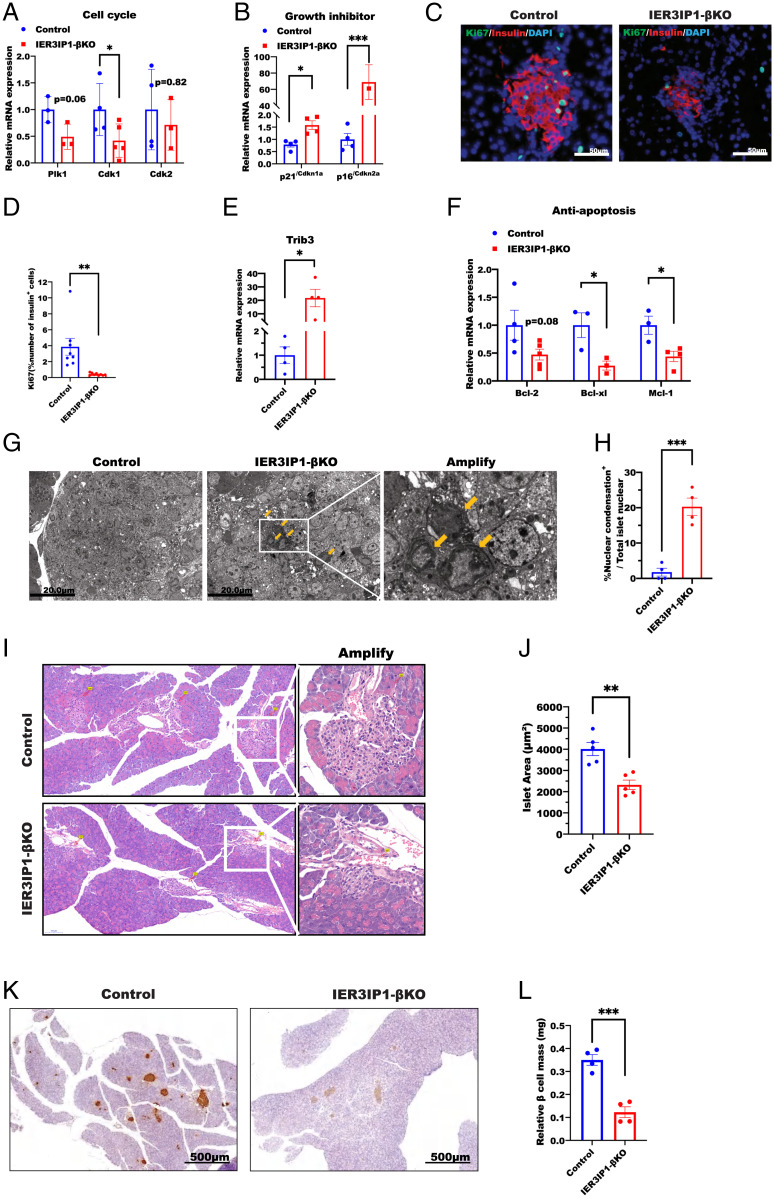
Recessive mutations in IER3IP1 (immediate early response 3 interacting protein 1) cause a syndrome of microcephaly, epilepsy, and permanent neonatal diabetes (MEDS). IER3IP1 encodes an endoplasmic reticulum (ER) membrane protein, which is crucial for brain development; however, the role of IER3IP1 in β cells remains unknown. We have generated two mouse models with either constitutive or inducible IER3IP1 deletion in β cells, named IER3IP1-βKO and IER3IP1-iβKO, respectively. We found that IER3IP1-βKO causes severe early-onset, insulin-deficient diabetes. Functional studies revealed a markedly dilated β-cell ER along with increased proinsulin misfolding and elevated expression of the ER chaperones, including PDI, ERO1, BiP, and P58IPK. Islet transcriptome analysis confirmed by qRT-PCR revealed decreased expression of genes associated with β-cell maturation, cell cycle, and antiapoptotic genes, accompanied by increased expression of antiproliferation genes. Indeed, multiple independent approaches further demonstrated that IER3IP1-βKO impaired β-cell maturation and proliferation, along with increased condensation of β-cell nuclear chromatin. Inducible β-cell IER3IP1 deletion in adult (8-wk-old) mice induced a similar diabetic phenotype, suggesting that IER3IP1 is also critical for function and survival even after β-cell early development. Importantly, IER3IP1 was decreased in β cells of patients with type 2 diabetes (T2D), suggesting an association of IER3IP1 deficiency with β-cell dysfunction in the more-common form of diabetes. These data not only uncover a critical role of IER3IP1 in β cells but also provide insight into molecular basis of diabetes caused by IER3IP1 mutations.

Keywords: ER stress; IER3IP1; diabetes; β cell proliferation; β cell survival.


Conflict of interest statement

The authors declare no competing interest.

Figures

Fig. 1.
Fig. 1.
IER3IP1 is highly expressed in β cells, and IER3IP1-βKO mice develop early-onset, insulin-deficient diabetes. (A and B) The expression of IER3IP1 in (A) human and (B) mouse pancreases was detected via the immunostaining with anti-IER3IP1 (red) with anti-insulin (green), antiglucagon (green), or antisomatostatin (green). (C) The expression of IER3IP1 in pancreases of donors with T2D were detected via the immunostaining with anti-IER3IP1 (red) and anti-insulin (green). (D) Immunohistochemistry staining was performed to detect the expression of IER3IP1 in pancreases of 3-wk-old IER3IP1-βKO mice or flox+/+ control mice. (E) IER3IP1 protein expression from 3-wk-old flox+/+ control mice or IER3IP1-βKO mice was examined by western blotting using anti-IER3IP1. (F) Blood glucose (BG) of 1-, 7-, and 14-d-old flox+/+ control mice or IER3IP1-βKO mice (control n = 7–15, βKO n = 7–10). *P < 0.05 and **P < 0.01. (G) Body weight (BW) of same group mice as F. (H) Oral glucose tolerance tests were performed in 3-wk-old male (control n = 7, βKO n = 7) and female mice (control n = 10, βKO n = 10). The levels of BG are all higher in both IER3IP1-βKO male and female mice than that of the control mice. However, no statistical differences were observed between male and female IER3IP1-βKO mice. (I) Fasting serum insulin levels of 3-wk-old male (control n = 8, βKO n = 9) and female (control n = 8, βKO n = 11) mice were measured using insulin enzyme-linked immunosorbent assay (ELISA). ***P < 0.001. (J) Fasting blood glucose of male (control n = 10, βKO n = 5) and female (control n = 10, βKO n = 7) mice was monitored weekly till 16 wk. *P < 0.05 and **P < 0.01, respectively, comparing male and female IER3IP1-βKO mice. (K) BWs from same group of J were monitored. Asterisks with green color indicate statistical differences between male IER3IP1-βKO and control mice. Asterisks with gray indicate statistical differences between female IER3IP1-βKO and control mice. All values shown in this figure are mean ± SEM. *P < 0.05, **P < 0.01 and ***P < 0.001.
Fig. 2.
Fig. 2.
IER3IP1-βKO leads to decreased insulin content and absolute amount of secreted insulin, however glucose stimulated proinsulin synthesis and GSIS are preserved. (A) Representative immunofluorescence images of anti-IER3IP1 (red) and anti-insulin (green) in pancreatic sections from 3-wk-old flox+/+ control and IER3IP1-βKO mice. (B) Islets isolated from 3-wk-old control and IER3IP1-βKO mice were directly lysated. Western blots were performed to detect proinsulin and insulin, and β-tubulin was used as a loading control. (C) Quantification of protein levels of proinsulin and insulin in B (n = 9). ***P < 0.001. (D) Islets isolated from 3-wk-old flox+/+ control and IER3IP1-βKO mice were incubated with media containing either 2.8 mM or 16.7 mM glucose for 5 h before lysated for western blotting. (E) Quantification of fold increases of proinsulin shown in D (control n = 3, βKO n = 4). (F) GSIS was performed, and insulin levels were measured in isolated islets from flox+/+ control and IER3IP1-βKO mice. (G) Insulin content in the islets of F were measured using insulin ELISA. (H) Secreted insulin was normalized to insulin content of the islets. All experiment shown in FH were performed using islets from 3-wk-old mice (n = 5 in each group). Values were shown as mean ± SEM. *P < 0.05, **P < 0.01, and ***P < 0.001.
Fig. 3.
Fig. 3.
IER3IP1-βKO induces ER stress without marked activation of UPR. (A) mRNA levels of BiP from 3-wk-old flox+/+ control or IER3IP1-βKO mouse islets (control n = 9, βKO n = 11). (B and C) Protein levels of BiP from 3-wk-old flox+/+ control or IER3IP1-βKO mouse islets were detected by western blots in B and quantified in C (control n = 11, βKO n = 8). (D and E) Protein levels of P58IPK from 3-wk-old flox+/+ control or IER3IP1-βKO mouse islets were detected by western blots in D and quantified in E (n = 5 in each group). (F) Representative transmission electron microscopy showing markedly dilated ER in β cells of 3-wk-old IER3IP1-βKO mice, SG: secretory granule, M: mitochondria, N: nuclear. (G) Quantification of secretory granules of control or IER3IP1-βKO mouse islets (n = 4 in each group, seven random fields per mouse were analyzed). (H) mRNA levels of IRE1α, PERK, and ATF6 from 3-wk-old flox+/+ control or IER3IP1-βKO mouse islets (control n = 6, βKO n = 8). (I) Western blot showing the expression of BiP, phosphorylated IRE1α (p-IRE1α), total-IRE1, phosphorylated eIF2α (p-eIF2α), total-eIF2α, CHOP, and IER3IP1 from 3-wk-old flox+/+ control or IER3IP1-βKO mouse islets. (J) Protein levels of I were quantified in J (p-IRE1α control n = 13, βKO n = 10; p-eIF2α control n = 19, βKO n = 15; CHOP control n = 13, βKO n = 11). Values are shown as mean ± SEM. *P < 0.05, **P < 0.01, and ***P < 0.001.
Fig. 4.
Fig. 4.
IER3IP1-βKO impairs oxidative folding of proinsulin in the ER and upregulates the expression of ERO1 and PDI. (A) Oxidative folding of proinsulin in islets of 3-wk-old flox+/+ control or IER3IP1-βKO mice was analyzed by western blots using antiproinsulin under both nonreducing and reducing conditions. Single asterisk indicated total proinsulin under reducing conditions, double asterisks indicated disulfide-linked proinsulin dimers, and triple asterisks indicated disulfide-linked proinsulin trimers. (B) The ratios of proinsulin dimers plus trimers under nonreducing conditions to total proinsulin under reducing conditions were calculated (n = 6 in each group). (C and D) Protein levels of PDI in 3-wk-old flox+/+ control and IER3IP1-βKO islets were examined by western blots using anti-PDI in C and quantified in D (n = 5 in each group). (E and F) Protein levels of ERO1α in 3-wk-old flox+/+ control and IER3IP1-βKO islets were examined by western blots using anti-ERO1α in E and quantified in F (n = 5 in each group). (G) Representative immunofluorescence images showing staining of anti-insulin (green) and antiproinsulin (red) from 3-wk-old control and IER3IP1-βKO mice. (H) Ratio of proinsulin-positive/insulin-negative (Pro+Ins) cells to total proinsulin positive (Pro+) cells in 3-wk-old flox+/+ control and IER3IP1-βKO islets was calculated (control n = 4, βKO n = 5). Values were shown as mean ± SEM. *P < 0.05 and **P < 0.01.
Fig. 5.
Fig. 5.
Inducible deficiency of IER3IP1 in β cells after 8 wk of age decreases insulin content and causes diabetes. The mice of IER3IP1 flox+/+ with MIP-CreERT and IER3IP1 flox+/+ control were administrated with tamoxifen by intraperitoneal injection at 8 wk old as described in Methods. (A) Intraperitoneal glucose tolerance tests (IPGTTs) were performed before the injection of tamoxifen (n = 9 in each group). (B and C) IPGTTs were performed after 2 wk of the tamoxifen injection (B) and 4 wk of the injection (C) (n = 9 in each group). (D) Serum insulin levels of IER3IP1-iβKO and flox+/+ control male mice after 4 wk of tamoxifen treatment (n = 9 each group). (E and F) Protein levels of IER3IP1, proinsulin, and insulin were detected by western blots using freshly isolated islets after 2 wk (E) or 4 wk of tamoxifen injection (F). (G) Representative immunofluorescence images showing staining of anti-insulin (green) and antiproinsulin (red) from IER3IP1-iβKO and flox+/+ control male mice after 4 wk of tamoxifen treatment. Values are shown as mean ± SEM. *P < 0.05, **P < 0.01, ***P < 0.001, and ****P < 0.0001.
Fig. 6.
Fig. 6.
IER3IP1 deficiency alters the islet transcriptome, affecting cell cycle as well as β-cell identity and maturation. (A) GO analyses of RNA-seq data showed significant changes of pathways in the islets from 3-wk-old flox+/+ control and IER3IP1-βKO mouse islets. (B) Volcano plot depicting transcriptomics data with dotted line marking P = 0.05 on y axis and fold change of greater than 1 on x axis. (C) mRNA levels of indicated transcription factors were measured by qRT-PCR in islets of 3-wk-old flox+/+ control and IER3IP1-βKO mouse islets (control n = 3–4, βKO n = 4). Values were shown as mean ± SEM. ***P < 0.001. (D and E) Representative immunofluorescence images showing expression nuclear localization of β-cell maturation markers of Pdx-1 (D) and Nkx6.1 (E) from 3-wk-old flox+/+ control and IER3IP1-βKO mice.
Fig. 7.
Fig. 7.
IER3IP1-βKO decreases insulin-positive cells, increases glucagon- and somatostatin-positive cells, and doubles hormone-positive cells. (A) Representative immunofluorescence images showing major islet hormones, anti-insulin (red), antiglucagon (blue), and antisomatostatin (green) in pancreatic sections from 3-wk-old flox+/+ control and IER3IP1-βKO mice. (B) Percentages of insulin-positive cells, glucagon-positive cells, and somatostatin-positive cells (n = 7 in each group, four sections per pancreas and 4–10 islets per section were analyzed). (C) Percentages of insulin and glucagon double-positive cells (Insulin+Glucagon+) and insulin and somatostatin double-positive cells (Insulin+Somatostatin+) (n = 7). Values were shown as mean ± SEM. **P < 0.01 and ***P < 0.001.
Fig. 8.
Fig. 8.
IER3IP1-βKO causes a reduction of β-cell proliferation and increases abnormal nuclear chromatin condensation. (A and B) mRNA levels of genes associated with cell cycle in A and genes associated with inhibition of cell growth in B were examined by qRT-PCR from 3-wk-old flox+/+ control and IER3IP1-βKO islets (control n = 3–4, βKO n = 3–5). (C and D) Representative immunofluorescence images showing the staining of proliferation marker Ki67 from 3-wk-old flox+/+ control and IER3IP1-βKO islets were shown in C, and percentages of Ki67-positive cells in islet β cells were shown in D (n = 8–9 per group, four sections per pancreas and five to eight islets per section were analyzed). (E) mRNA levels of Trib3 in 3-wk-old mice of flox+/+ control and IER3IP1-βKO islets (n = 4 in each group). (F) mRNA levels of antiapoptotic genes in 3-wk-old flox+/+ control and IER3IP1-βKO islets (control n = 3–4, βKO n = 3–4). (G) Representative electron microscopy images showing chromatin condensation in islets of 3-wk-old IER3IP1-βKO mice. Yellow arrows point to abnormal nucleus. Scale bars: 20.0 μm. (H) Quantification of percentages of nuclear condensation in islets of G. Cells showing decreased cell diameter, increased density of cytoplasm, as well as pyknosis (condensed chromatin (39)) were quantified in islets of IER3IP1-βKO and control mice (n = 4, at least 40 cells/islet were counted in each mouse). (I) Representative hematoxylin and eosin images of pancreatic sections of 3-wk-old control and IER3IP1-βKO mice. (J) Quantification of islet area in I (n = 5 in each group); eight sections per pancreas and 6–26 islets per section were analyzed. (K) Representative images of immunohistochemistry staining of insulin of pancreatic sections of 3-wk-old control and IER3IP1-βKO mice. (L) Quantification of islet β-cell mass in K (n = 4 in each group); eight sections per pancreas and 6–27 islets per section were analyzed. Values were shown as mean ± SEM. *P < 0.05, **P < 0.01, and ***P < 0.001.

References

    1. Sanyoura M., Philipson L. H., Naylor R., Monogenic diabetes in children and adolescents: Recognition and treatment options. Curr. Diab. Rep. 18, 58 (2018). - PMC - PubMed
    1. Riddle M. C., et al. , Monogenic diabetes: From genetic insights to population-based precision in care. Reflections from a diabetes care editors’ expert forum. Diabetes Care 43, 3117–3128 (2020). - PMC - PubMed
    1. De Franco E., From biology to genes and back again: Gene discovery for monogenic forms of beta-cell dysfunction in diabetes. J. Mol. Biol. 432, 1535–1550 (2020). - PubMed
    1. De Franco E., et al. , YIPF5 mutations cause neonatal diabetes and microcephaly through endoplasmic reticulum stress. J. Clin. Invest. 130, 6338–6353 (2020). - PMC - PubMed
    1. Wang H., et al. , Biological behaviors of mutant proinsulin contribute to the phenotypic spectrum of diabetes associated with insulin gene mutations. Mol. Cell. Endocrinol. 518, 111025 (2020). - PMC - PubMed

Publication types

MeSH terms