. 2022 Nov 8;119(45):e2213162119.
doi: 10.1073/pnas.2213162119. Epub 2022 Nov 2.

Inhibition of connexin hemichannels alleviates neuroinflammation and hyperexcitability in temporal lobe epilepsy

Affiliations

Inhibition of connexin hemichannels alleviates neuroinflammation and hyperexcitability in temporal lobe epilepsy

Anni Guo et al. Proc Natl Acad Sci U S A. .

Abstract

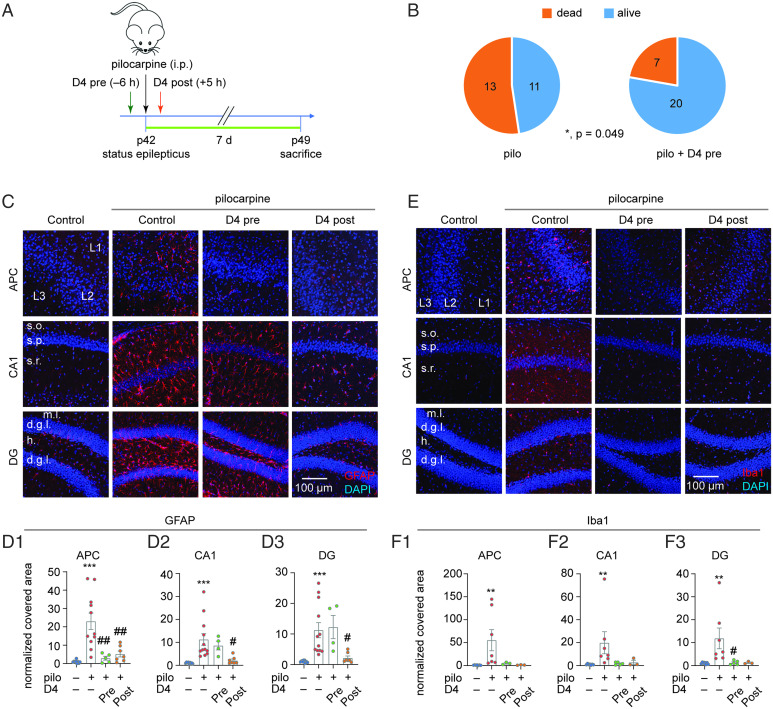
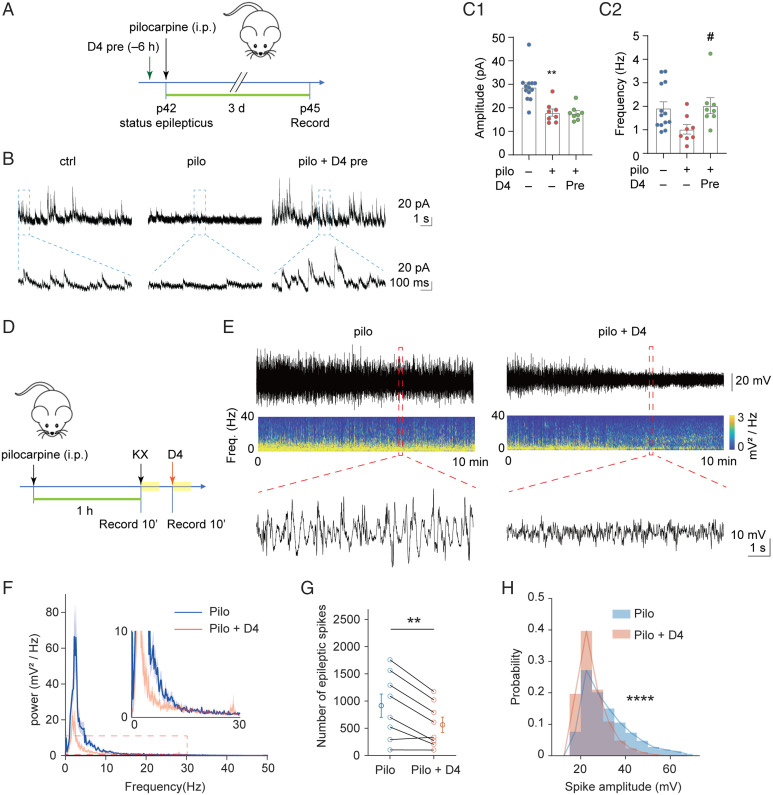
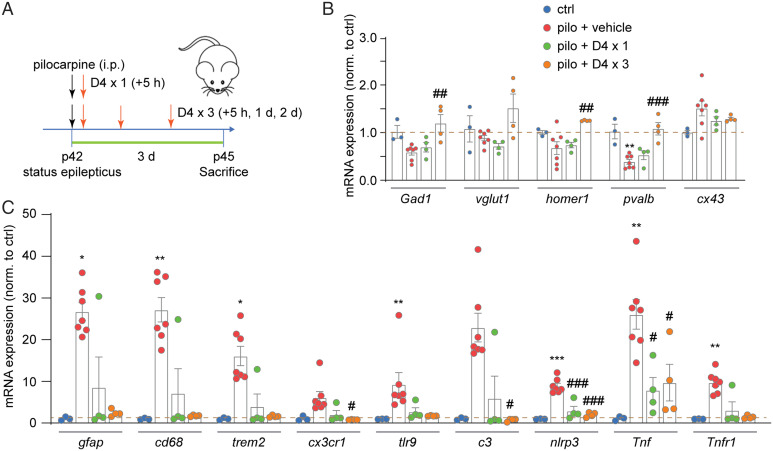
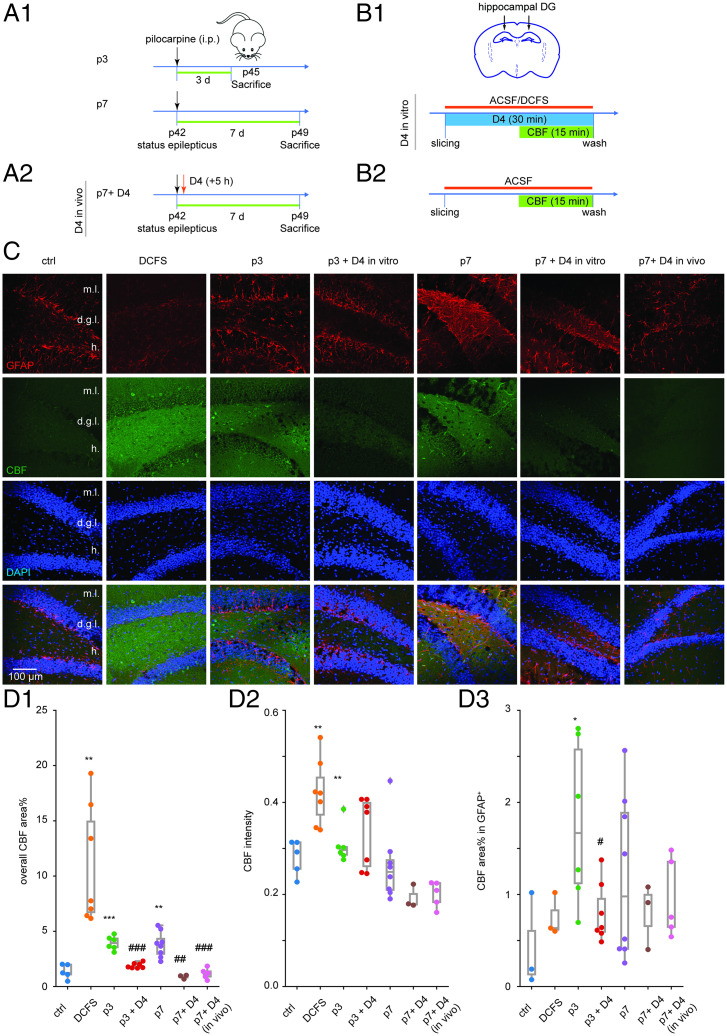
Temporal lobe epilepsy (TLE) is one of the most common types of epilepsy, yet approximately one-third of patients are refractory to current anticonvulsive drugs, which target neurons and synapses. Astrocytic and microglial dysfunction is commonly found in epileptic foci and has been shown to contribute to neuroinflammation and hyperexcitability in chronic epilepsy. Accumulating evidence points to a key role for glial hemichannels in epilepsy, but inhibiting both connexin (Cx) gap junctions and hemichannels can lead to undesirable side effects because the former coordinate physiological functions of cell assemblies. It would be a great benefit to use an orally available small molecule to block hemichannels to alleviate epileptic symptoms. Here, we explored the effect of D4, a newly developed compound that inhibits the Cx hemichannels but not Cx gap junctions using the pilocarpine mouse model of TLE. In vitro application of D4 caused a near-complete reduction in the pilocarpine-induced cell membrane permeability associated with increased Cx hemichannel activity. Moreover, preadministration of D4 in vivo effectively reduced neuroinflammation and altered synaptic inhibition, which then enhanced the animal survival rate. Posttreatment with a single dose of D4 in vivo has prolonged effects on suppressing the activation of astrocytes and microglia and rescued the changes in neuroinflammatory and synaptic gene expression induced by pilocarpine. Collectively, these results indicate that targeting Cx hemichannels by D4 is an effective and promising strategy for treating epilepsy in which neuroinflammation plays a critical role.

Keywords: antiepileptic drug; connexon; excitability; seizure.


Conflict of interest statement

The authors declare no competing interest.

Figures

Fig. 1.
Fig. 1.
D4 treatment decreases activation of astrocytes and microglia in TLE. (A) Timeline of experiment. SE was induced in P42 wild-type mice by intraperitoneal injection of pilocarpine (200 to 300 mg/kg), and D4 was applied by oral gavage 6 h (10 to 20 mg/kg) before or 5 h (5 to 10 mg/kg) after pilocarpine injection. Seven days after status epilepticus, mice were killed for immunostaining. (B) Quantification of animal survival rate in pilocarpine and pilocarpine with D4 pretreatment within 7 d after pilocarpine injection. (Left: 45.8%, n = 24; Right: 74.1%, n = 27, P = 0.049, Fisher’s exact test). (C) Representative images of GFAP expression in APC, CA1, and DG under four experimental conditions: ctrl; pilo; pilo + D4 (pre); pilo + D4 (post). (D) Quantification of GFAP relative area of GFAP expression percentage in APC (ctrl: 1.0 ± 0.26, n = 9; pilo: 23.1 ± 4.5, n = 11, P < 0.001; pilo + D4 pre: 2.9 ± 1.1, n = 5, P = 0.002; pilo + D4 post: 5.2 ± 1.6, n = 7, P = 0.002) (D1), CA1 (ctrl: 1.0 ± 0.1, n = 9; pilo: 11.2 ± 2.6, n = 12, P < 0.001; pilo + D4 pre: 8.6 ± 1.9, n = 4, P = 1.000; pilo + D4 post: 2.1 ± 0.6, n = 7, P = 0.02) (D2), and DG (ctrl: 1.0 ± 0.11, n = 9; pilo: 11.3 ± 2.5, n = 12, P < 0.001; pilo + D4 pre: 12.3 ± 3.8, n = 4, P = 1.000; pilo + D4 post: 2.2 ± 0.6, n = 7, P = 0.04) (D3). (E) Representative images of Iba1 expression in APC, CA1, and DG under four experimental conditions: ctrl; pilo; pilo + D4 pre; pilo + D4 post. (F) Quantification of Iba1 relative area of Iba1 expression percentage in APC (ctrl: 1.0 ± 0.2, n = 7; pilo: 55.4 ± 23.0, n = 7, P = 0.002; pilo + D4 pre: 4.77 ± 1.46, n = 3; pilo + D4 post: 1.3 ± 0.4, n = 3, P = 0.066) (F1), CA1 (ctrl: 1.0 ± 0.18, n = 7; pilo: 20.0 ± 9.6, n = 7, P = 0.006; pilo + D4 pre: 1.7 ± 0.5, n = 5, P = 0.08; pilo + D4 post: 2.8 ± 1.9, n = 3, P = 0.36) (F2), and DG (ctrl: 1.0 ± 0.16, n = 7; pilo: 11.9 ± 4.5, n = 7, P = 0.006; pilo + D4 pre: 1.2 ± 0.4, n = 5, P = 0.02; pilo + D4 post: 1.2 ± 0.3, n = 3, P = 0.186) (F3). ***P < 0.001, **P < 0.01: significant increase compared with ctrl; ##P < 0.01, #P < 0.05: significant decrease compared with pilo. One-way ANOVA followed by Tukey’s multiple comparisons post hoc test was used to compare GFAP normalized covered area in APC. Independent-samples Kruskal–Wallis test (significance values were adjusted by the Bonferroni correction) was used to compare GFAP normalized covered area in CA1 and DG and Iba1 normalized covered area in APC, CA1, and DG. Fisher's exact test was used for the animal survival number dataset. (All staining data are normalized to the corresponding control group.)
Fig. 2.
Fig. 2.
D4 attenuates altered synaptic inhibition and electrographic seizures. (A) Timeline of whole-cell patch-clamp recording. SE was induced in P42 wild-type mice by intraperitoneal injection of pilocarpine (200 to 300 mg/kg), D4 was administered by gavage 6 h (10 to 20 mg/kg) before pilocarpine injection. Three days after SE, mice were killed for further whole-cell patch-clamp recording. (B) Representative trace of sIPSCs in CA1 pyramidal neurons within 10 s (Above) and 1s (Below) scale. (C) Quantification of mean amplitude (ctrl: 28.8 ± 1.8 pA, n = 13; pilo: 18.0 ± 1.6 pA, n = 8, P = 0.002; pilo + D4 pre: 17.7 ± 1.1 pA, n = 8, P = 1.000) (C1) and frequency (ctrl: 1.9 ± 0.3 Hz, n = 13; pilo: 1.02 ± 0.20 Hz, n = 8, P = 0.08; pilo + D4 pre: 2.03 ± 0.34 Hz, n = 8, P = 0.035) (C2) of sIPSCs in CA1 pyramidal neurons. **P < 0.01: significant decrease compared with ctrl; #P < 0.05: significant increase compared with pilo. Independent-samples Kruskal–Wallis test (significance values were adjusted by the Bonferroni correction). (D) Scheme of experiment for D4 treatment in pilocarpine induced acute epileptic mice. First arrow denotes p42, status epilepticus. The yellow blocks represent the recording period. (E) Representative raw LFP and LFP spectrogram during pilocarpine induced SE in pilocarpine group and pilocarpine with D4 group. Below are enlarged raw LFP segments corresponding to the red dotted boxes. (F) Power spectral analysis of pilocarpine group and pilocarpine with D4 group. Thick dark lines indicate mean and shaded light-colored areas indicate SEM. (G) Effect of D4 on the number of epileptic spikes during 10-min recording. Paired t test, **P < 0.01. (H) D4 reduced the amplitude of epileptic spikes (rank-sum test, ****P < 0.0001) and altered their distribution shapes (two-sample Kolmogorov–Smirnov test, ****P < 0.0001).
Fig. 3.
Fig. 3.
Treatment with D4 after SE rescues the altered mRNA levels of neuroinflammatory and synaptic proteins in the hippocampus. (A) Timeline of experiment. SE was induced in P42 wild-type mice by intraperitoneal injection of pilocarpine (200 to 300 mg/kg), and D4 was applied by oral gavage once at 5 h (5 to 10 mg/kg) or three times at 5 h, 1 d, and 2 d (5 to 10 mg/kg) after pilocarpine injection. Three days after SE, mice were killed for tissue extraction and further quantitative real-time PCR. (B) Relative mRNA expression of Gad1, vglut1, homer1, pvalb, and cx43 in four groups: ctrl; pilo; pilo + D4 × 1 (+5h); pilo + D4 × 3 (+5 h, +1 d, +2 d) in hippocampus. Fold change is normalized to control group. (C) Relative mRNA expression of gfap, cd68, trem2, cx3cr1, tlr9, c3, nlrp3, Tnf, and Tnfr1 in four groups: ctrl; pilo; pilo + D4 × 1 (+5 h); pilo + D4 × 3 (+5 h, +1 d, +2 d) in hippocampus. Fold change is normalized to control group. ***P < 0.001, **P < 0.01, *P < 0.05: significant increase/decrease compared with ctrl; ###P < 0.001, ##P < 0.01, #P < 0.05: significant increase/decrease compared with pilo. One-way ANOVA followed by Tukey’s multiple comparisons post hoc test was used to compare expression of Gad1, vglut1, homer1, pvalb, cx43, nlrp3, and Tnf among four groups; independent-samples Kruskal–Wallis test (significance values were adjusted by the Bonferroni correction) was used to compare expression of gfap, cd68, trem2, cx3cr1, tlr9, c3, and Tnfr1 among four groups. pilo + D4 × 1 (+5 h): (Gad1: 0.69 ± 0.10, n = 4, P = 0.886; vglut1: 0.71 ± 0.06, n = 4, P = 0.853; homer1: 0.74 ± 0.06, n = 4, P = 0.974; pvalb: 0.53 ± 0.09, n = 4, P = 0.691; Tnf: 8.0 ± 3.0, n = 4, P = 0.012; nlrp3: 3.0 ± 1.1, n = 4, P < 0.001). pilo + D4 × 3 (+5 h, +1 d, +2 d): (Gad1: 1.20 ± 0.18, n = 4, P = 0.005; homer1: 1.25 ± 0.01, n = 4, P = 0.009; pvalb: 1.08 ± 0.13, n = 4, P < 0.001; gfap: 2.4 ± 0.4, n = 4, P = 0.428; cd68: 1.8 ± 0.1, n = 4, P = 0.389; trem2: 1.6 ± 0.1, n = 4, P = 0.459; cx3cr1: 0.83 ± 0.03, n = 4, P = 0.011; tlr9: 1.72 ± 0.05, n = 4, P = 0.104; c3: 0.75 ± 0.10, n = 4, P = 0.042; nlrp3: 2.0 ± 0.3, n = 4, P < 0.001; Tnf: 9.7 ± 4.4, n = 4, P = 0.023; Tnfr1: 1.4 ± 0.2, n = 4, P = 0.297).
Fig. 4.
Fig. 4.
D4 in vitro or in vivo inhibits pilocarpine-induced astrocytic HC activity in hippocampal slices. (A) Timeline of experiment. SE was induced in P42 wild-type mice by intraperitoneal injection of pilocarpine (200 to 300 mg/kg) For D4 in vitro experiment, 3 or 7 d after SE, mice were killed for acute slicing and further dye uptake experiment (A1). For D4 in vivo experiment, D4 was applied by oral gavage once at 5 h (10 mg/kg) after pilocarpine injection (A2). (B) Timeline of dye uptake experiment. Acute brain slices were obtained from mice 3 or 7 d after pilocarpine injection. Acute slices were incubated in a chamber oxygenated by bubbling gas mixture (95% O2 and 5% CO2) into ACSF solution (or DCFS in the positive control group). D4 (10 µM) was applied in ACSF all the time for 30 min. CBF was added 15 min after D4. Fifteen minutes after CBF application, slices were washed in ACSF to stop dye uptake (B1). For slices subjected to D4 in vivo previously, they were incubated in ACSF without D4 in vitro (B2). (C) Representative images showing GFAP (red) and CBF (green) uptake of acute hippocampal slices from control mice (ctrl: slices incubated in ACSF; DCFS: slices incubated in DCFS) and pilocarpine-injected mice (p3: 3 d after SE; p3 + D4: 3 d SE, slices treated with D4; p7: 7 d after SE; p7 + D4: 7 d SE, slices treated with D4; p7 + D4 in vivo: 7 d after SE, D4 applied in vivo after pilocarpine injection). Images were taken from the DG zone. (D) Quantification of overall CBF area percentage (ctrl: 1.4 ± 0.3, n = 5; DCFS: 10.9 ± 2.0, n = 7, P = 0.003; p3: 3.9 ± 0.3, n = 6, P < 0.001; p3 + D4: 1.9 ± 0.1, n = 7, P < 0.001; p7: 3.8 ± 0.4, n = 8, P = 0.001; p7 + D4: 0.9 ± 0.1, n = 3, P = 0.001; p7 + D4 in vivo: 1.2 ± 0.2, n = 5, P < 0.001) (D1), CBF mean intensity (ctrl: 0.28 ± 0.02, n = 5; DCFS: 0.42 ± 0.03, n = 7, P = 0.003; p3: 0.31 ± 0.02, n = 6, P = 0.002) (D2), and CBF area percentage in GFAP+ area (ctrl: 0.4 ± 0.3, n = 3; p3: 1.8 ± 0.4, n = 6, P = 0.025; p3 + D4: 0.8 ± 0.1, n = 7, P = 0.039) (D3). ***P < 0.001, **P < 0.01, *P < 0.05: significant increase compared with ctrl; ###P < 0.001, ##P < 0.01, #P < 0.05: significant decrease compared with corresponding pilocarpine group (p3 + D4 compared with p3; p7 + D4 compared with p7). Independent-samples Kruskal–Wallis test (significance values were adjusted by the Bonferroni correction) was used to compare CBF mean intensity among three groups (ctrl, p3 and p3 + D4; ctrl, p7 and p7 + D4; ctrl, p7 and p7 + D4 in vivo). One-way ANOVA followed by Tukey’s multiple comparisons post hoc test was used to compare overall CBF area percentage and CBF area percentage in the GFAP+ area for the rest dataset among three groups (ctrl, p3 and p3 + D4; ctrl, p7 and p7 + D4; ctrl, p7 and p7 + D4 in vivo). Two-sided t test was used to compare overall CBF area percentage, CBF mean intensity, and CBF area percentage in the GFAP+ area between the ctrl and DCFS group.
Fig. 5.
Fig. 5.
Molecular modeling of mCx43 and mCx39 channels and their interactions with D4. D4 interactions with mCx43 HC (A), mCx43 gap junction (B), mCx39 within membrane plane binding site 1 (C), and extracellular binding site 2 (D). D4 is depicted with carbon atoms in cyan or yellow. The main Cx protomer with carbon atoms and ribbons is shown in green, while the adjacent protomers with carbons atoms and ribbons are depicted in white color. Hydrogen-bond interactions are depicted as red dashed lines. Superimposition of mCx43 HC with best docking results for D4 and mCx43 gap junction overlapping residues Trp4, Leu-7, and Leu11 (E). D4 is shown with carbon atoms in yellow, and residues in NTH of mCx43 in gap junction conformation are shown with carbon atoms in cyan.

Comment in

References

    1. García-Rodríguez C., Bravo-Tobar I. D., Duarte Y., Barrio L. C., Sáez J. C., Contribution of non-selective membrane channels and receptors in epilepsy. Pharmacol. Ther. 231, 107980 (2022). - PubMed
    1. Halassa M. M., Fellin T., Takano H., Dong J. H., Haydon P. G., Synaptic islands defined by the territory of a single astrocyte. J. Neurosci. 27, 6473–6477 (2007). - PMC - PubMed
    1. Seifert G., Steinhäuser C., Neuron-astrocyte signaling and epilepsy. Exp. Neurol. 244, 4–10 (2013). - PubMed
    1. Sofroniew M. V., Vinters H. V., Astrocytes: Biology and pathology. Acta Neuropathol. 119, 7–35 (2010). - PMC - PubMed
    1. Bordey A., Lyons S. A., Hablitz J. J., Sontheimer H., Electrophysiological characteristics of reactive astrocytes in experimental cortical dysplasia. J. Neurophysiol. 85, 1719–1731 (2001). - PubMed

Publication types