. 2023 Feb 16;141(7):766-786.
doi: 10.1182/blood.2022017046.

C1Q labels a highly aggressive macrophage-like leukemia population indicating extramedullary infiltration and relapse

Affiliations

C1Q labels a highly aggressive macrophage-like leukemia population indicating extramedullary infiltration and relapse

Li-Xue Yang et al. Blood. .

Abstract

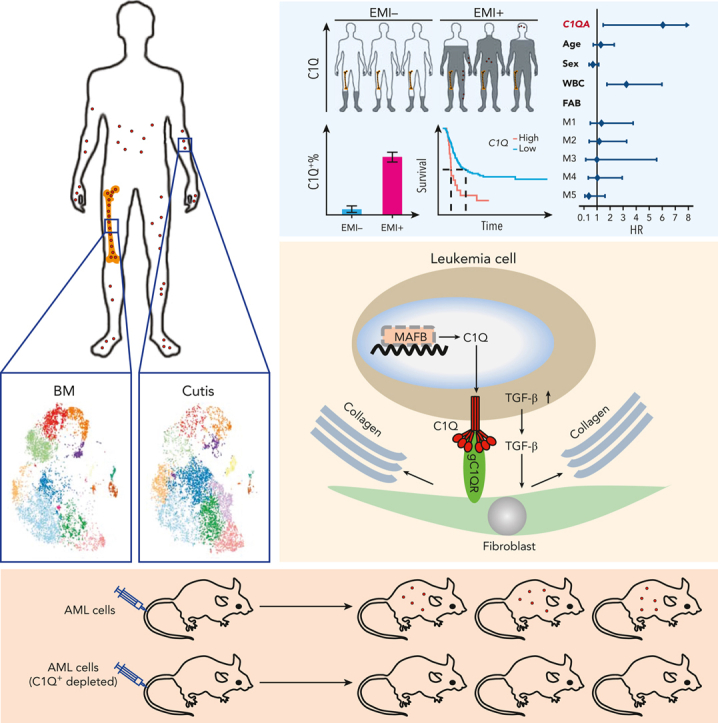
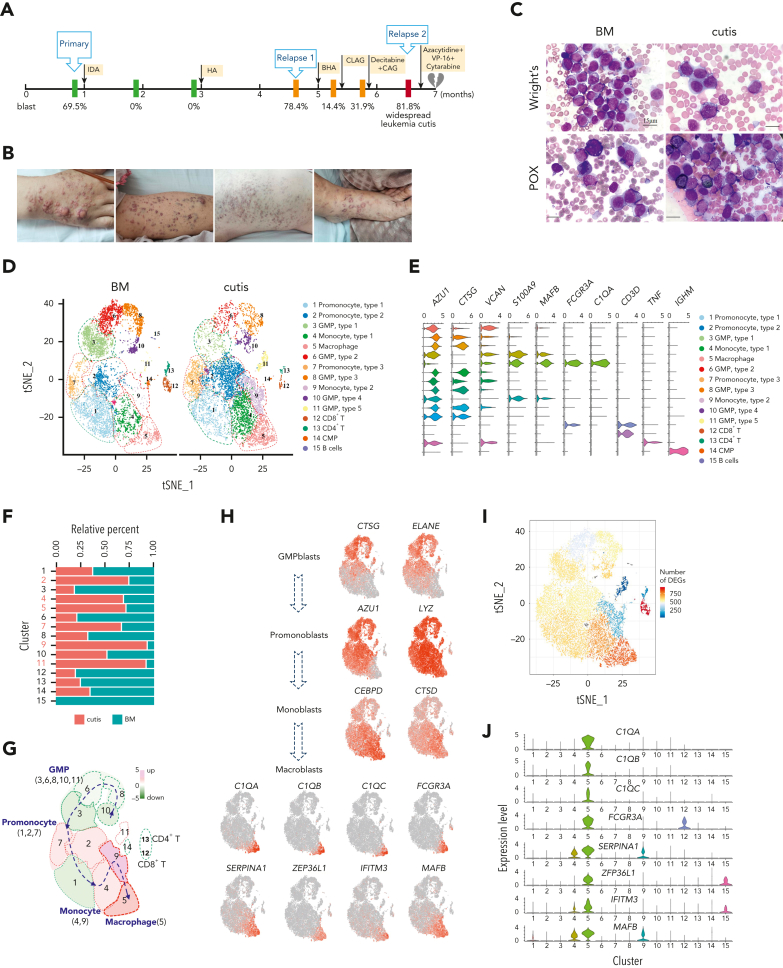
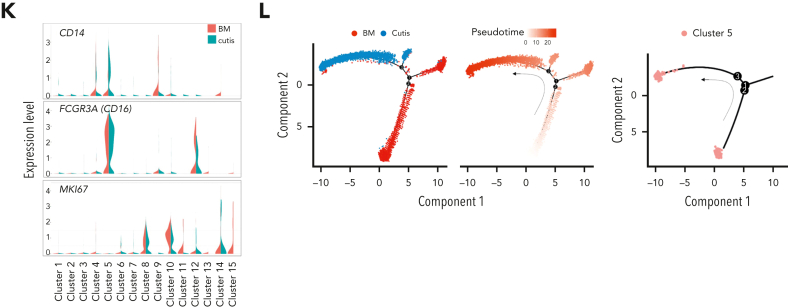
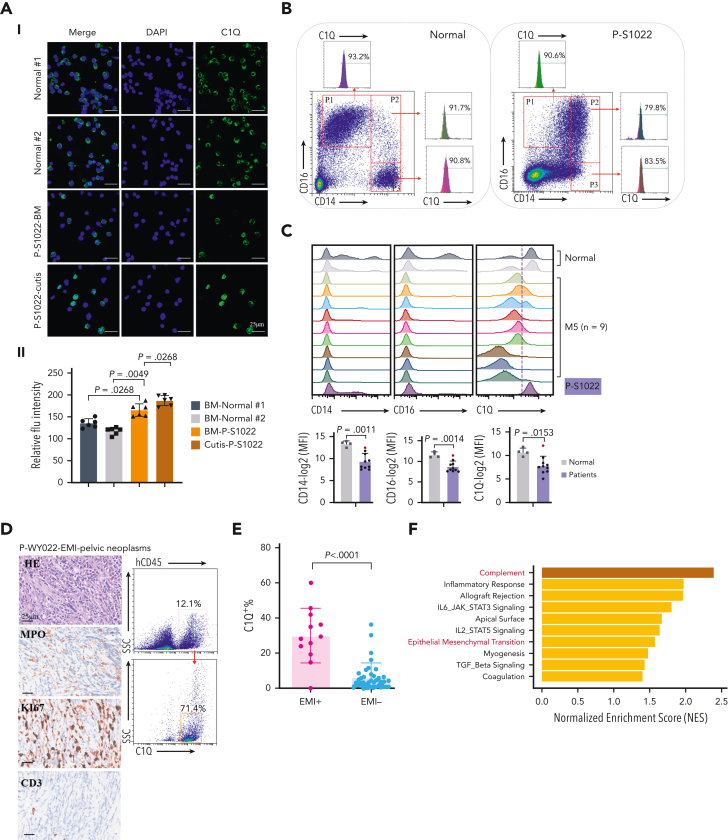
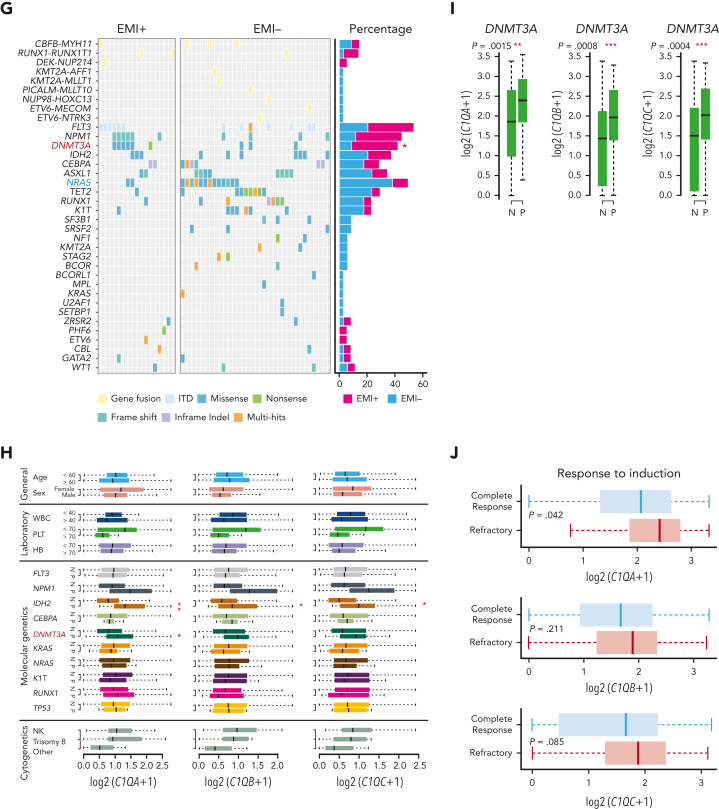
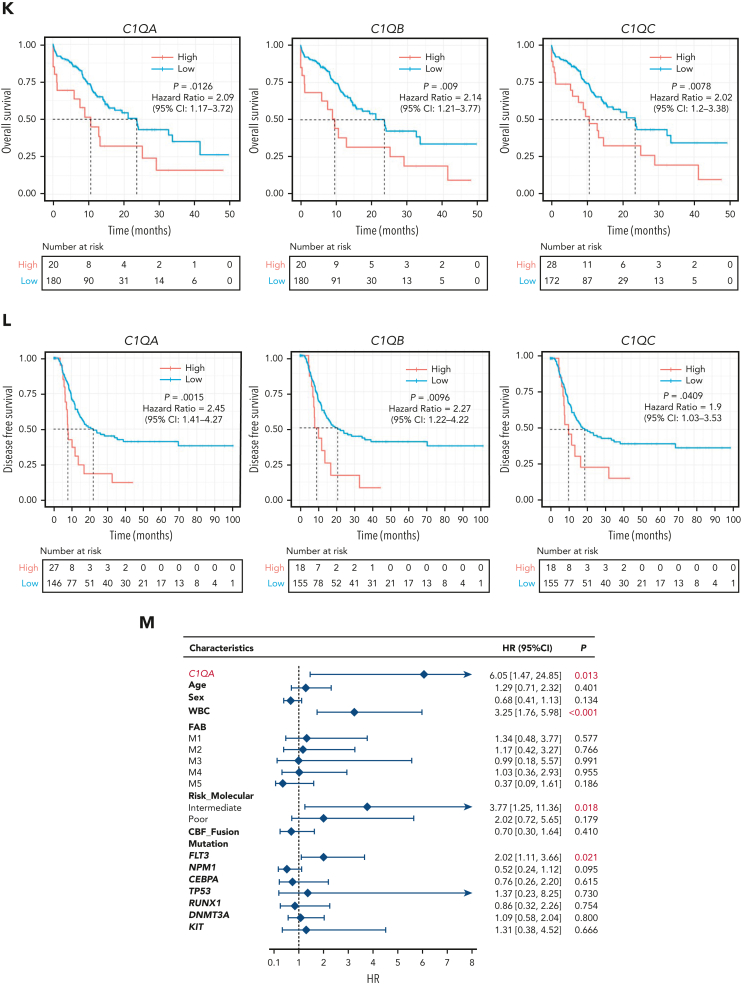
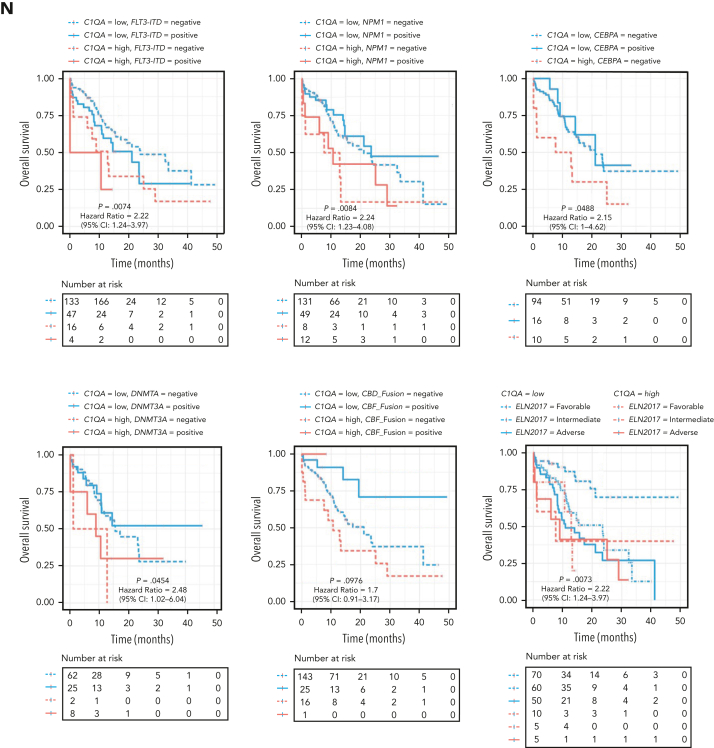
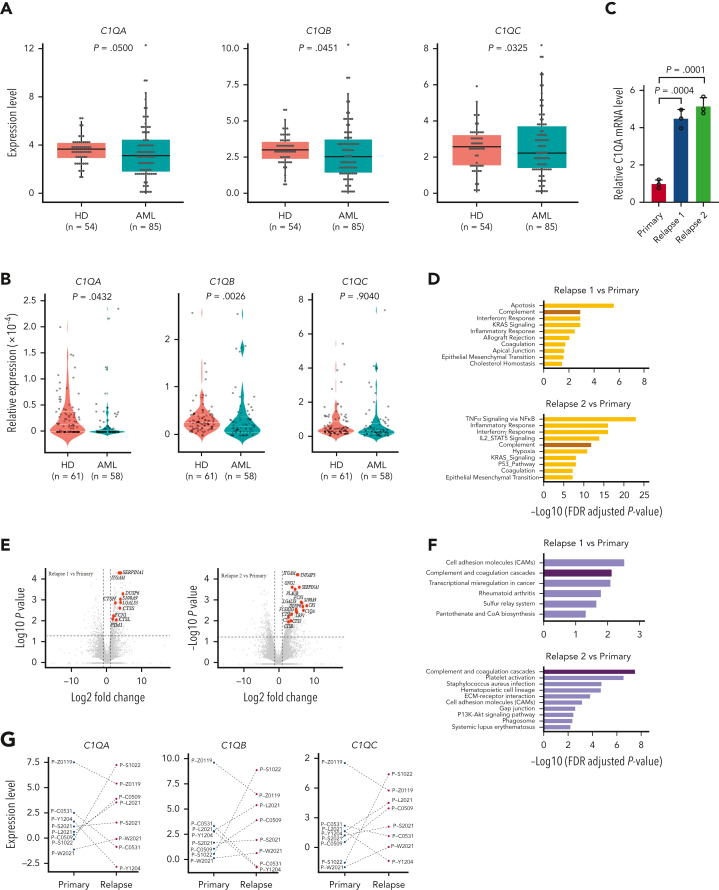
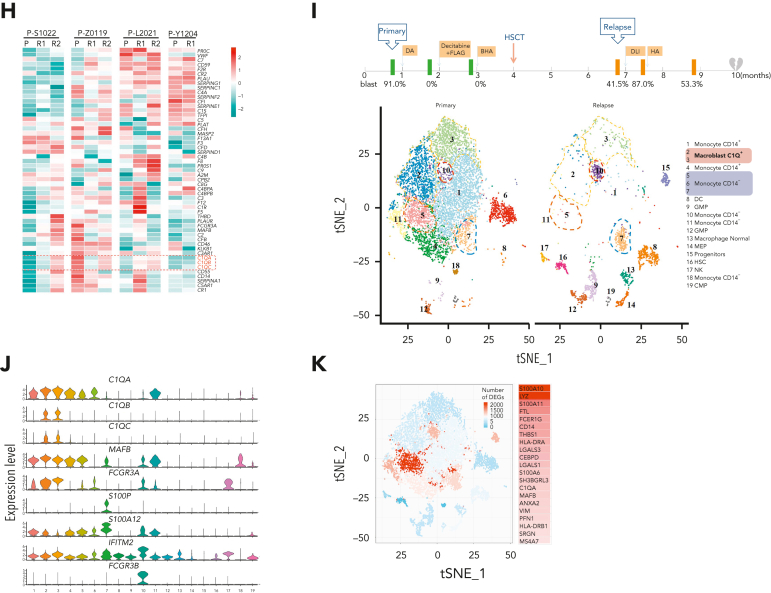
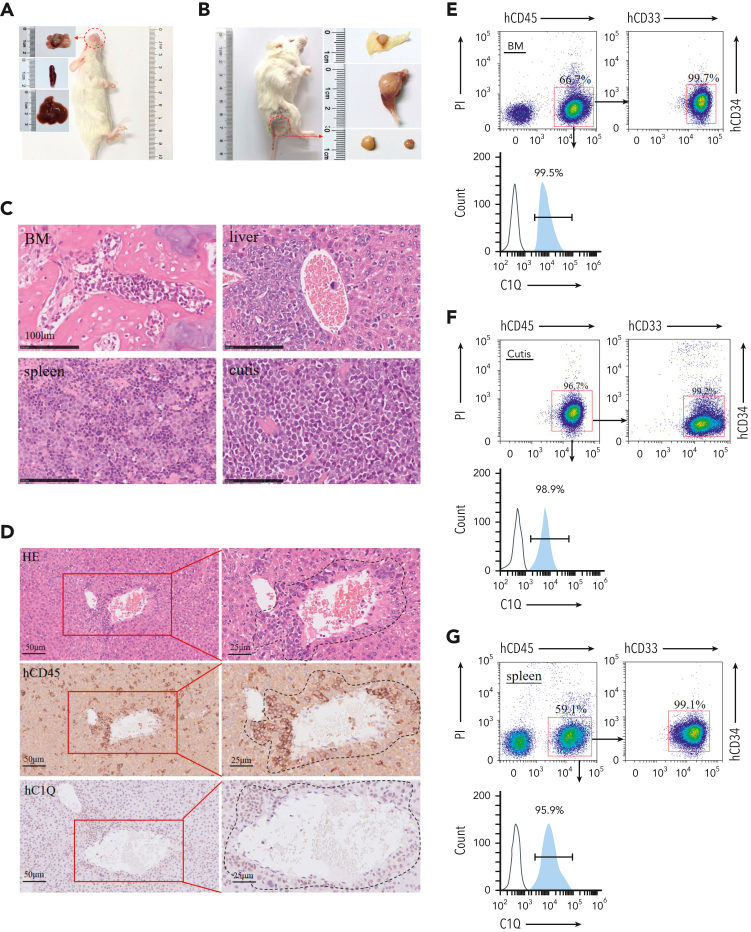
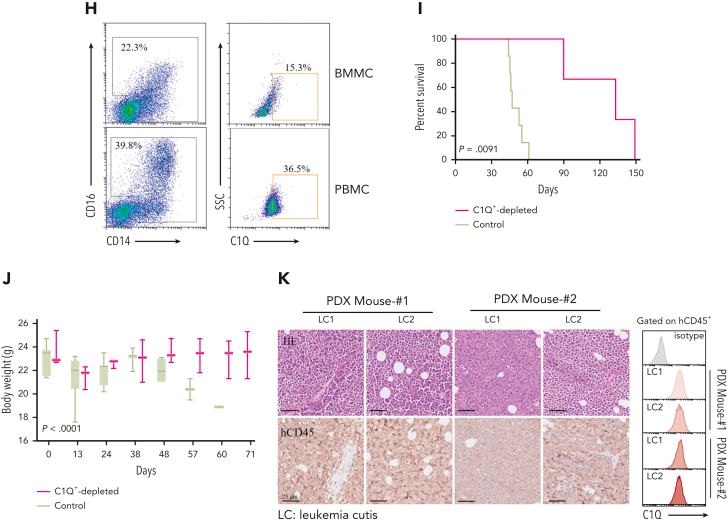
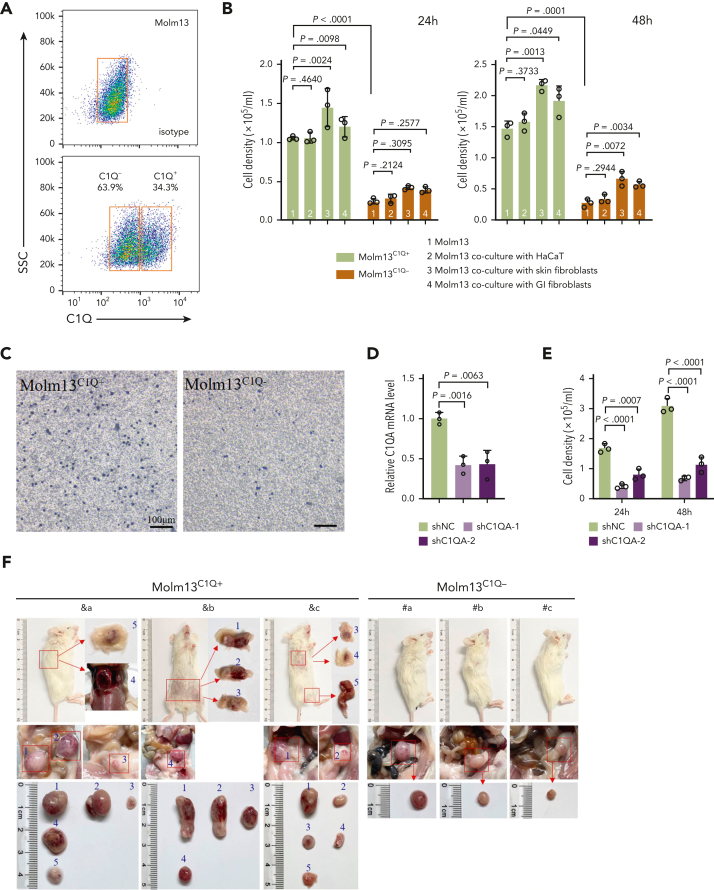
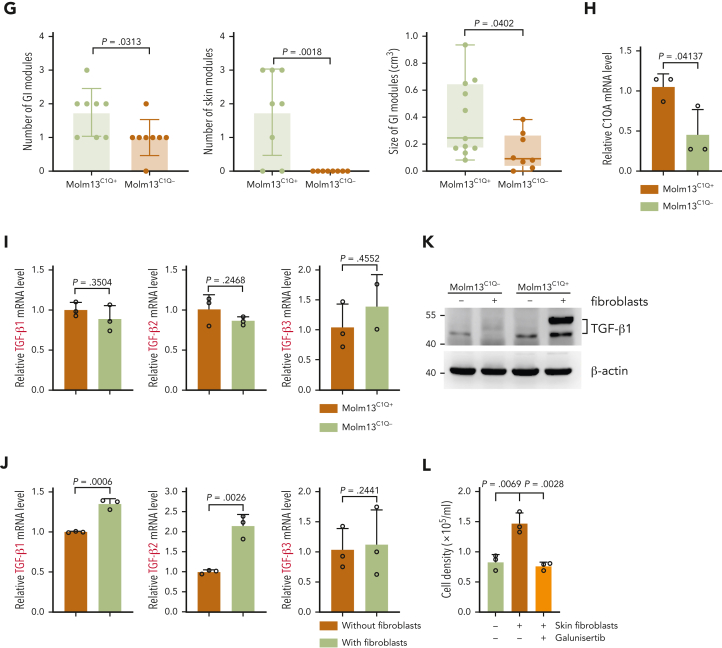
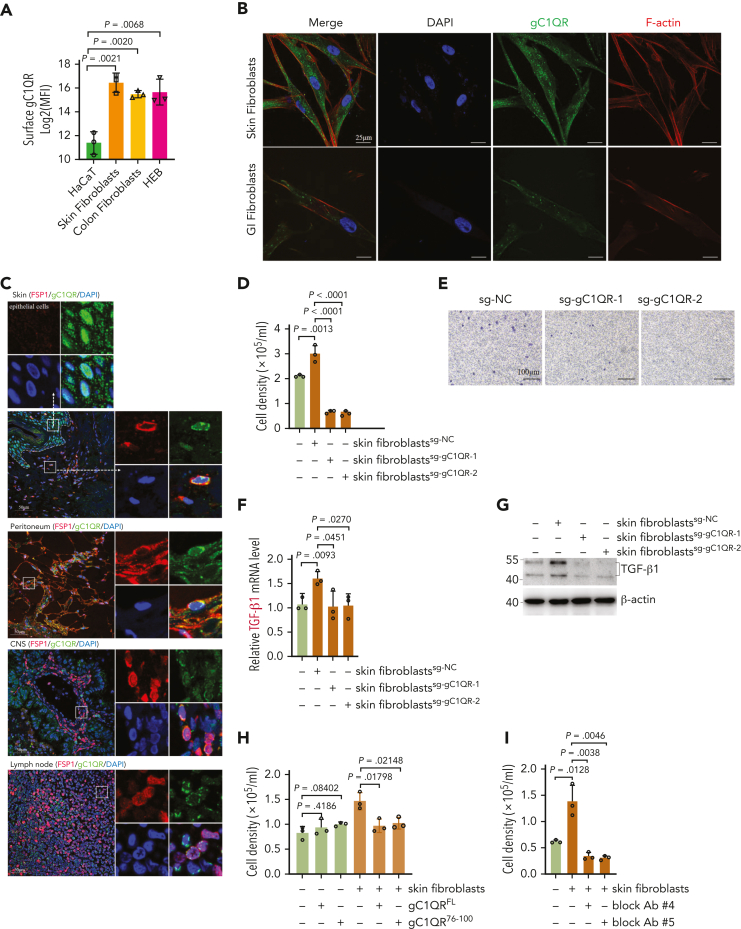
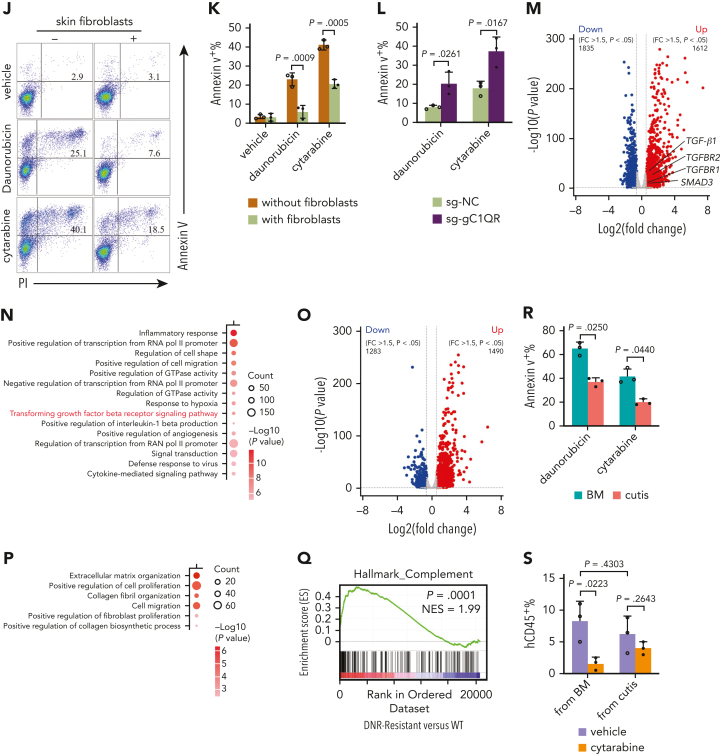
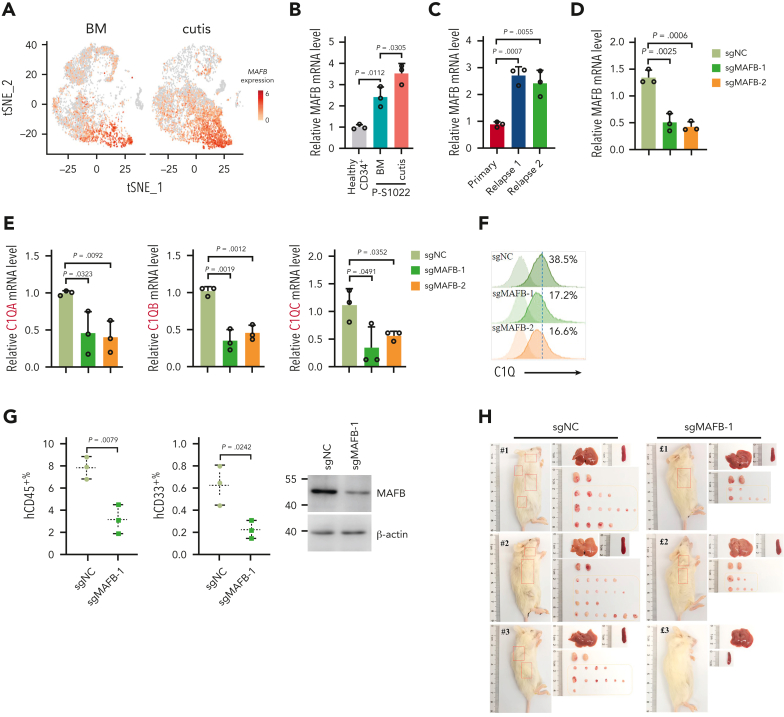
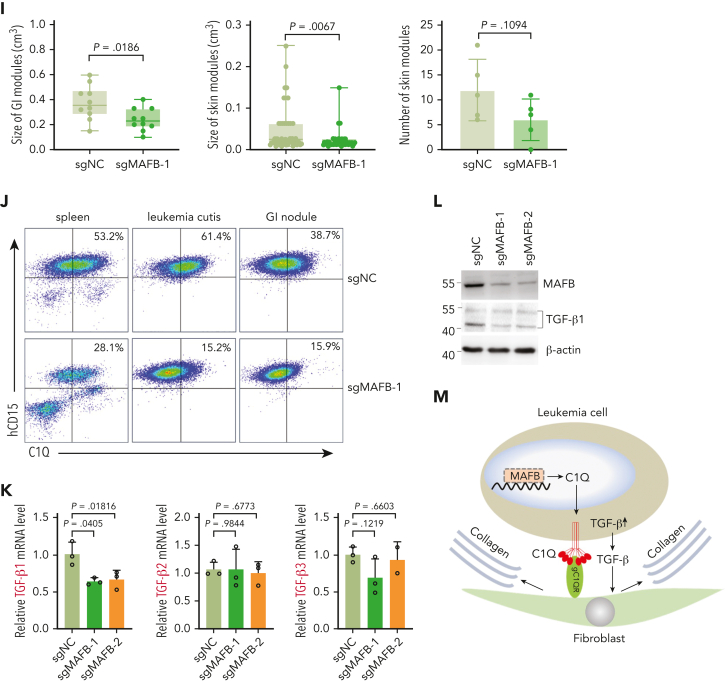
Extramedullary infiltration (EMI) is a concomitant manifestation that may indicate poor outcome of acute myeloid leukemia (AML). The underlying mechanism remains poorly understood and therapeutic options are limited. Here, we employed single-cell RNA sequencing on bone marrow (BM) and EMI samples from a patient with AML presenting pervasive leukemia cutis. A complement C1Q+ macrophage-like leukemia subset, which was enriched within cutis and existed in BM before EMI manifestations, was identified and further verified in multiple patients with AML. Genomic and transcriptional profiling disclosed mutation and gene expression signatures of patients with EMI that expressed high levels of C1Q. RNA sequencing and quantitative proteomic analysis revealed expression dynamics of C1Q from primary to relapse. Univariate and multivariate analysis demonstrated adverse prognosis significance of C1Q expression. Mechanistically, C1Q expression, which was modulated by transcription factor MAF BZIP transcription factor B, endowed leukemia cells with tissue infiltration ability, which could establish prominent cutaneous or gastrointestinal EMI nodules in patient-derived xenograft and cell line-derived xenograft models. Fibroblasts attracted migration of the C1Q+ leukemia cells through C1Q-globular C1Q receptor recognition and subsequent stimulation of transforming growth factor β1. This cell-to-cell communication also contributed to survival of C1Q+ leukemia cells under chemotherapy stress. Thus, C1Q served as a marker for AML with adverse prognosis, orchestrating cancer infiltration pathways through communicating with fibroblasts and represents a compelling therapeutic target for EMI.


Conflict of interest statement

Conflict-of-interest disclosure: The authors declare no competing financial interests.

Figures

None
Graphical abstract
Figure 1.
Figure 1.
scRNA-seq identified unique C1Q+ macrophage-like leukemia cells in a patient with AML (P-S1022). (A) Disease course of P-S1022 from primary to deceased. (B) Clinical presentations of leukemia cutis. (C) Wright staining and peroxidase staining of BM biopsy collected at relapse 1 and cutis sample of P-S1022. (D) Unsupervised t-distributed stochastic neighbor embedding (t-SNE) plot displaying 18 213 cells from BM and cutis samples of P-S1022. Number- and color-labeled 15 different clusters. Clusters belonging to the same category of cells were distinguished by type 1, 2, or 3. (E) Expression levels (x-axis) of cluster-defining genes in each cluster. Violin plots show the distribution of normalized expression levels of genes and are color coded according to cluster, as in panel D. (F) Frequencies of defined clusters, color coded based on origin (BM vs cutis). Red bar indicates cutis-derived cells; green bar, BM-derived cells. (G) Differentiation trajectory of 15 identified clusters. Arrow begins from the primitive clusters to mature clusters. Red indicates increase and green indicates decrease of frequencies of defined clusters (cutis vs BM). (H) t-SNE projections of selected marker genes of indicated clusters are shown (left). (I) Projection of differentially expressed genes (DEGs) between BM and cutis sample on t-SNE plot. DEGs: |log fold change| >0.5; adjusted P < .05 was derived by a Wilcoxon rank-sum test. (J) Expression levels (y-axis) of featured genes in 15 clusters. Violin plots show the distribution of normalized expression levels of indicated genes. (K) Expression levels of monocyte- (CD14 and FCGR3A/CD16) and proliferation-associated (MKI67) genes are illustrated by violin plots. (L) Trajectory of leukemia cells of BM and cutis samples using the monocle 2 algorithm and pseudotime projections for the distinct transcriptional states, with each point representing a single cell. Three states (1, 2, and 3) are identified. Solid arrows represent cell trajectories defined by single-cell transcriptomes. BHA, bortezomib + homoharringtonine + cytarabine; CAG, cytarabine + granulocyte colony-stimulating factor (G-CSF); CLAG, cladribine + cytarabine + G-CSF; CMP, common myeloid progenitor; GMP, granulocyte-monocyte progenitors; HA, homoharringtonine + cytarabine; IDA, idarubicin + cytarabine.
Figure 1.
Figure 1.
scRNA-seq identified unique C1Q+ macrophage-like leukemia cells in a patient with AML (P-S1022). (A) Disease course of P-S1022 from primary to deceased. (B) Clinical presentations of leukemia cutis. (C) Wright staining and peroxidase staining of BM biopsy collected at relapse 1 and cutis sample of P-S1022. (D) Unsupervised t-distributed stochastic neighbor embedding (t-SNE) plot displaying 18 213 cells from BM and cutis samples of P-S1022. Number- and color-labeled 15 different clusters. Clusters belonging to the same category of cells were distinguished by type 1, 2, or 3. (E) Expression levels (x-axis) of cluster-defining genes in each cluster. Violin plots show the distribution of normalized expression levels of genes and are color coded according to cluster, as in panel D. (F) Frequencies of defined clusters, color coded based on origin (BM vs cutis). Red bar indicates cutis-derived cells; green bar, BM-derived cells. (G) Differentiation trajectory of 15 identified clusters. Arrow begins from the primitive clusters to mature clusters. Red indicates increase and green indicates decrease of frequencies of defined clusters (cutis vs BM). (H) t-SNE projections of selected marker genes of indicated clusters are shown (left). (I) Projection of differentially expressed genes (DEGs) between BM and cutis sample on t-SNE plot. DEGs: |log fold change| >0.5; adjusted P < .05 was derived by a Wilcoxon rank-sum test. (J) Expression levels (y-axis) of featured genes in 15 clusters. Violin plots show the distribution of normalized expression levels of indicated genes. (K) Expression levels of monocyte- (CD14 and FCGR3A/CD16) and proliferation-associated (MKI67) genes are illustrated by violin plots. (L) Trajectory of leukemia cells of BM and cutis samples using the monocle 2 algorithm and pseudotime projections for the distinct transcriptional states, with each point representing a single cell. Three states (1, 2, and 3) are identified. Solid arrows represent cell trajectories defined by single-cell transcriptomes. BHA, bortezomib + homoharringtonine + cytarabine; CAG, cytarabine + granulocyte colony-stimulating factor (G-CSF); CLAG, cladribine + cytarabine + G-CSF; CMP, common myeloid progenitor; GMP, granulocyte-monocyte progenitors; HA, homoharringtonine + cytarabine; IDA, idarubicin + cytarabine.
Figure 2.
Figure 2.
C1Q+ macroblasts exist in patients with AML and predict poor outcomes. (A) Immunofluorescent staining of C1Q in BM from healthy donors (normal #1 and normal #2) and BM and cutis samples from P-S1022 are shown in panel Ai. Quantified fluorescence intensities were shown in panel Aii (bottom). (B) Flow cytometry analysis of CD14, CD16, and C1Q on BM samples of healthy donor (normal) and P-S1022. P1 gate, nonclassical monocyte subset (CD14lowCD16high); P2 gate, intermediate monocyte subset (CD14highCD16high); and P3 gate, classical monocyte subset (CD14highCD16low). (C) Expression of CD14, CD16, and C1Q evaluated by flow cytometry in BM from healthy donors, P-S1022, and other patients with AML-M5 (n = 9). Mean fluorescence intensity was quantified by flow cytometry and is shown (bottom). The red dot indicates P-S1022. (D) The leukemic invasions in pelvic tissue from P-WY022 were analyzed by hematoxylin and eosin (H&E) staining and immunohistochemistry (IHC) staining of MPO, KI67, and CD3. Flow cytometry analysis of human CD45 (hCD45) and C1Q expression on cells is shown (right). (E) Expression of C1Q was evaluated by flow cytometry in BM from patients with AML with (EMI+) or without (EMI) EMI. (F) Top 10 HALLMARK gene sets from the gene set enrichment analysis between patients with AML with or without EMI. (G) Landscape and percentage for the mutations and fusions in patients with AML with or without EMI. ∗P = .0314. (H) Differential expression of C1QA, C1QB, and C1QC by general (age and sex), laboratory (white blood cell counts, platelets, and hemoglobin), cytogenetic, and molecular genetics characteristics in patients with AML from our inhouse RNA-seq data set (n = 110). P values are shown from 2-sample 1-tailed t test. ∗P < .05, ∗∗P < .01. (I) Differential expression of C1QA, C1QB, and C1QC by the DNMT3A mutation in patients with AML from the BeatAML data set. P values are shown from 2-sample 1-tailed t test. ∗∗P < .01, ∗∗∗P < .001. (J) Differential expression of C1QA, C1QB, and C1QC for the induction response in patients with AML from the BeatAML data set. P values are shown from 2-sample 1-tailed t test. (K) Differences in OS in patients with de novo AML from the BeatAML data set (n = 200) by expression of C1QA, C1QB, and C1QC. P values, hazard ratios (HRs), and 95% confidence interval (CI) are shown from univariate Cox analysis. (L) Differences in DFS in patients with de novo AML from the TCGA data set (n = 173) by expression of C1QA, C1QB, and C1QC. P values, HRs, and 95% CI are shown from univariate Cox analysis. (M) Multivariate Cox analysis of DFS in patients with de novo AML from the TCGA data set (n = 173) according to C1QA expression, age, sex, white blood cell counts, French-American-British classification, risk molecular, CBF fusion, and genetic characteristics. Patient number and percentage, regression coefficient (β), HR, and P values are shown for each parameter. (N) Differences in OS in patients with de novo AML from the BeatAML data set (n = 200) by combination of C1QA expression with presence of FLT3-ITD, NPM1, CEBPA, DNMT3A, and CBF fusion, or 2017 European LeukemiaNet risk stratification. P values, HRs, and 95% CI are shown for C1QA high expression from the multivariate Cox analysis. CBF fusion: RUNX1-RUNX1T1 fusion or CBFB-MYH11 fusion.
Figure 2.
Figure 2.
C1Q+ macroblasts exist in patients with AML and predict poor outcomes. (A) Immunofluorescent staining of C1Q in BM from healthy donors (normal #1 and normal #2) and BM and cutis samples from P-S1022 are shown in panel Ai. Quantified fluorescence intensities were shown in panel Aii (bottom). (B) Flow cytometry analysis of CD14, CD16, and C1Q on BM samples of healthy donor (normal) and P-S1022. P1 gate, nonclassical monocyte subset (CD14lowCD16high); P2 gate, intermediate monocyte subset (CD14highCD16high); and P3 gate, classical monocyte subset (CD14highCD16low). (C) Expression of CD14, CD16, and C1Q evaluated by flow cytometry in BM from healthy donors, P-S1022, and other patients with AML-M5 (n = 9). Mean fluorescence intensity was quantified by flow cytometry and is shown (bottom). The red dot indicates P-S1022. (D) The leukemic invasions in pelvic tissue from P-WY022 were analyzed by hematoxylin and eosin (H&E) staining and immunohistochemistry (IHC) staining of MPO, KI67, and CD3. Flow cytometry analysis of human CD45 (hCD45) and C1Q expression on cells is shown (right). (E) Expression of C1Q was evaluated by flow cytometry in BM from patients with AML with (EMI+) or without (EMI) EMI. (F) Top 10 HALLMARK gene sets from the gene set enrichment analysis between patients with AML with or without EMI. (G) Landscape and percentage for the mutations and fusions in patients with AML with or without EMI. ∗P = .0314. (H) Differential expression of C1QA, C1QB, and C1QC by general (age and sex), laboratory (white blood cell counts, platelets, and hemoglobin), cytogenetic, and molecular genetics characteristics in patients with AML from our inhouse RNA-seq data set (n = 110). P values are shown from 2-sample 1-tailed t test. ∗P < .05, ∗∗P < .01. (I) Differential expression of C1QA, C1QB, and C1QC by the DNMT3A mutation in patients with AML from the BeatAML data set. P values are shown from 2-sample 1-tailed t test. ∗∗P < .01, ∗∗∗P < .001. (J) Differential expression of C1QA, C1QB, and C1QC for the induction response in patients with AML from the BeatAML data set. P values are shown from 2-sample 1-tailed t test. (K) Differences in OS in patients with de novo AML from the BeatAML data set (n = 200) by expression of C1QA, C1QB, and C1QC. P values, hazard ratios (HRs), and 95% confidence interval (CI) are shown from univariate Cox analysis. (L) Differences in DFS in patients with de novo AML from the TCGA data set (n = 173) by expression of C1QA, C1QB, and C1QC. P values, HRs, and 95% CI are shown from univariate Cox analysis. (M) Multivariate Cox analysis of DFS in patients with de novo AML from the TCGA data set (n = 173) according to C1QA expression, age, sex, white blood cell counts, French-American-British classification, risk molecular, CBF fusion, and genetic characteristics. Patient number and percentage, regression coefficient (β), HR, and P values are shown for each parameter. (N) Differences in OS in patients with de novo AML from the BeatAML data set (n = 200) by combination of C1QA expression with presence of FLT3-ITD, NPM1, CEBPA, DNMT3A, and CBF fusion, or 2017 European LeukemiaNet risk stratification. P values, HRs, and 95% CI are shown for C1QA high expression from the multivariate Cox analysis. CBF fusion: RUNX1-RUNX1T1 fusion or CBFB-MYH11 fusion.
Figure 3.
Figure 3.
C1Q level is modulated during disease courses and is associated with early recurrence after HSCT. (A) RNA-seq analysis of BM mononuclear cell samples collected from patients with de novo AML (AML, n = 85) and healthy donors (HDs, n = 54). The messenger RNA (mRNA) expression level of C1QA, C1QB, and C1QC are shown. (B) Quantitative proteomic analysis of BM mononuclear cell samples collected from patients with de novo AML (AML, n = 58) and healthy donors (HDs, n = 61). The protein level of C1QA, C1QB, and C1QC are shown. (C) C1QA mRNA level measured by quantitative polymerase chain reaction (qPCR) in leukemia blasts of P-S1022 at the time point of primary, relapse 1, and relapse 2. P value was calculated by 2-sample t test. (D) RNA-seq analysis and pathway enrichment of indicated samples of P-S1022. (E) Volcano plot of DEGs that are upregulated (red) in relapse 1 vs primary (top) or relapse 2 vs primary (bottom). Relevant DEGs identified in the pathways are labeled. P value was derived by Wilcoxon rank-sum test. (F) Quantitative proteomic analysis and pathway enrichment of samples in panel D. (G) C1QA, C1QB, and C1QC mRNA expression levels on longitudinally collected samples of patients with AML (n = 8) measured by RNA-seq. (H) Relative expression heat map of complement genes on longitudinally collected samples of indicated patients with AML. (I) Timeline of disease course of P-Z0119 from primary to deceased (top). Unsupervised t-SNE plot displaying 13 097 cells of primary and relapse post-HSCT from P-Z0119 colored by shared nearest neighbor clusters. (J) Violin plots show the distribution of normalized expression levels of genes and are color coded according to clusters in panel I. (K) Projection of DEGs between primary and relapse samples from P-Z0119. The heat map shows the DEGs within cluster 5. DEG: |log fold change| >0.5; adjusted P < .05 was derived by a Wilcoxon rank-sum test. DA, daunorubicin + cytarabine; DLI, donor lymphocyte infusion; FLAG, fludarabine + cytarabine + G-CSF; P, primary; R, relapse.
Figure 3.
Figure 3.
C1Q level is modulated during disease courses and is associated with early recurrence after HSCT. (A) RNA-seq analysis of BM mononuclear cell samples collected from patients with de novo AML (AML, n = 85) and healthy donors (HDs, n = 54). The messenger RNA (mRNA) expression level of C1QA, C1QB, and C1QC are shown. (B) Quantitative proteomic analysis of BM mononuclear cell samples collected from patients with de novo AML (AML, n = 58) and healthy donors (HDs, n = 61). The protein level of C1QA, C1QB, and C1QC are shown. (C) C1QA mRNA level measured by quantitative polymerase chain reaction (qPCR) in leukemia blasts of P-S1022 at the time point of primary, relapse 1, and relapse 2. P value was calculated by 2-sample t test. (D) RNA-seq analysis and pathway enrichment of indicated samples of P-S1022. (E) Volcano plot of DEGs that are upregulated (red) in relapse 1 vs primary (top) or relapse 2 vs primary (bottom). Relevant DEGs identified in the pathways are labeled. P value was derived by Wilcoxon rank-sum test. (F) Quantitative proteomic analysis and pathway enrichment of samples in panel D. (G) C1QA, C1QB, and C1QC mRNA expression levels on longitudinally collected samples of patients with AML (n = 8) measured by RNA-seq. (H) Relative expression heat map of complement genes on longitudinally collected samples of indicated patients with AML. (I) Timeline of disease course of P-Z0119 from primary to deceased (top). Unsupervised t-SNE plot displaying 13 097 cells of primary and relapse post-HSCT from P-Z0119 colored by shared nearest neighbor clusters. (J) Violin plots show the distribution of normalized expression levels of genes and are color coded according to clusters in panel I. (K) Projection of DEGs between primary and relapse samples from P-Z0119. The heat map shows the DEGs within cluster 5. DEG: |log fold change| >0.5; adjusted P < .05 was derived by a Wilcoxon rank-sum test. DA, daunorubicin + cytarabine; DLI, donor lymphocyte infusion; FLAG, fludarabine + cytarabine + G-CSF; P, primary; R, relapse.
Figure 4.
Figure 4.
C1Q+populations are cancer-initiating cells. (A-B) Pictures of PDX recipient-mice constructed by injecting 1 million primary cells of P-S1022. Red circles and arrows indicate the leukemia cutis. (C-D) The leukemic invasions in BM, spleen, liver, and cutis were analyzed by H&E staining (C-D), or IHC staining of hCD45 and hC1Q in liver (D). Flow cytometry analysis of human CD45, CD33, CD34, and C1Q (hCD45, hCD33, hCD34, and hC1Q) expression on cells recovered from BM (E), cutis (F), or spleen (G) of PDX recipient mice. (H) Flow cytometry sorting of BM and peripheral blood sample of P-S1022 based on expression of C1Q. (I-J) Survival curve and body weight of PDX mice injected with one million cells sorted from P-S1022. The hCD45+ cells of P-S1022 were sorted to deplete C1Q+ cells and injected into NSG mice through tail vein. P value was calculated by log-rank (Mantel-Cox) test (I) and 2-sample t test (J). (K) The leukemia cutis from PDX mice was analyzed by H&E and IHC staining of hCD45. Flow cytometry analysis of C1Q expression on cells is shown (right).
Figure 4.
Figure 4.
C1Q+populations are cancer-initiating cells. (A-B) Pictures of PDX recipient-mice constructed by injecting 1 million primary cells of P-S1022. Red circles and arrows indicate the leukemia cutis. (C-D) The leukemic invasions in BM, spleen, liver, and cutis were analyzed by H&E staining (C-D), or IHC staining of hCD45 and hC1Q in liver (D). Flow cytometry analysis of human CD45, CD33, CD34, and C1Q (hCD45, hCD33, hCD34, and hC1Q) expression on cells recovered from BM (E), cutis (F), or spleen (G) of PDX recipient mice. (H) Flow cytometry sorting of BM and peripheral blood sample of P-S1022 based on expression of C1Q. (I-J) Survival curve and body weight of PDX mice injected with one million cells sorted from P-S1022. The hCD45+ cells of P-S1022 were sorted to deplete C1Q+ cells and injected into NSG mice through tail vein. P value was calculated by log-rank (Mantel-Cox) test (I) and 2-sample t test (J). (K) The leukemia cutis from PDX mice was analyzed by H&E and IHC staining of hCD45. Flow cytometry analysis of C1Q expression on cells is shown (right).
Figure 5.
Figure 5.
C1Q+Molm13 cells are highly infiltrative toward tissue fibroblasts. (A) Flow cytometry sorting of Molm13 based on expression of C1Q. (B-C) Transwell migration assay of Molm13C1Q+ and Molm13C1Q−, or Molm13 cocultured with HaCaT, skin fibroblasts, or GI fibroblasts. (D) qPCR analysis of C1QA in Molm13 cells upon depletion of C1QA through shRNA (shC1QA-1 and shC1QA-2). (E) Transwell migration assay of Molm13 cells upon C1QA depletion. (F) NSG mice were injected with one million of Molm13C1Q+ or Molm13C1Q− cells and metastasis nodules in skin and intestine are numbered and shown. (G) Number or size of skin or GI nodules were calculated. (H-I) qPCR analysis of C1QA (H) and TGF-β1, TGF-β2, and TGF-β3 (I) in Molm13C1Q+ and Molm13C1Q− cells. (J) qPCR analysis of TGF-β1, TGF-β2, and TGF-β3 in Molm13C1Q+ cells cocultured with or without fibroblasts. (K) Western blot analysis of TGF-β1 of Molm13C1Q+ and Molm13C1Q− cells cocultured with or without fibroblasts. (L) Transwell migration assay of Molm13C1Q+ cells upon skin fibroblast coculture and TGF-β1 inhibitor galunisertib treatment.
Figure 5.
Figure 5.
C1Q+Molm13 cells are highly infiltrative toward tissue fibroblasts. (A) Flow cytometry sorting of Molm13 based on expression of C1Q. (B-C) Transwell migration assay of Molm13C1Q+ and Molm13C1Q−, or Molm13 cocultured with HaCaT, skin fibroblasts, or GI fibroblasts. (D) qPCR analysis of C1QA in Molm13 cells upon depletion of C1QA through shRNA (shC1QA-1 and shC1QA-2). (E) Transwell migration assay of Molm13 cells upon C1QA depletion. (F) NSG mice were injected with one million of Molm13C1Q+ or Molm13C1Q− cells and metastasis nodules in skin and intestine are numbered and shown. (G) Number or size of skin or GI nodules were calculated. (H-I) qPCR analysis of C1QA (H) and TGF-β1, TGF-β2, and TGF-β3 (I) in Molm13C1Q+ and Molm13C1Q− cells. (J) qPCR analysis of TGF-β1, TGF-β2, and TGF-β3 in Molm13C1Q+ cells cocultured with or without fibroblasts. (K) Western blot analysis of TGF-β1 of Molm13C1Q+ and Molm13C1Q− cells cocultured with or without fibroblasts. (L) Transwell migration assay of Molm13C1Q+ cells upon skin fibroblast coculture and TGF-β1 inhibitor galunisertib treatment.
Figure 6.
Figure 6.
C1Q+ leukemia cells communicate with fibroblasts via surface C1Q-gC1QR signaling. (A) Surface expression of gC1QR on epidermal cells (HaCaT), skin fibroblasts, colon fibroblasts, and HEB cells were evaluated by flow cytometry. Mean fluorescence intensity quantified by flow cytometry is shown. (B) Immunofluorescent staining for gC1QR and F-actin in nonpermeabilized skin fibroblast and GI fibroblast. (C) Immunofluorescent costaining for gC1QR (green), fibroblast-specific protein 1 (red), and the nucleus (4′,6-diamidino-2-phenylindole, blue) on skin, peritoneum, CNS, and lymph node tissue sections. The dashed line indicates the boundary between epidermis and dermis in skin section. The marked regions are enlarged (top or right). (D-E) Transwell migration assay of Molm13C1Q+ cells cocultured with skin fibroblasts with or without gC1QR deletion. (F-G) qPCR (F) and western blot (G) analysis of TGF-β1 of Molm13C1Q+ cells cocultured with skin fibroblasts with or without gC1QR deletion. (H-I) Transwell migration assay of Molm13C1Q+ cells in the presence of recombinant gC1QR (H) or antibodies against C1Q binding sequence of gC1QR (I). (J-K) Molm13C1Q+ cells cocultured with skin fibroblasts were treated with daunorubicin or cytarabine for 48 hours. Cell apoptosis was measured by annexin V/propidium iodide (PI) staining. Representative flow cytometry plots (J) and quantified apoptosis (K) are shown. (L) Molm13C1Q+ cells cocultured with skin fibroblasts with or without gC1QR deletion were treated with daunorubicin or cytarabine. Cell apoptosis was measured by annexin V/PI staining. (M-N) Molm13C1Q+ cells cocultured with or without fibroblasts were subjected to RNA-seq. A volcano plot of DEGs (M) and top 15 biological processes for upregulated DEGs (N) are shown. Relevant DEGs identified in the pathways are labeled. (O-P) Fibroblasts cocultured with or without Molm13C1Q+ were subjected to RNA-seq. A volcano plot of DEGs (O) and enriched biological processes for upregulated DEGs (P) are shown. (Q) Gene set enrichment analysis for complement pathway in daunorubicin-resistant (DNR-R) and sensitive (WT) HL-60 leukemia cells. (R) The hCD45+ cells of BM and leukemia cutis from PDX mice were treated with daunorubicin or cytarabine. Cell apoptosis was measured by annexin V/PI staining. (S) The percentage of living hCD45+ cells was evaluated by flow cytometry in BM from recipient mice injected with BM or leukemia cutis–derived cells after cytarabine treatment (10 mg/kg, once daily for 3 consecutive days, intraperitonially).
Figure 6.
Figure 6.
C1Q+ leukemia cells communicate with fibroblasts via surface C1Q-gC1QR signaling. (A) Surface expression of gC1QR on epidermal cells (HaCaT), skin fibroblasts, colon fibroblasts, and HEB cells were evaluated by flow cytometry. Mean fluorescence intensity quantified by flow cytometry is shown. (B) Immunofluorescent staining for gC1QR and F-actin in nonpermeabilized skin fibroblast and GI fibroblast. (C) Immunofluorescent costaining for gC1QR (green), fibroblast-specific protein 1 (red), and the nucleus (4′,6-diamidino-2-phenylindole, blue) on skin, peritoneum, CNS, and lymph node tissue sections. The dashed line indicates the boundary between epidermis and dermis in skin section. The marked regions are enlarged (top or right). (D-E) Transwell migration assay of Molm13C1Q+ cells cocultured with skin fibroblasts with or without gC1QR deletion. (F-G) qPCR (F) and western blot (G) analysis of TGF-β1 of Molm13C1Q+ cells cocultured with skin fibroblasts with or without gC1QR deletion. (H-I) Transwell migration assay of Molm13C1Q+ cells in the presence of recombinant gC1QR (H) or antibodies against C1Q binding sequence of gC1QR (I). (J-K) Molm13C1Q+ cells cocultured with skin fibroblasts were treated with daunorubicin or cytarabine for 48 hours. Cell apoptosis was measured by annexin V/propidium iodide (PI) staining. Representative flow cytometry plots (J) and quantified apoptosis (K) are shown. (L) Molm13C1Q+ cells cocultured with skin fibroblasts with or without gC1QR deletion were treated with daunorubicin or cytarabine. Cell apoptosis was measured by annexin V/PI staining. (M-N) Molm13C1Q+ cells cocultured with or without fibroblasts were subjected to RNA-seq. A volcano plot of DEGs (M) and top 15 biological processes for upregulated DEGs (N) are shown. Relevant DEGs identified in the pathways are labeled. (O-P) Fibroblasts cocultured with or without Molm13C1Q+ were subjected to RNA-seq. A volcano plot of DEGs (O) and enriched biological processes for upregulated DEGs (P) are shown. (Q) Gene set enrichment analysis for complement pathway in daunorubicin-resistant (DNR-R) and sensitive (WT) HL-60 leukemia cells. (R) The hCD45+ cells of BM and leukemia cutis from PDX mice were treated with daunorubicin or cytarabine. Cell apoptosis was measured by annexin V/PI staining. (S) The percentage of living hCD45+ cells was evaluated by flow cytometry in BM from recipient mice injected with BM or leukemia cutis–derived cells after cytarabine treatment (10 mg/kg, once daily for 3 consecutive days, intraperitonially).
Figure 7.
Figure 7.
MAFB modulates C1Q and TGF-β expression and contributes to EMI. (A) t-SNE projection of MAFB in BM and cutis samples of P-S1022. (B) qPCR analysis of MAFB in healthy BM CD34+ cells and BM and cutis samples from P-S1022. (C) qPCR analysis of MAFB in leukemia blasts of P-S1022 at the time point of primary, relapse 1, and relapse 2. (D-E) qPCR analysis of MAFB (D), C1QA, C1QB, and C1QC (E) in Molm13 cells upon depletion of MAFB through single-guide RNA (sgRNA) (sgMAFB-1 and sgMAFB-2). (F) Flow cytometry analysis of C1Q expression on Molm13 cells upon MAFB depletion. (G) PDX models were constructed with BM cells from P-S1022 infected with sgNC or sgMAFB-1. The percentage of hCD45+ and hCD33+ cells in BM from recipient mice were evaluated by flow cytometry. Western blot analysis of MAFB is shown (right). (H) NSG mice were injected with 2 million Molm13-sgNC or Molm13-sgMAFB-1 cells and metastasis nodules in skin and GI tissues are shown. (I) Number or size of skin or GI nodules were calculated. (J) Flow cytometry analysis of human CD45 and C1Q expression on cells recovered from spleen, leukemia cutis, and GI nodules of PDX recipient mice. (K) qPCR analysis of TGF-β1, TGF-β2, and TGF-β3 in Molm13C1Q+ cells upon MAFB depletion. (L) Western blot analysis of TGF-β1 upon MAFB depletion in Molm13 cells. (M) A model proposing the mechanism by which C1Q-gC1QR signaling promotes leukemia cell migration.
Figure 7.
Figure 7.
MAFB modulates C1Q and TGF-β expression and contributes to EMI. (A) t-SNE projection of MAFB in BM and cutis samples of P-S1022. (B) qPCR analysis of MAFB in healthy BM CD34+ cells and BM and cutis samples from P-S1022. (C) qPCR analysis of MAFB in leukemia blasts of P-S1022 at the time point of primary, relapse 1, and relapse 2. (D-E) qPCR analysis of MAFB (D), C1QA, C1QB, and C1QC (E) in Molm13 cells upon depletion of MAFB through single-guide RNA (sgRNA) (sgMAFB-1 and sgMAFB-2). (F) Flow cytometry analysis of C1Q expression on Molm13 cells upon MAFB depletion. (G) PDX models were constructed with BM cells from P-S1022 infected with sgNC or sgMAFB-1. The percentage of hCD45+ and hCD33+ cells in BM from recipient mice were evaluated by flow cytometry. Western blot analysis of MAFB is shown (right). (H) NSG mice were injected with 2 million Molm13-sgNC or Molm13-sgMAFB-1 cells and metastasis nodules in skin and GI tissues are shown. (I) Number or size of skin or GI nodules were calculated. (J) Flow cytometry analysis of human CD45 and C1Q expression on cells recovered from spleen, leukemia cutis, and GI nodules of PDX recipient mice. (K) qPCR analysis of TGF-β1, TGF-β2, and TGF-β3 in Molm13C1Q+ cells upon MAFB depletion. (L) Western blot analysis of TGF-β1 upon MAFB depletion in Molm13 cells. (M) A model proposing the mechanism by which C1Q-gC1QR signaling promotes leukemia cell migration.

Comment in

References

    1. Martin-Subero JI. Predicting leukemia relapse. Nat Med. 2018;24(4):385–387. - PubMed
    1. Welch JS, Petti AA, Miller CA, et al. TP53 and decitabine in acute myeloid leukemia and myelodysplastic syndromes. N Engl J Med. 2016;375(21):2023–2036. - PMC - PubMed
    1. Marchesi V. Genetics: the AML mutational landscape. Nat Rev Clin Oncol. 2013;10(6):305. - PubMed
    1. Shahin OA, Ravandi F. Myeloid sarcoma. Curr Opin Hematol. 2020;27(2):88–94. - PubMed
    1. Bakst RL, Tallman MS, Douer D, Yahalom J. How I treat extramedullary acute myeloid leukemia. Blood. 2011;118(14):3785–3793. - PubMed

Publication types