. 2022 Nov 1;41(5):111585.
doi: 10.1016/j.celrep.2022.111585.

Spatiotemporal and genetic regulation of A-to-I editing throughout human brain development

Affiliations

Spatiotemporal and genetic regulation of A-to-I editing throughout human brain development

Winston H Cuddleston et al. Cell Rep. .

Abstract

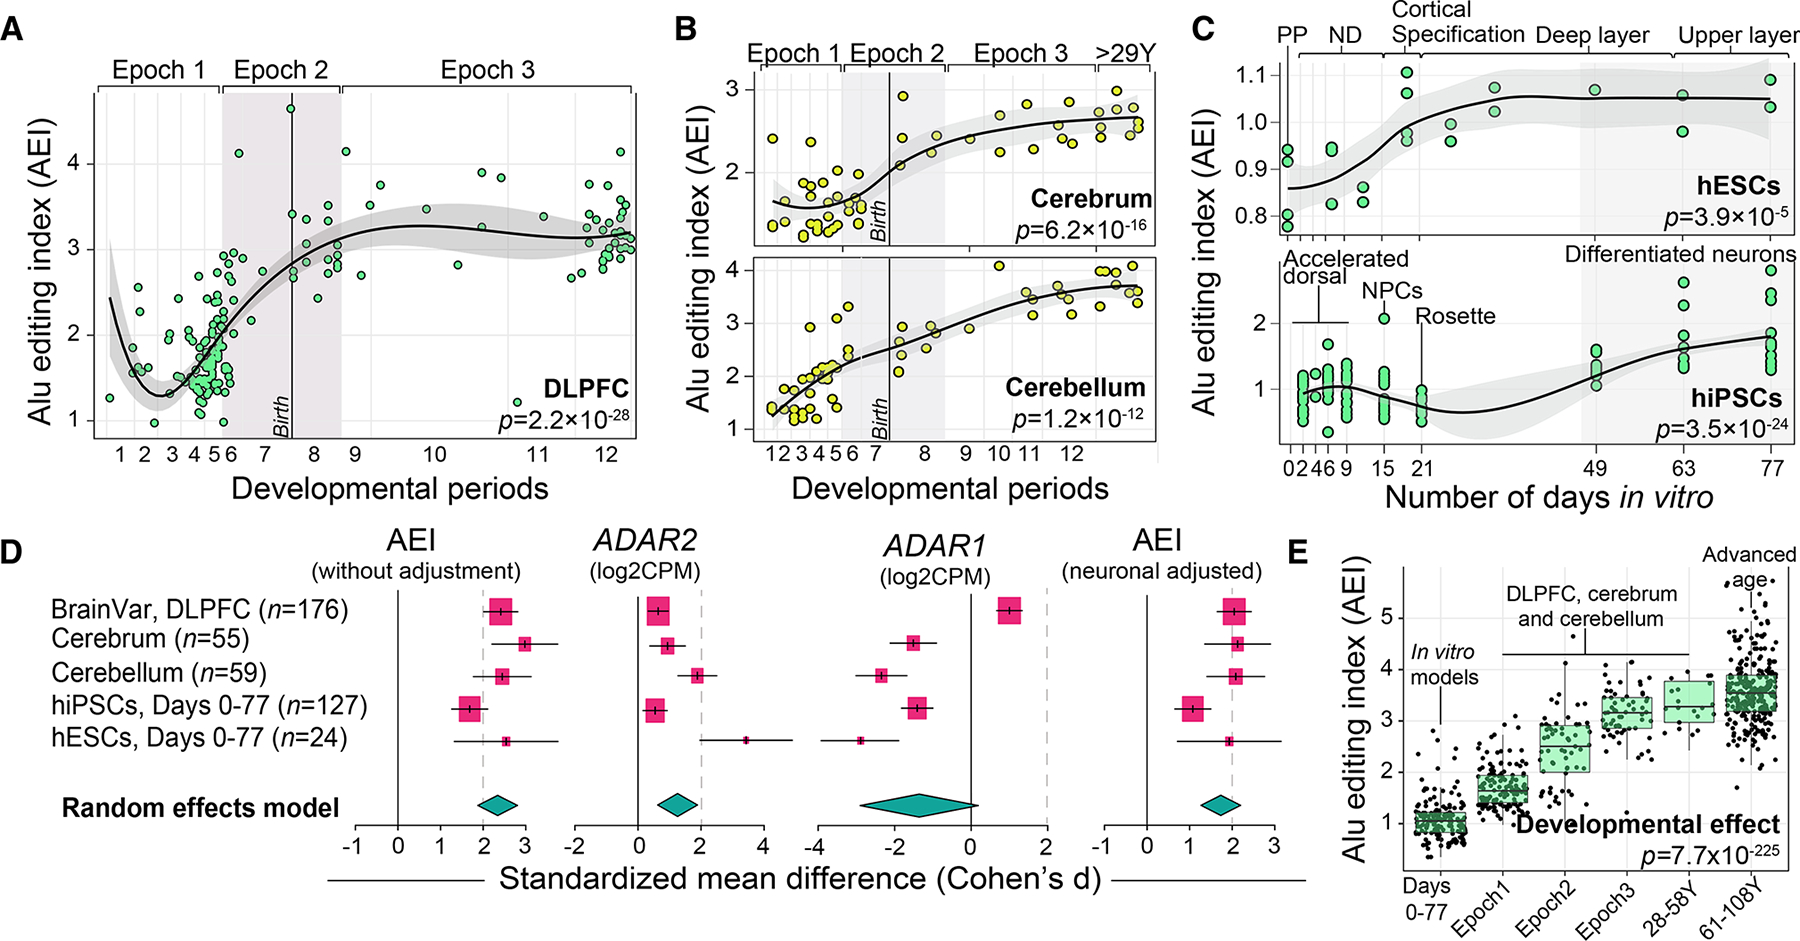
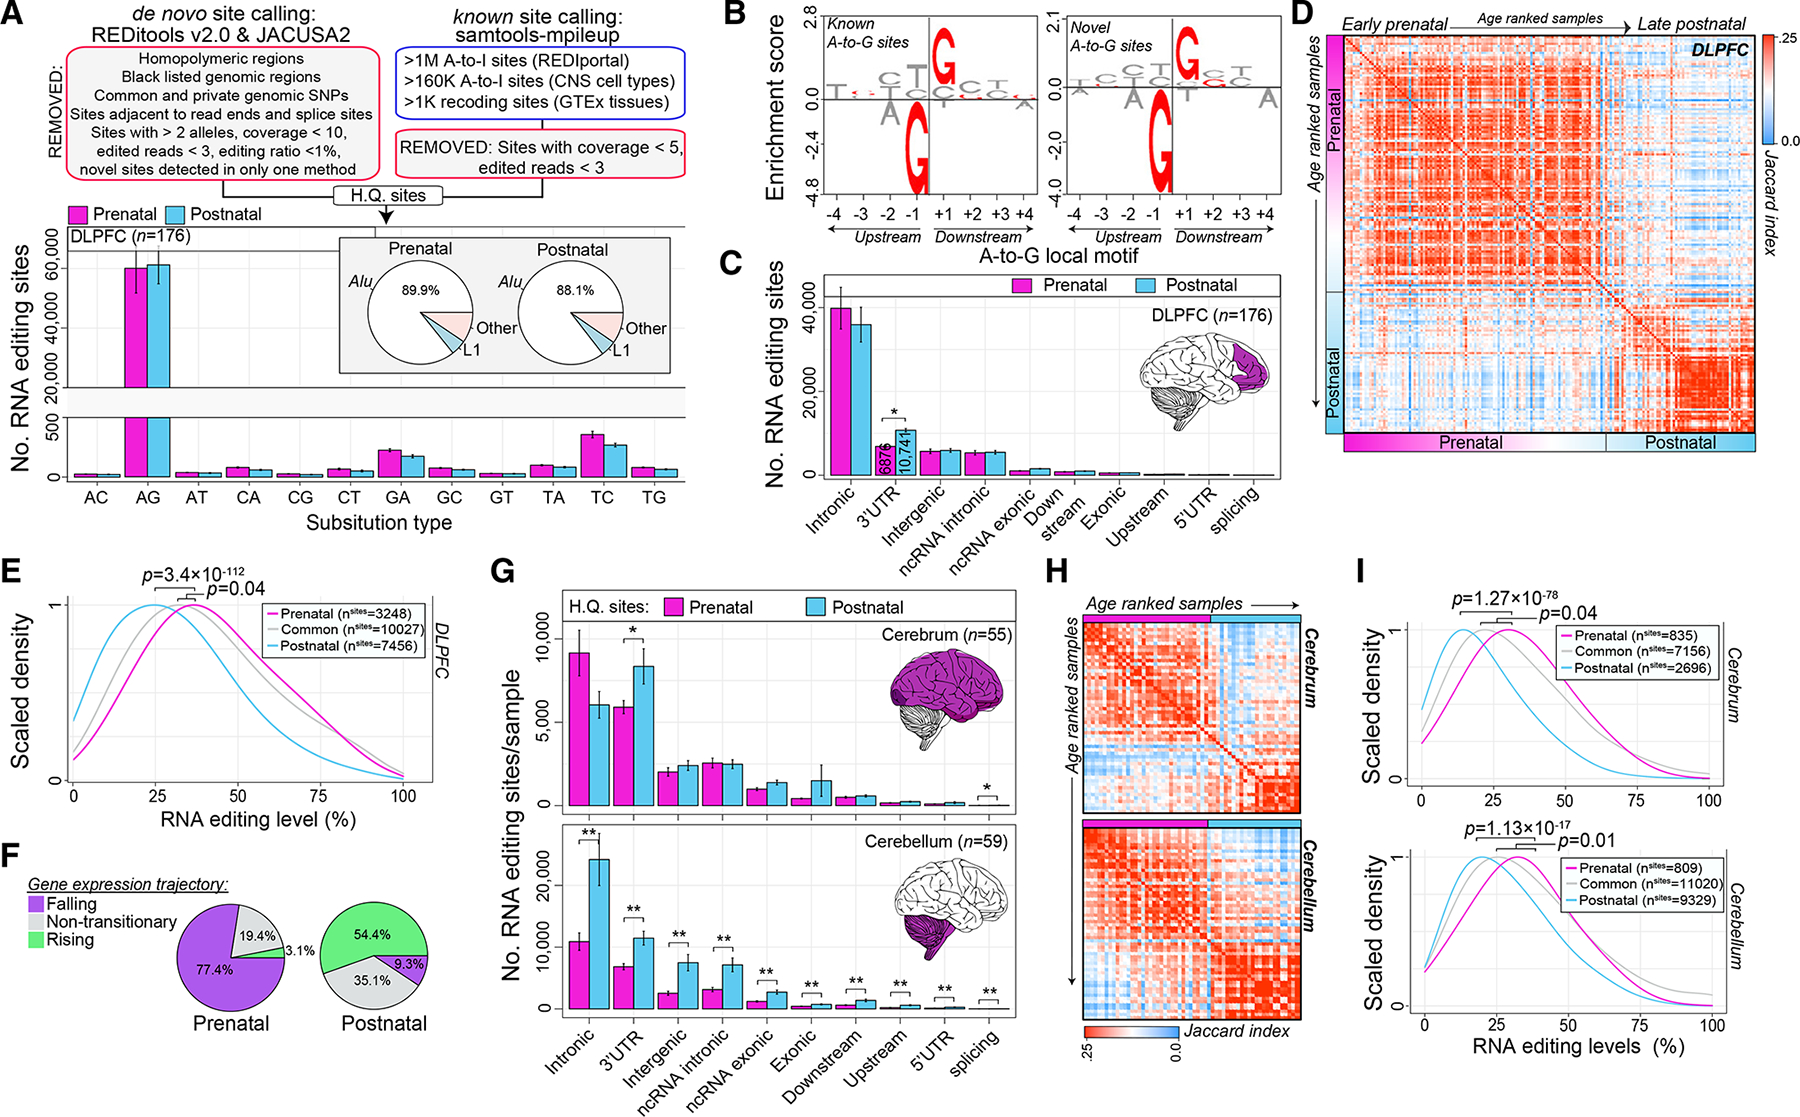
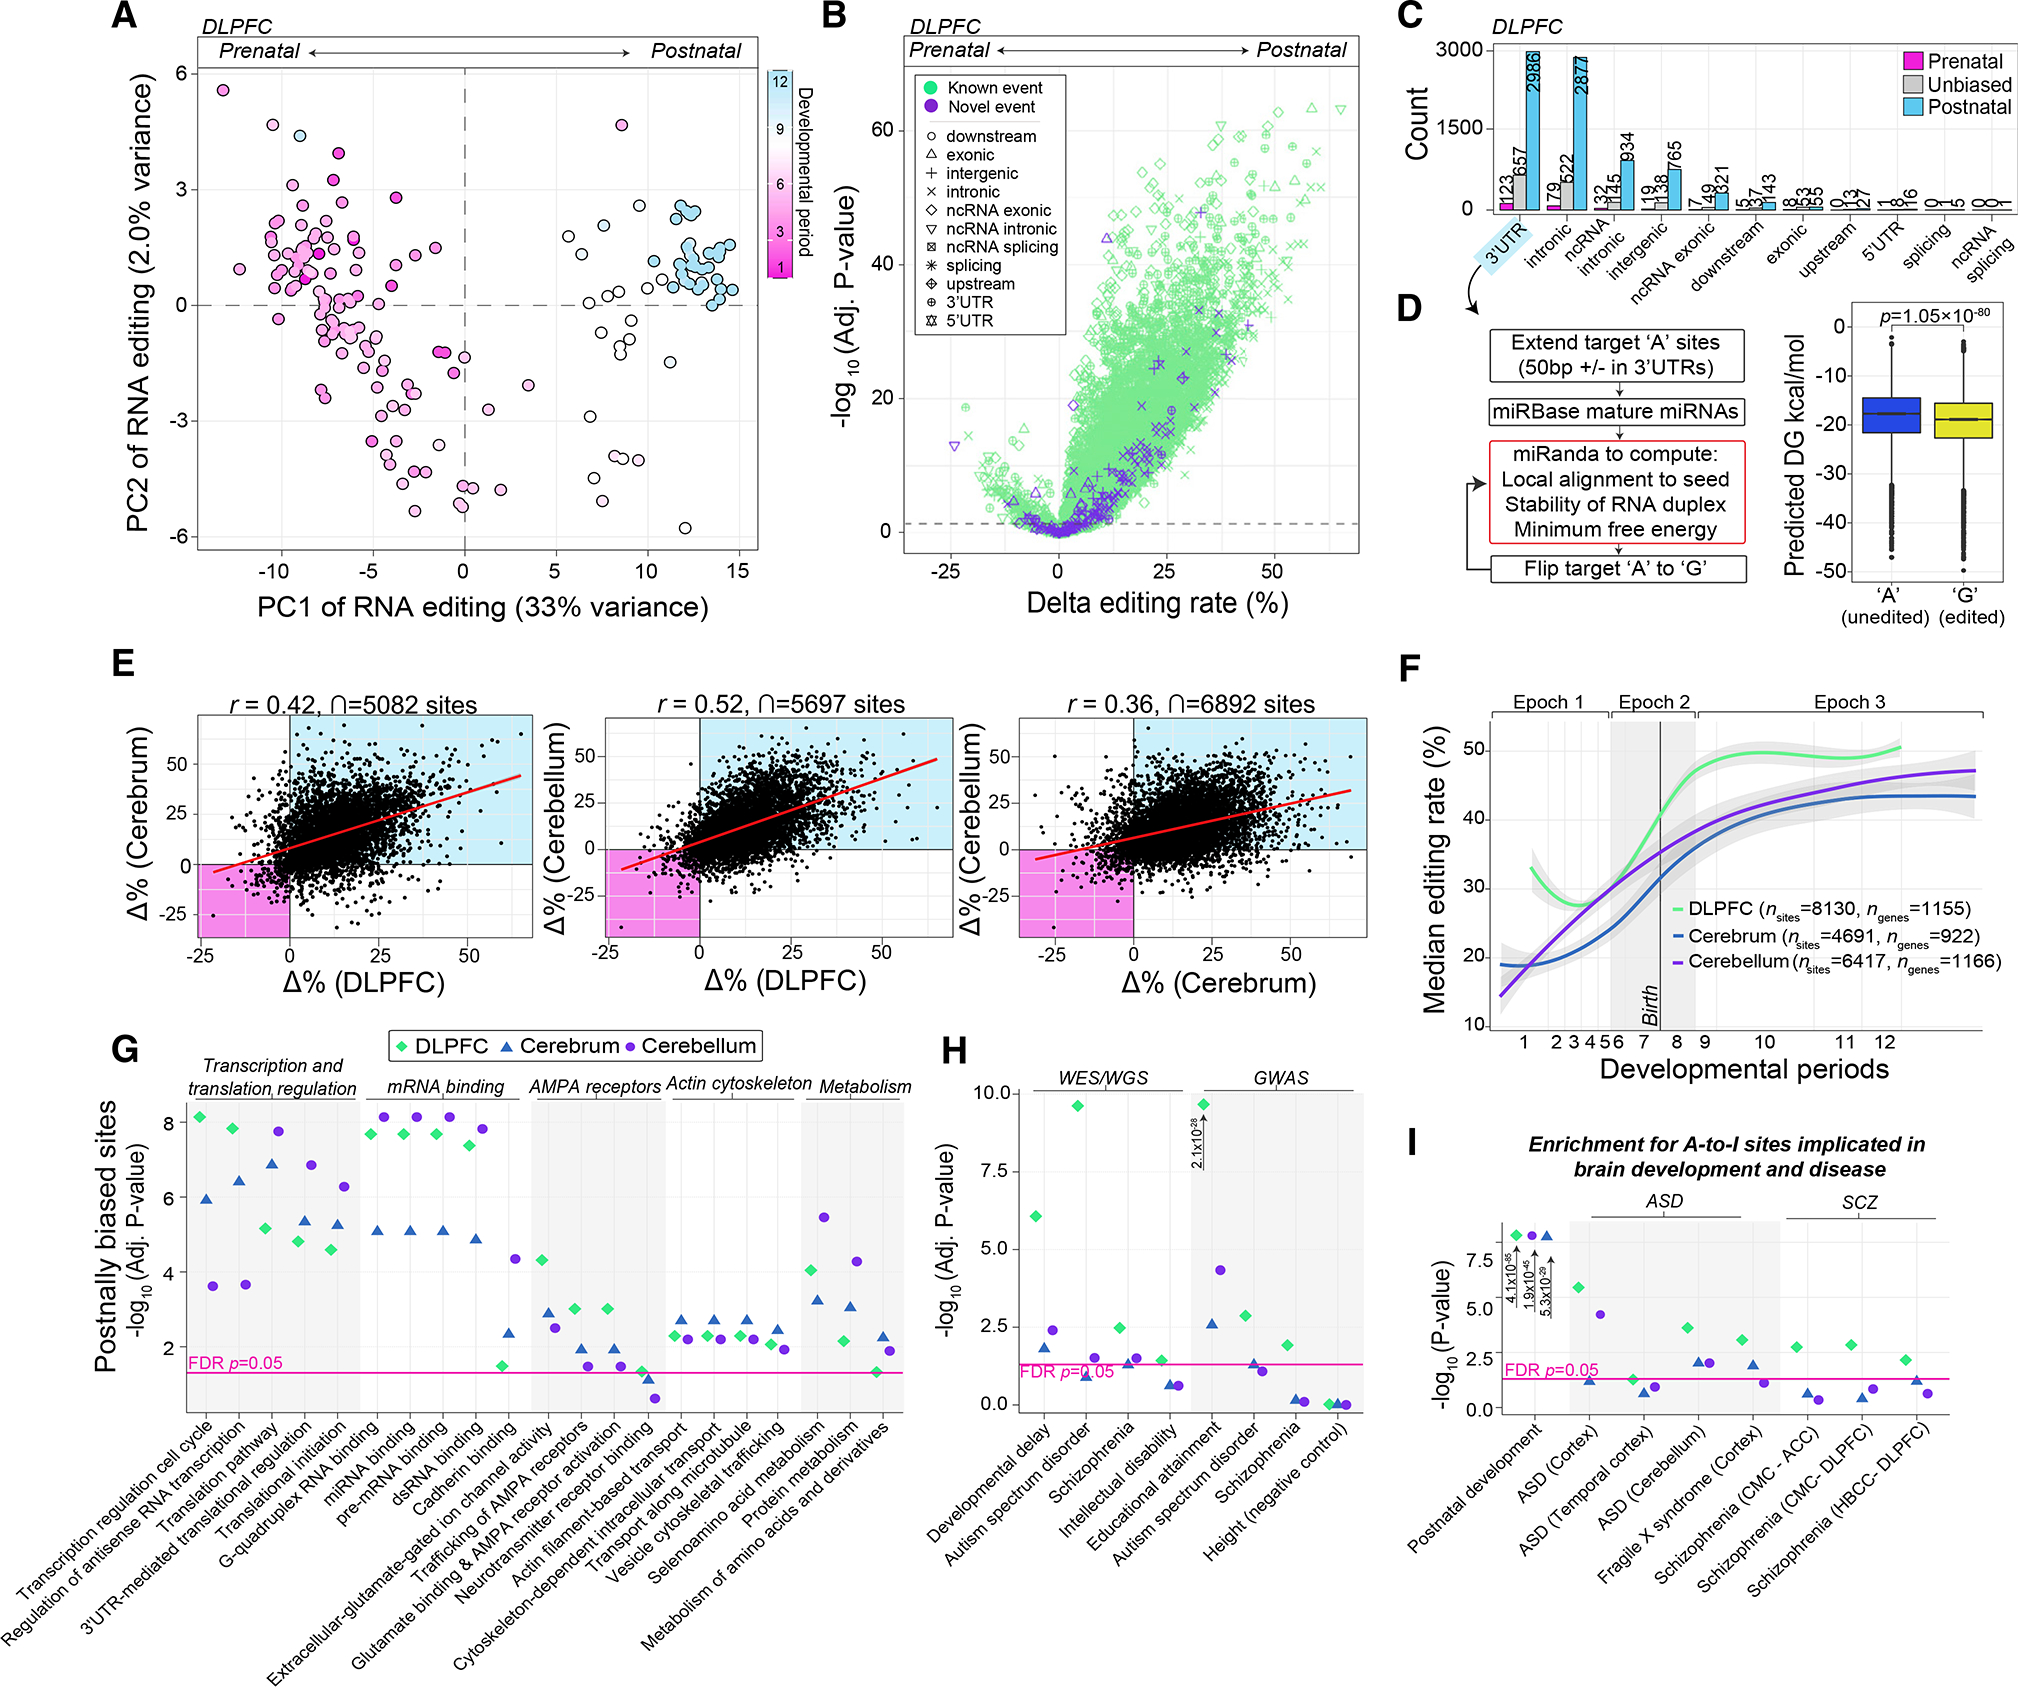
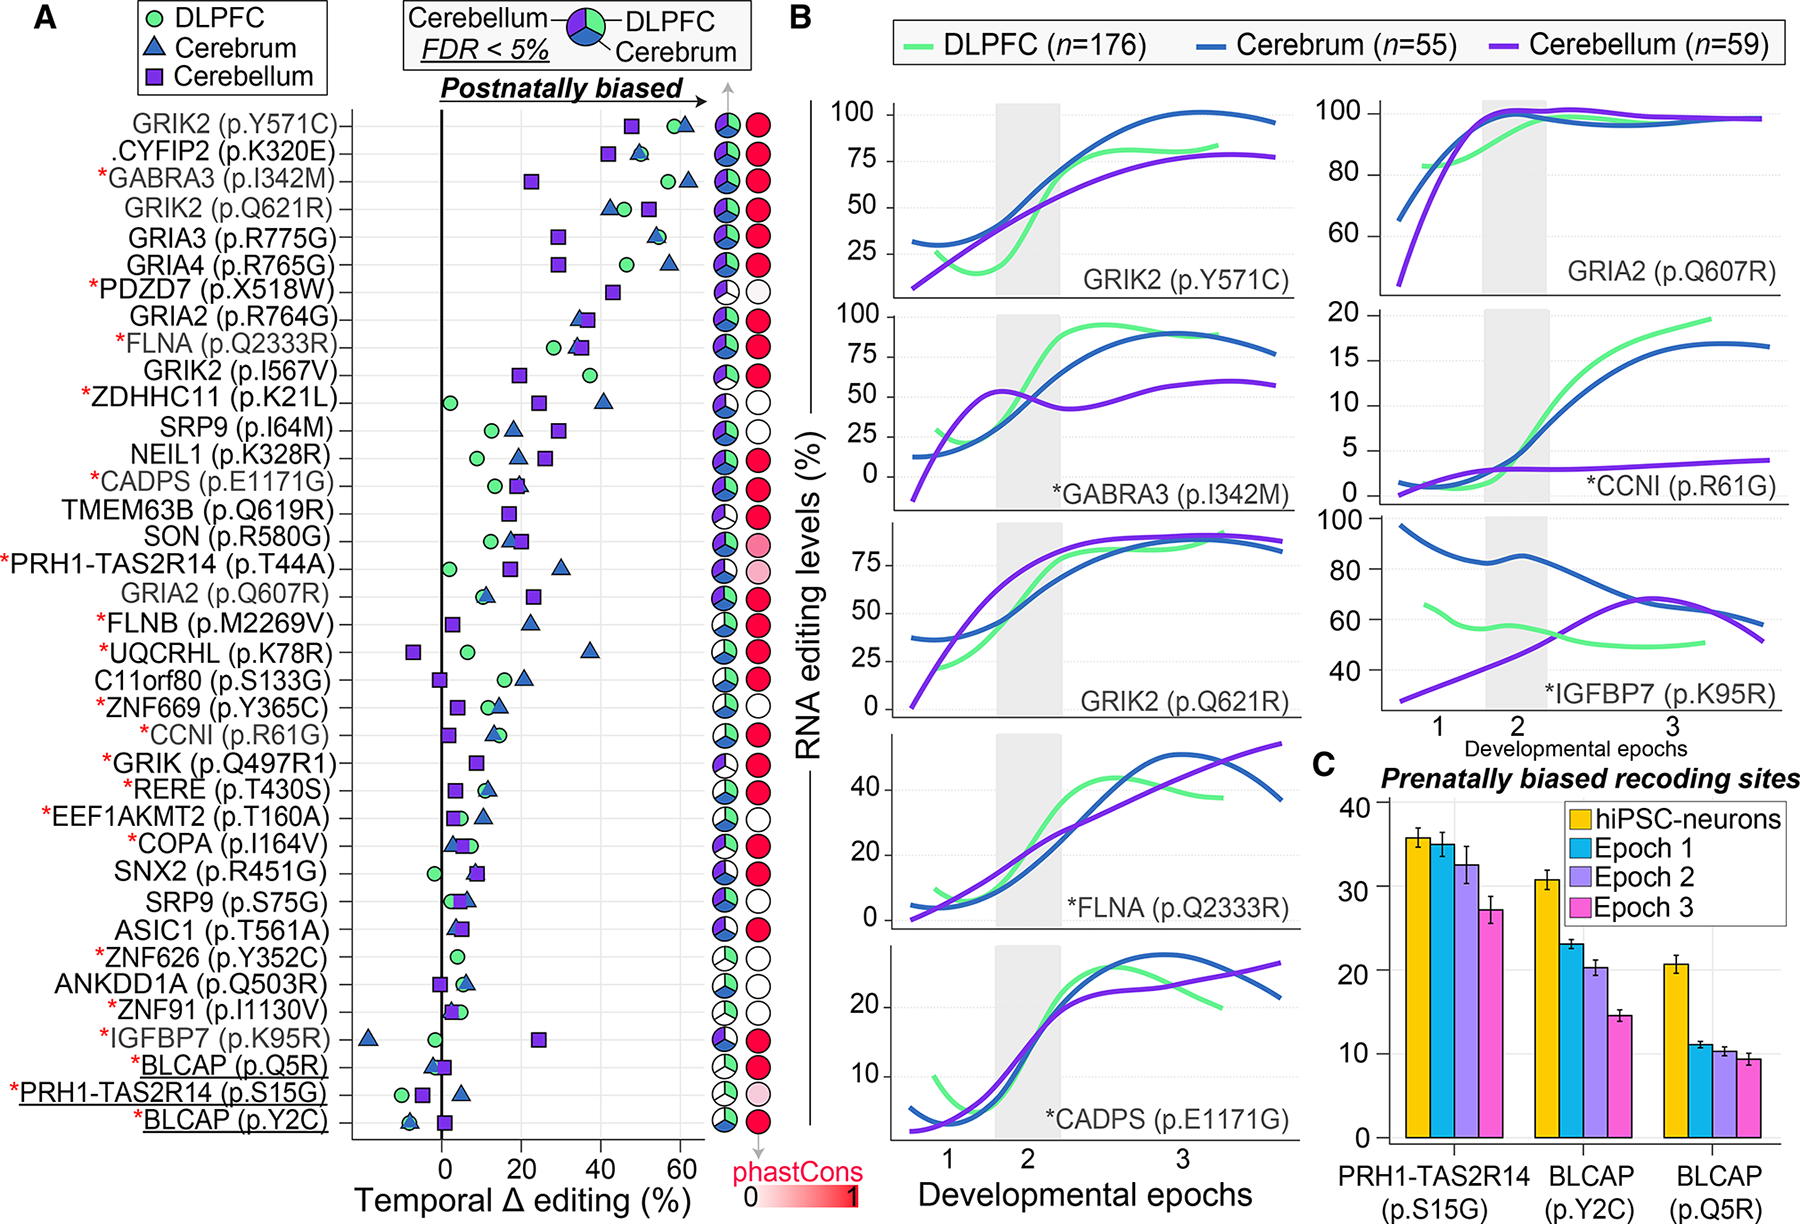
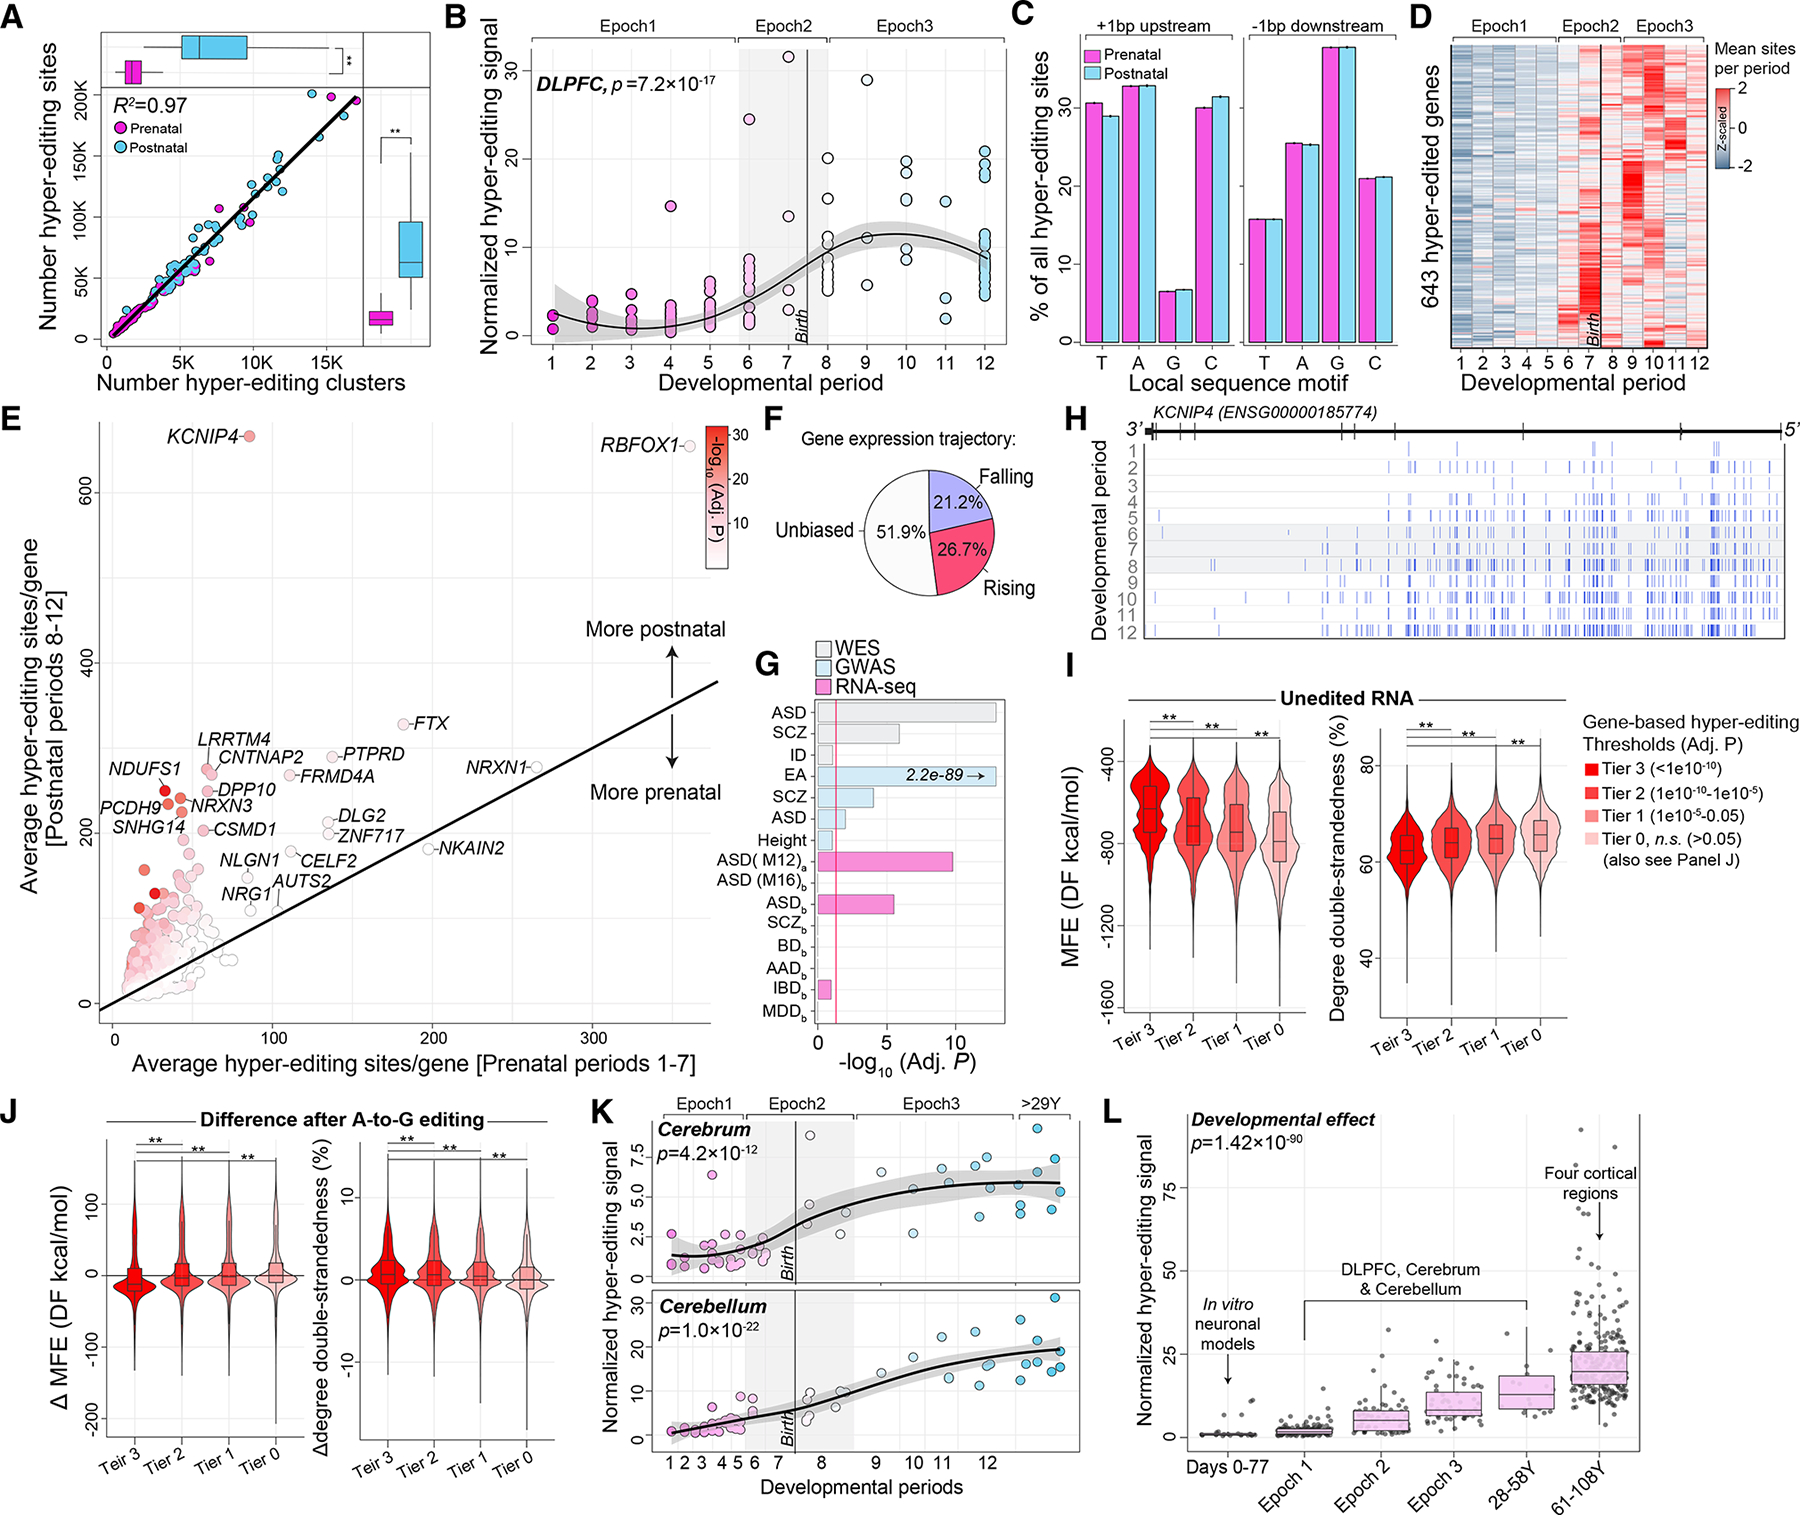
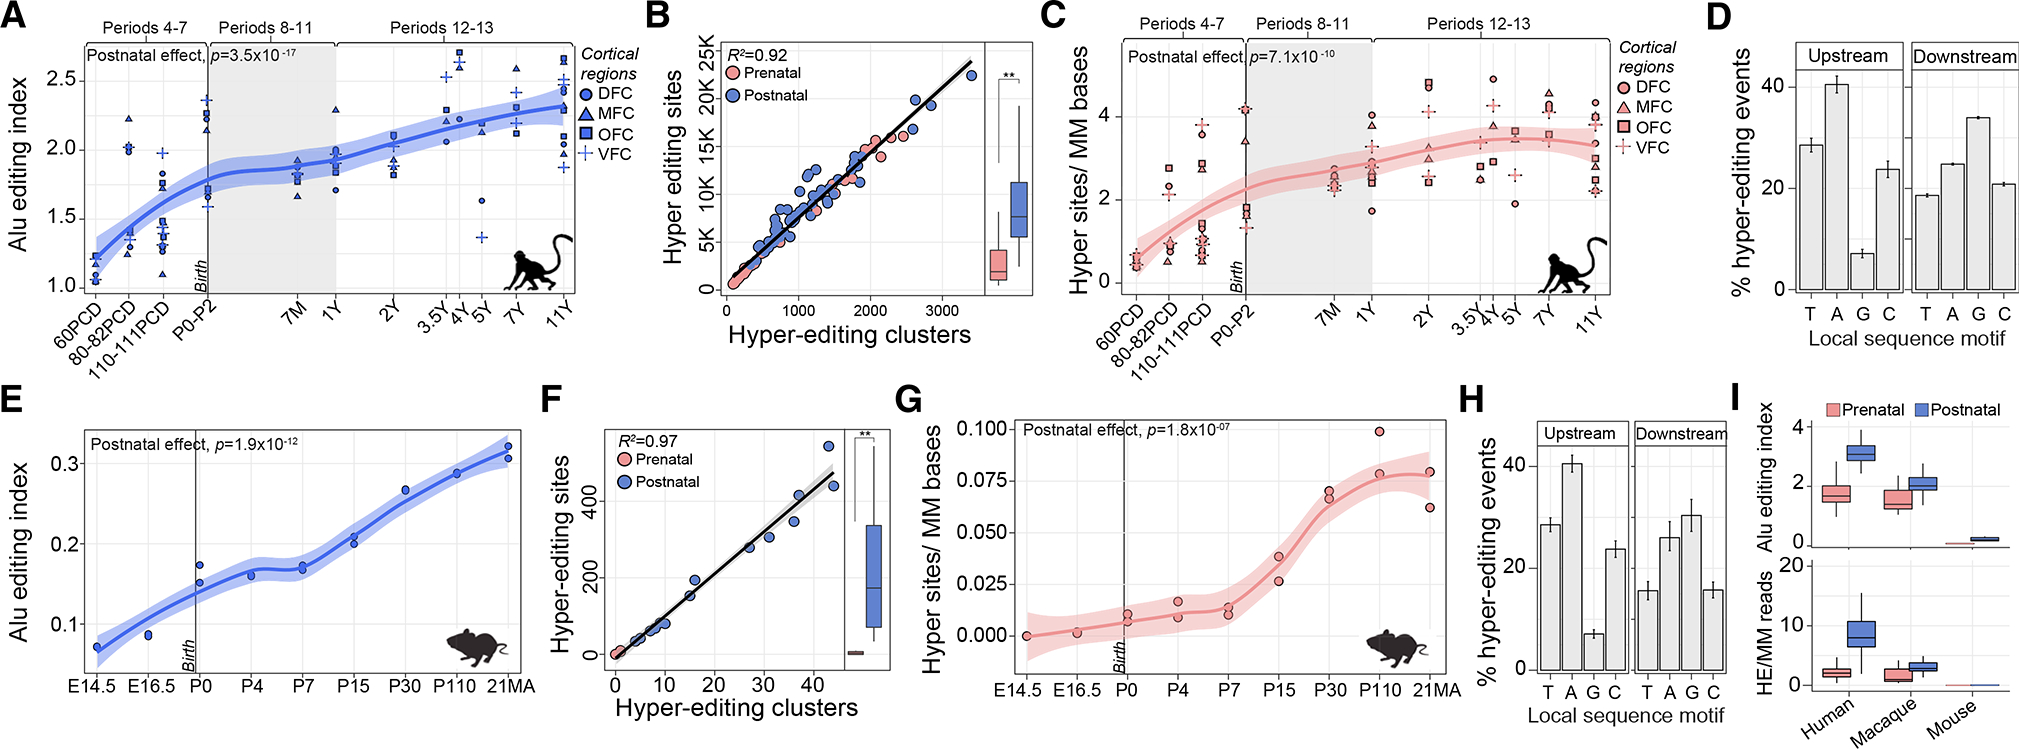
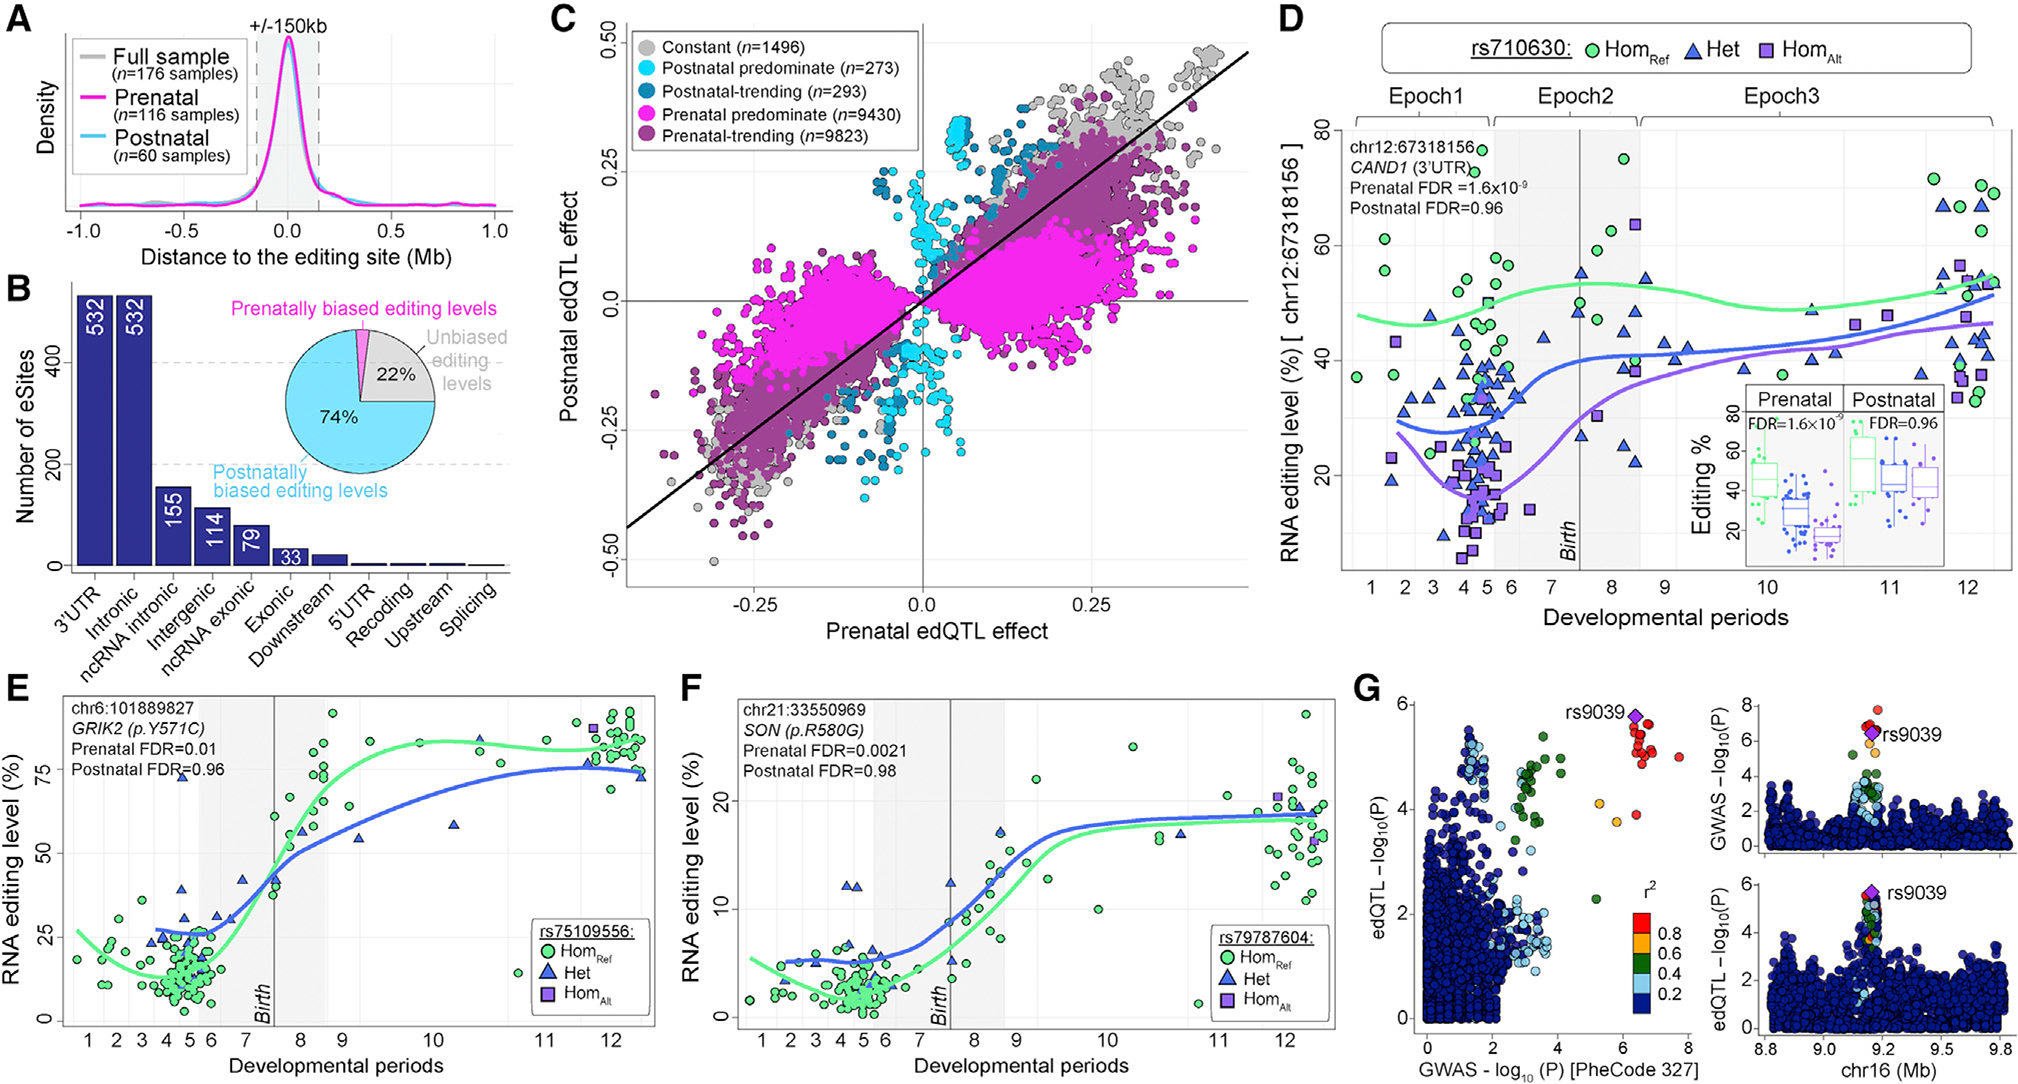
Posttranscriptional RNA modifications by adenosine-to-inosine (A-to-I) editing are abundant in the brain, yet elucidating functional sites remains challenging. To bridge this gap, we investigate spatiotemporal and genetically regulated A-to-I editing sites across prenatal and postnatal stages of human brain development. More than 10,000 spatiotemporally regulated A-to-I sites were identified that occur predominately in 3' UTRs and introns, as well as 37 sites that recode amino acids in protein coding regions with precise changes in editing levels across development. Hyper-edited transcripts are also enriched in the aging brain and stabilize RNA secondary structures. These features are conserved in murine and non-human primate models of neurodevelopment. Finally, thousands of cis-editing quantitative trait loci (edQTLs) were identified with unique regulatory effects during prenatal and postnatal development. Collectively, this work offers a resolved atlas linking spatiotemporal variation in editing levels to genetic regulatory effects throughout distinct stages of brain maturation.

Keywords: CP: Molecular biology; CP: Neuroscience; RNA modifications; RNA recoding; brain maturation; edQTLs; hyper-editing; late-fetal transition.


Conflict of interest statement

Declaration of interests M.S.B. is a consultant for Shape Therapeutics. J.D.B. is a consultant for BridgeBio Pharma.

Figures

Figure 1.
Figure 1.. Alu editing index throughout human brain development and neuronal maturation
(A and B) Alu editing index (AEI; y axis) was computed for (A) DLPFC (n = 176), (B) cerebrum (n = 55) and cerebellum (n = 59), across 12 developmental periods (log age, x axis). Periods 1–7 reflect prenatal windows and periods 8–12 reflect postnatal windows. The late fetal transitional period (epoch 2) is shaded in gray. (C) The AEI (y axis) throughout 77 days of neuronal maturation (x axis) in human embryonic stem cells (hESC; n = 24) and human induced pluripotent stem cells (hiPSCs; n = 127). Abbreviations depicting specific stages are described in the STAR Methods. Loess curves were used to fit the data. Two-sided linear regression was used to test for significance. (D) Meta-analysis of the AEI (with and without neuronal adjustment), ADAR2, and ADAR1 across all datasets. Standardized mean difference (Cohen’s d) compared the differential change in these measures over the course of neuronal maturation and development. A random effects model computed the pooled effect size across all five independent datasets. Confidence intervals (95%) are denoted around each effect size and the size of each box scales with the relative sample size of each study. (E) The AEI (y axis) compiled across 702 developmentally distinct transcriptome samples (x axis), including samples from normal aging (n = 261). Two-sided linear regression was used to test for significance. All boxplots show the medians (horizontal lines), upper and lower quartiles (inner box edges), and 1.5× the inter-quartile range (whiskers).
Figure 2.
Figure 2.. Identification and annotation of selective editing sites
(A) Uncovering high-quality (HQ) sites (top). Bar plots depict mean (with standard error) number of HQ sites for DLPFC prenatal (n = 116) and postnatal (n = 60) samples based on substitution type and repeat element (bottom). (B) Known and not-in-catalog A-to-G sites enrich (y axis) for a common sequence motif featuring a depletion and enrichment of guanosines 1 bp (±) the target adenosine. (C) Bar plots depict mean number of sites (with standard error) per genic region for prenatal and postnatal samples, respectively. Two-sided Student’s t test tested for significance. (D) Jaccard index measures pairwise overlaps of HQ sites detected per sample (red, high; blue, low). Samples are age ranked from early fetal to late postnatal ages. (E) Differences in editing levels for prenatal specific sites relative to common and postnatal specific sites in the DLPFC. Two-sided Mann-Whitney U test tested for significance. (F) Prenatal- and postnatal-specific sites parsed by corresponding temporal gene expression trajectories. (G) Bar plots depicting mean (with standard error) number of HQ sites per genic region for cerebrum (n = 55; top) and cerebellum (n = 59; bottom) samples. Two-sided Student’s t test tested for significance. (H) Jaccard index measures pairwise overlaps of all HQ sites detected per sample in the cerebrum (top) and cerebellum (bottom). (I) Differences in editing levels for prenatal specific sites relative to common and postnatal specific sites in the cerebrum (top) and cerebellum (bottom). Two-sided Mann-Whitney U test tested for significance.
Figure 3.
Figure 3.. Spatiotemporal changes in RNA editing levels
(A) Principal-component analysis of editing levels (n = 10,027 sites) stratifies DLPFC prenatal from postnatal samples (n = 176). (B) Differential editing analysis compares the strength of significance (−log10 FDR-adjusted p; y axis) of temporally regulated sites relative to delta editing levels (x axis). (C) Sites according to the temporal bias are partitioned by genic region. (D) Schematic for estimating miRNA binding affinity to 3′ UTRs and changes in estimated minimum free energy (MFE) with and without A-to-G editing (left). Differences in miRNA MFE computed for only high confident local alignments between miRNA seed regions and 3′ UTRs (right). Significance was tested using a two-sided Mann-Whitney U test. (E) Pairwise Pearson’s correlation of temporal changes in editing levels (delta editing rates) among the DLPFC, cerebrum (n = 55), and cerebellum (n = 59). (F) Median editing levels for sites with an increasing pattern across development (log age, x axis). (G) Functional enrichment of genes harboring a site with an increasing profile and the top 5 enriched categories are depicted. (H) The same genes were examined for enrichment of neurodevelopmental disorder-related genes and gene sets identified from large-scale genetic and genomic studies. (I) Sites with an increasing profile were examined for enrichment of editing sites previously found to be dysregulated in studies of postmortem brain tissue from individuals with neurodevelopmental disorders. Pink line indicates a Benjamini-Hochberg adjusted p < 0.05.
Figure 4.
Figure 4.. Spatiotemporal dynamics of RNA recoding sites across development
(A) Ranking of 37 recoding sites (y axis) by temporal effect sizes (delta editing rates; x axis) between prenatal and postnatal periods. Each recoding site exhibits a significant change in editing levels in at least one anatomical region. Pie charts indicate where a recoding site is significantly temporally regulated (FDR < 5%). PhastCons scores represent probabilities of negative selection and range between zero (white) and one (red). Red asterisks (*) indicate sites that validate in mature hiPSC-derived neurons. (B) Examples for eight spatiotemporally recoding sites with significant changes in editing levels (y axis) across development (log age, x axis) in the DLPFC (n = 176), cerebrum (n = 55), and cerebellum (n = 59). These sites include well-known sites (e.g., GRIK2 [p.Y571C], GRIA2 [p.Q607R]) and other sites with unexplored roles in neurodevelopment. The late fetal transition (epoch 2) is shaded in gray. Loess curves were used to fit the data. (C) Fetal validation of the three prenatal specific recoding sites in mature hiPSC-derived neurons (day 77; n = 30) relative to the DLPFC.
Figure 5.
Figure 5.. RNA hyper-editing across human brain development
(A) Hyper-editing sites in the DLPFC (y axis; n = 176) increase during postnatal development and are concordant with the frequency of hyper-editing clusters (x axis). (B) DLPFC normalized RNA hyper-editing signal (y axis) across development (log age; x axis). (C) Hyper-editing sites enrich for a common local sequence motif. (D) Heatmap of genes that amass hyper-editing events during postnatal development. The number of hyper-editing sites per period are averaged for each gene and z scaled. (E) Mean number of hyper-editing sites per gene during prenatal periods 1–7 (x axis) versus postnatal periods 8–12 (y axis). (F) The developmental expression trajectories for genes that amass hyper-editing sites during postnatal periods. (G) Genes enriched for postnatal hyper-editing enrich for neurodevelopmental disorder genes curated from independent genomic studies. (H) RNA hyper-editing barcode plot illustrates when and where hyper-editing sites amass in KCNIP4, an educational attainment gene. (I) Minimum free energy (MFE) and the degree of double-strandedness predictions for RNA secondary structures without hyper-editing. Secondary structures were assigned back to a gene, and genes were parsed according to level of postnatal hyper-editing enrichment to form four tiers of genes. (J) Changes in MFE and degree of double-strandedness following hyper-editing. Two-sided Mann-Whitney U tests were used to test for significance. (K) Normalized hyper-editing levels across cerebrum (n = 55; top) and cerebellar (n = 59; bottom) development. (L) Compiling the normalized hyper-editing signal across development (n = 575), including hESCs (n = 24) and normal aging (n = 261). Two-sided linear regression analyses tested for significance.
Figure 6.
Figure 6.. Temporal dynamics of RNA editing in animal models of neurodevelopment
(A) The AEI (y axis) of four cortical regions (DFC, MFC, OFC, and VFC) across rhesus macaque (n = 26 biological replicates) development (log age; x axis). Macaque developmental periods were matched with those closest to human as described previously. (B) Hyper-editing site detection (y axis) and the number of hyper-editing clusters (x axis). The number of hyper-editing sites increases into postnatal development.**p = 2.8 × 10⁻⁶. (C) Temporal increase in normalized hyper-editing levels across development. p = 7.1 × 10⁻⁷. (D) Local sequence motifs for hyper-editing sites 1 bp upstream and downstream of the target adenosine (standard error bars represent sample level variability). (E) The AEI (y axis) of whole cortex in mouse (n = 18) across nine developmental periods (x axis). (F) Hyper-editing site detection (y axis) and the number of hyper-editing clusters (x axis). The number of hyper-editing sites increases into postnatal development. **p < 2 × 10⁻¹⁶. (G) Temporal increase in normalized hyper-editing levels across developmental periods. (H) Local sequence motifs for hyper-editing sites 1 bp upstream and downstream of the target adenosine (standard error bars represent sample level variability). (I) Compiling the AEI and normalized hyper-editing levels across prenatal and postnatal stages between humans (using DLPFC; n = 176), rhesus macaque and mouse. Linear regression was used to compute significance for all tests.
Figure 7.
Figure 7.. Temporal predominate cis-edQTLs in the dorsolateral prefrontal cortex
(A) Distribution of the association tests in relation to the distance between the editing site and variant for max-edQTLs. The gray box indicates ±150 kb relative to the editing site. (B) eSites parsed by genic region and temporal editing levels in the DLPFC (inset pie chart). (C) Prenatal (x axis) versus postnatal (y axis) effect sizes for all significant edQTLs. edQTLs are split into five categories based on temporal predominance using effect size and statistical thresholds. (D–F) (D) RNA editing levels binned by genotype for a top prenatal-predominant edQTL for CAND1. Curves were fit using loess trajectories for RNA editing levels in samples with each of three genotypes. Inset boxplots for prenatal (left) and postnatal (right) periods with each of three genotypes. Example of prenatal predominate edQTLs for two recoding sites in (E) GRIK2 (p.Y571C) and (F) SON (p.R580G). Lines represent loess trajectories for RNA editing in samples with each genotype. (G) Locuscompare plots of the top co-localized hit for variant rs9039 associated with sleep disorders (PheCode 327).

References

    1. Behm M, and Öhman M (2016). RNA editing: a contributor to neuronal dynamics in the mammalian brain. Trends Genet. 32, 165–175. - PubMed
    1. Mehler MF, and Mattick JS (2007). Noncoding RNAs and RNA editing in brain development, functional diversification, and neurological disease. Physiol. Rev. 87, 799–823. - PubMed
    1. Bazak L, Haviv A, Barak M, Jacob-Hirsch J, Deng P, Zhang R, Isaacs FJ, Rechavi G, Li JB, Eisenberg E, and Levanon EY (2014). A-to-I RNA editing occurs at over a hundred million genomic sites, located in a majority of human genes. Genome Res. 24, 365–376. - PMC - PubMed
    1. Carmi S, Borukhov I, and Levanon EY (2011). Identification of widespread ultra-edited human RNAs. PLoS Genet. 7, e1002317. - PMC - PubMed
    1. Paz-Yaacov N, Levanon EY, Nevo E, Kinar Y, Harmelin A, Jacob-Hirsch J, Amariglio N, Eisenberg E, and Rechavi G (2010). Adenosine-to-inosine RNA editing shapes transcriptome diversity in primates. Proc. Natl. Acad. Sci. USA 107, 12174–12179. - PMC - PubMed

Publication types