. 2022 Nov 1;41(5):111574.
doi: 10.1016/j.celrep.2022.111574.

Disruption of mTORC1 rescues neuronal overgrowth and synapse function dysregulated by Pten loss

Affiliations

Disruption of mTORC1 rescues neuronal overgrowth and synapse function dysregulated by Pten loss

Kamran Tariq et al. Cell Rep. .

Abstract

Phosphatase and tensin homolog deleted on chromosome 10 (PTEN) is a negative regulator of AKT/mTOR signaling pathway. Mutations in PTEN are found in patients with autism, epilepsy, or macrocephaly. In mouse models, Pten loss results in neuronal hypertrophy, hyperexcitability, seizures, and ASD-like behaviors. The underlying molecular mechanisms of these phenotypes are not well delineated. We determined which of the Pten loss-driven aberrations in neuronal form and function are orchestrated by downstream mTOR complex 1 (mTORC1). Rapamycin-mediated inhibition of mTORC1 prevented increase in soma size, migration, spine density, and dendritic overgrowth in Pten knockout dentate gyrus granule neurons. Genetic knockout of Raptor to disrupt mTORC1 complex formation blocked Pten loss-mediated neuronal hypertrophy. Electrophysiological recordings revealed that genetic disruption of mTORC1 rescued Pten loss-mediated increase in excitatory synaptic transmission. We have identified an essential role for mTORC1 in orchestrating Pten loss-driven neuronal hypertrophy and synapse formation.

Keywords: CP: Cell biology; CP: Neuroscience; PTEN; Raptor; autism; dendrite; mTOR; rapamycin; synapse.


Conflict of interest statement

Declaration of interests Authors declare no competing interests.

Figures
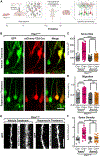
Figure 1.
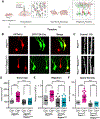
Figure 1.. Rapamycin treatment rescues Pten KO-mediated somal hypertrophy, aberrant migration, and increased spine density
(A) Schematic of experimental setup. Retroviruses encoding a fluorophore only (GFP) or a fluorophore and Cre recombinase (mCherry-T2A-Cre) were co-injected into dentate gyrus of Ptenflx/flx animals at postnatal day 7 (P7). Rapamycin (10 mg/kg of body weight) or vehicle was administered intraperitoneally from P10 to P31 daily. At P31, animals were perfused, and immunohistochemistry of hippocampal slices was performed for subsequent imaging and analysis. (B) Top panel shows representative images of vehicle-treated immunolabeled granule neurons from Ptenflx/flx animals, while bottom panel shows representative images of rapamycin-treated immunolabeled granule neurons from Ptenflx/flx animals (scale bar represents 20 μm). (C) Pten KO-mediated somal hypertrophy was completely rescued with rapamycin treatment, when compared with vehicle-treated Pten KO granule neurons. (D) Rapamycin treatment of Pten KO granule neurons completely rescued the farther migration of vehicle-treated Pten KO granule neurons in the granule cell layer (GCL). (E) Representative images for spine density analysis (scale bar represents 5 μm). (F) The increased spine density of vehicle-treated Pten KO granule neurons was rescued by rapamycin treatment. The mixed-effects model in STATA was performed to determine p value (*p < 0.05, **p < 0.01, ***p < 0.001, ****p < 0.0001). See Tables S1A–S1C for detailed statistics and quantitative results.
Figure 2.
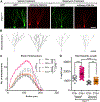
Figure 2.. Rapamycin treatment rescues Pten KO-mediated dendritic overgrowth
Retroviruses encoding a fluorophore only (GFP) or a fluorophore and Cre recombinase (mCherry-T2A-Cre) were co-injected into dentate gyrus of Ptenflx/flx animals at postnatal day 7 (P7). Rapamycin (10 mg/kg of body weight) or vehicle was administered intraperitoneally from P10 to P31 daily. At P31, animals were perfused, and immunohistochemistry of hippocampal slices was performed for dendritic arbor reconstruction. (A) Representative images of vehicle- or rapamycin-treated immunolabeled granule neurons from Ptenflx/flx animals (scale bar represents 50 μm). (B) 2D reconstructions of neurons in (A) (scale bar represents 50 μm). (C) The increase in Sholl analysis of intersections of vehicle-treated Pten KO granule neurons was rescued by rapamycin treatment. (D) Rapamycin treatment rescued the increase in total dendritic length of vehicle-treated Pten KO granule neurons. The mixed-effects model in STATA was performed to determine p value (*p < 0.05, **p < 0.01, ***p < 0.001, ****p < 0.0001). See Tables S1F–S1G for statistics and quantitative results.
Figure 3.
Figure 3.. Genetic disruption of mTORC1 rescues Pten KO-mediated somal hypertrophy, aberrant migration, and increased spine density
(A) Schematic of experimental setup. Retroviruses encoding a fluorophore only (mCherry) or a fluorophore and Cre recombinase (GFP-T2A-Cre) were co-injected into dentate gyrus of either Ptenflx/flx, or Ptenflx/flxRaptorflx/flx animals at postnatal day 7 (P7). At postnatal day 28 (P28), animals were perfused, and immunohistochemistry was performed for subsequent imaging and analysis. (B) Top panels show representative images of immunolabeled granule neurons from Ptenflx/flx animals, while bottom panels show representative images of immunolabeled granule neurons from Ptenflx/flxRaptorflx/flx animals, for soma size and migration analysis (scale bar represents 20 μm). (C) Representative images for spine density analysis (scale bar represents 5 μm). (D) Pten KO-mediated somal hypertrophy was completely rescued in Pten and Raptor DKO granule neurons. (E) The farther migration of Pten KO granule neurons in the granule cell layer (GCL) was completely rescued in Pten and Raptor DKO granule neurons. (F) The Pten KO-mediated increase in spine density was completely rescued in Pten and Raptor DKO granule neurons. The mixed-effects model in STATA was performed to determine p value (*p < 0.05, **p < 0.01, ***p < 0.001, ****p < 0.0001). See Tables S1A–S1C for statistical and quantitative results.
Figure 4.
Figure 4.. Genetic disruption of mTORC1 rescues Pten KO-mediated dendritic overgrowth
Hippocampal dentate gyrus of Ptenflx/flx or Ptenflx/flx Raptorflx/flx animals were co-injected with fluorophore only (mCherry) retrovirus or fluorophore and Cre (GFP-T2A-Cre) retrovirus at P7. Animals were perfused at P28 for subsequent immunohistochemistry and reconstruction of dendritic arbor. (A) Top panels show representative images of immunolabeled granule neurons from Ptenflx/flx animals, while bottom panels show representative images of immunolabeled granule neurons from Ptenflx/flxRaptorflx/flx animal (scale bar represents 50 μm). (B) 3D reconstructions of neurons in (A) (scale bar represents 50 μm). (C) Pten and Raptor DKO completely rescues the increase in Sholl of intersections of Pten KO granule neurons. (D) Increased total dendritic length of Pten KO granule neurons was rescued in Pten and Raptor DKO granule neurons. The mixed-effects model in STATA was performed to determine p value (*p < 0.05, **p < 0.01, ***p < 0.001, ****p < 0.0001). See Tables S1F–S1G for statistics and quantitative results.
Figure 5.
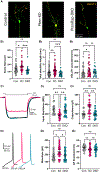
Figure 5.. Genetic disruption of mTORC1 rescues Pten KO-mediated hypertrophy and membrane hypoexcitability in single neuron cultures
(A) Representative images showing fluorescence intensity in an orange color look up table (LUT) from VGLUT1 immunostaining superimposed on a tracing of the cell body and dendrites of a control (left), Pten KO (center), and PtenRaptor DKO (right) neuron. (B) The soma size, dendritic length, and number of VGLUT1-positive puncta of Pten KO neurons is increased relative to control and decreased in PtenRaptor DKO neurons. (C1) Example current-clamp traces of the membrane voltage (Vm) response of control (black), Pten KO (magenta), and PtenRaptor DKO (cyan) to a −100-pA, 500-ms current step. (C2) The input resistance and capacitance changes caused by Pten KO, calculated from the negative current injections, is normalized in PtenRaptor DKO neurons. (For dot plots, each dot represents the data point from one neuron.) Generalized estimating equations in SPSS were used for statistical analysis. (*p < 0.05, **p < 0.01, ***p < 0.001). See Table S2 for statistics and quantitative data.
Figure 6.
Figure 6.. Genetic disruption of mTORC1 rescues Pten KO-mediated increases in excitatory synaptic transmission
(A) Representative traces (A1) and summary data (A2) of EPSCs evoked by a 2-ms depolarization from control (black), Pten KO (magenta), and PtenRaptor DKO (cyan) neurons. (B) Representative traces (B1) and summary data (B2) of miniature EPSCs recorded in TTX from control (black), Pten KO (magenta), and PtenRaptor DKO (cyan) neurons. (C) Representative traces (C1) of the current response to 500 mM sucrose application and summary data (C2) of the number of synaptic vesicles in the readily releasable pool. (D) Representative traces (D1) of miniature EPSCs recorded in TTX and summary data (D2) of the mEPSC frequency. (E) Scatterplot of eEPSC charge versus RRP charge. Solid lines represent regression lines. The average release fraction is given by the slopes of the regression lines. (F) Vesicular release probability calculated by dividing sucrose charge by eEPSC charge for each neuron. (G) Example traces (G1) of two eEPSC separated by 25 ms and normalized to the peak of the first eEPSC, along with summary data (G2) showing mean ± SEM for each genotype and interpulse interval. For dot plots, each dot represents the data point from one neuron. Generalized estimating equations in SPSS were used for statistical analysis. (*p < 0.05, **p < 0.01). See Table S2 for statistics and quantitative data.
Figure 7.
Figure 7.. Genetic KO of Raptor leads to loss of mTORC1 activity in Pten KO granule neurons
(A) Top panel shows representative images of immunolabeled granule neurons from Ptenflx/flx animals stained for phosphorylation of S6 (pS6), while bottom panel shows representative images of immunolabeled granule neurons from Ptenflx/flx Raptorflx/flx animals stained for pS6 (scale bar represents 20 μm). (B) The relative fluorescence intensity of pS6 was quantified as a readout of mTORC1 activity. Pten KO neurons showed an increase in normalized pS6 intensity, indicating increased mTORC1 activity. The increase in pS6 intensity was completely rescued in Pten and Raptor DKO neurons, indicating loss of mTORC1 activity. (C) Top panel shows representative images of immunolabeled granule neurons from Ptenflx/flx animals stained for phosphorylation of AKT threonine 308 (pT308), while bottom panel shows representative images of immunolabeled granule neurons from Ptenflx/flxRaptorflx/flx animals stained for pAKT T308 (scale bar represents 20 μm). (D) The relative fluorescence intensity of pAKT T308 was quantified as a readout of PDK1 activity. Pten KO neurons showed increased normalized pAKT T308 intensity compared with control, indicating greater PDK1 activity; however, Pten and Raptor DKO neurons demonstrated even greater pAKT T308 intensity, suggesting PDK1 activity was greater in the absence of both Pten and Raptor than solely Pten. (E) Top panel shows representative images of immunolabeled granule neurons from Ptenflx/flx animals stained for phosphorylation of AKT serine 473 (pS473), while bottom panel shows representative images of immunolabeled granule neurons from Ptenflx/flxRaptorflx/flx animals stained for pAKT S473 (scale bar represents 20 μm). (F) The relative fluorescence intensity of pAKT S473 was quantified as a readout of mTORC2 activity. Pten KO neurons demonstrated an increase in normalized pAKT S473 intensity compared with control, indicating elevated mTORC2 activity; however, Pten and Raptor DKO neurons showed an even greater increase in pAKT S473 intensity, suggesting mTORC2 activity was significantly higher in the absence of both Pten and Raptor than solely Pten. The mixed-effects model in STATA was performed to determine p value (*p < 0.05, **p < 0.01, ***p < 0.001, ****p < 0.0001). See Table S3 for statistics and quantitative data.

References

    1. Angliker N, and Ruegg MA (2013). In vivo evidence for mTORC2-mediated actin cytoskeleton rearrangement in neurons. BioArchitecture 3, 113–118. - PMC - PubMed
    1. Antion MD, Hou L, Wong H, Hoeffer CA, and Klann E (2008). mGluR-dependent long-term depression is associated with increased phosphorylation of S6 and synthesis of elongation factor 1A but remains expressed in S6K-deficient mice. Mol. Cell Biol 28, 2996–3007. - PMC - PubMed
    1. Cardamone M, Flanagan D, Mowat D, Kennedy SE, Chopra M, and Lawson JA (2014). Mammalian target of rapamycin inhibitors for intractable epilepsy and subependymal giant cell astrocytomas in tuberous sclerosis complex. J. Pediatr 164, 1195–1200. - PubMed
    1. Chen CJ, Sgritta M, Mays J, Zhou H, Lucero R, Park J, Wang IC, Park JH, Kaipparettu BA, Stoica L, et al. (2019). Therapeutic inhibition of mTORC2 rescues the behavioral and neurophysiological abnormalities associated with Pten-deficiency. Nat. Med 25, 1684–1690. - PMC - PubMed
    1. Chen Y, Huang WC, Séjourné J, Clipperton-Allen AE, and Page DT (2015). Pten mutations alter brain growth trajectory and allocation of cell types through elevated beta-catenin signaling. J. Neurosci 35, 10252–10267. - PMC - PubMed

Publication types

Substances