. 2022 Nov;10(11):e005091.
doi: 10.1136/jitc-2022-005091.

Both APRIL and antibody-fragment-based CAR T cells for myeloma induce BCMA downmodulation by trogocytosis and internalization

Affiliations

Both APRIL and antibody-fragment-based CAR T cells for myeloma induce BCMA downmodulation by trogocytosis and internalization

Nicolas Camviel et al. J Immunother Cancer. 2022 Nov.

Abstract

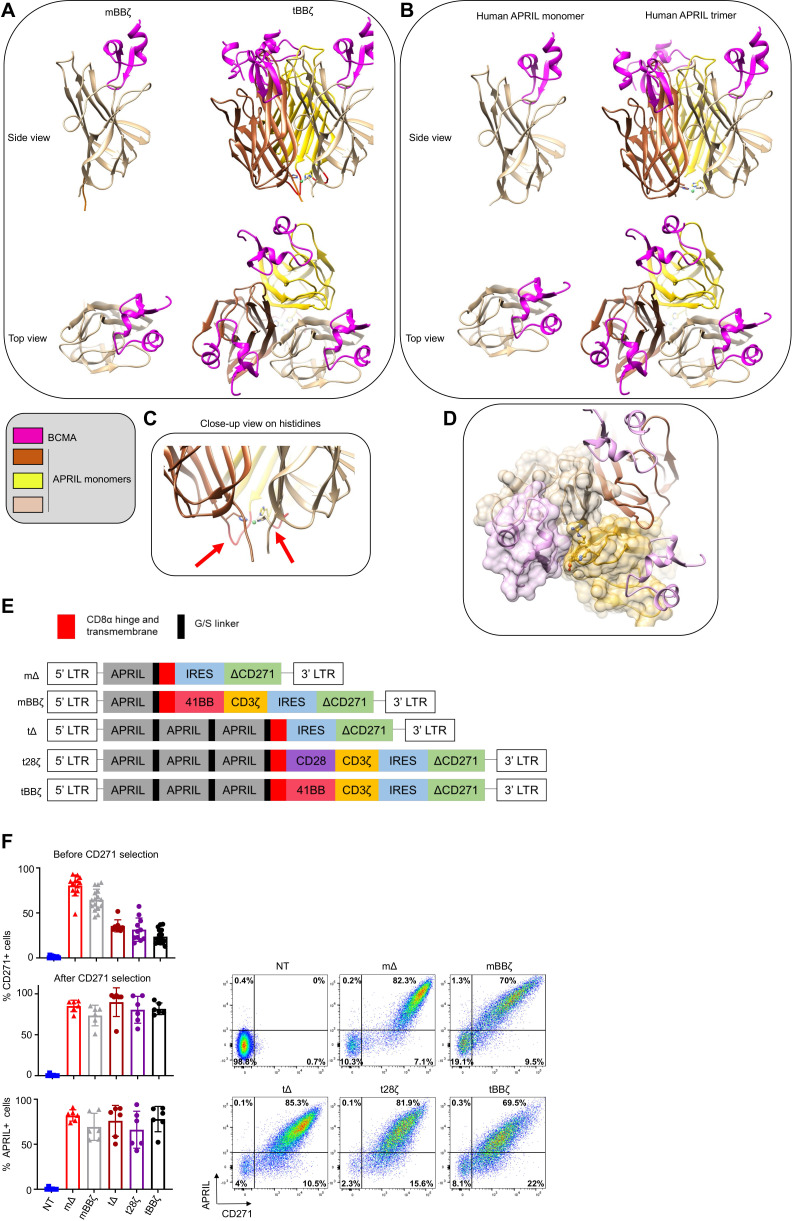
Background: Chimeric antigen receptor (CAR) T cell therapy targeting B cell maturation antigen (BCMA) on multiple myeloma (MM) produces fast but not long-lasting responses. Reasons for treatment failure are poorly understood. CARs simultaneously targeting two antigens may represent an alternative. Here, we (1) designed and characterized novel A proliferation inducing ligand (APRIL) based dual-antigen targeting CARs, and (2) investigated mechanisms of resistance to CAR T cells with three different BCMA-binding moieties (APRIL, single-chain-variable-fragment, heavy-chain-only).

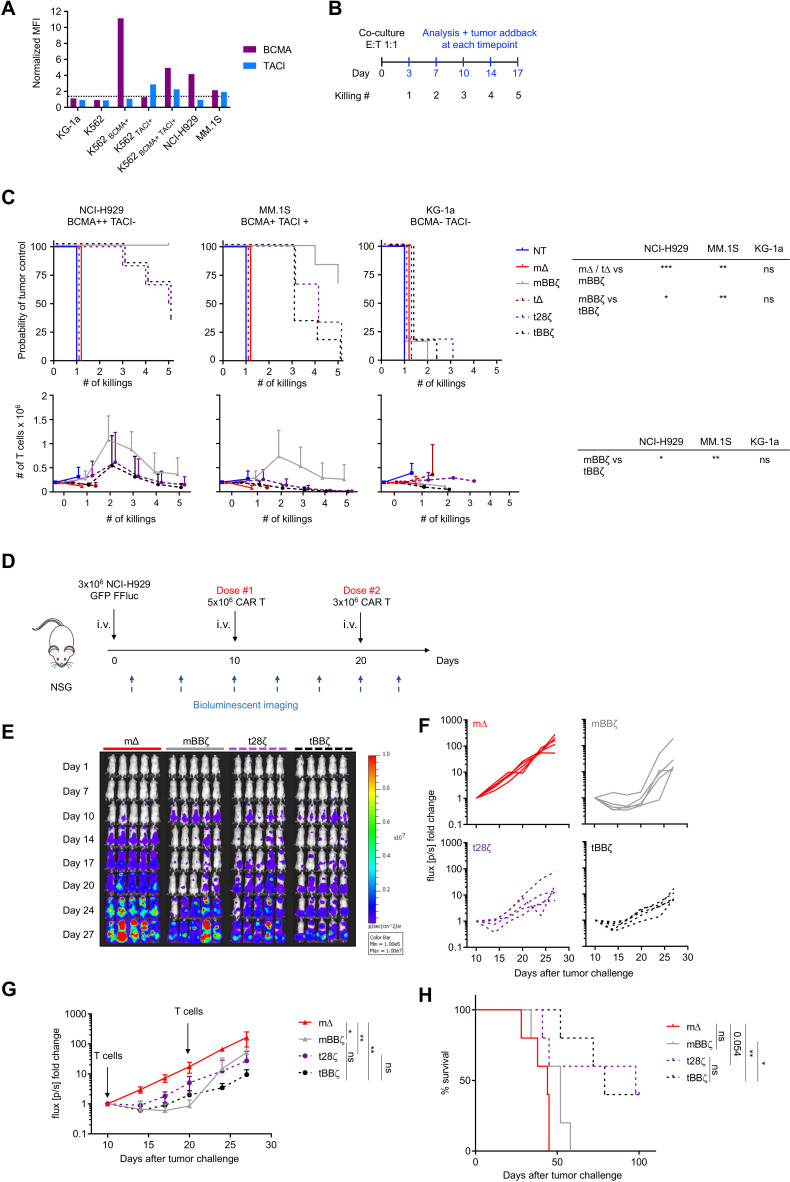
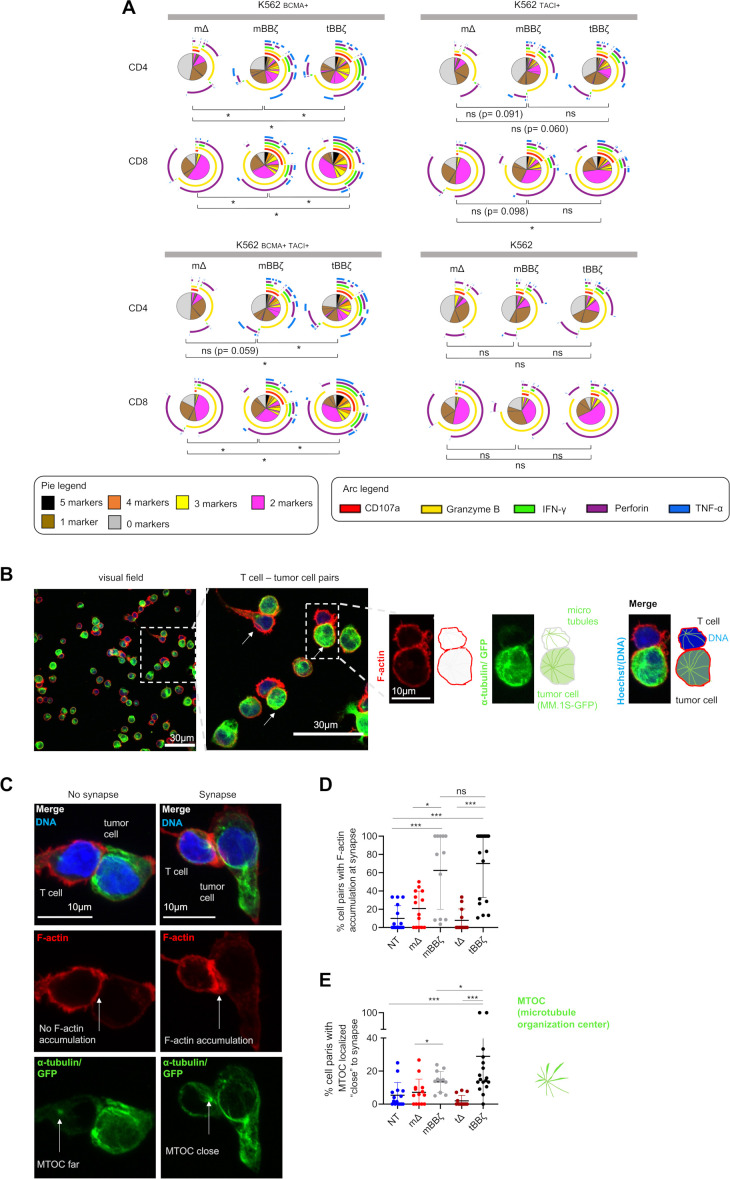
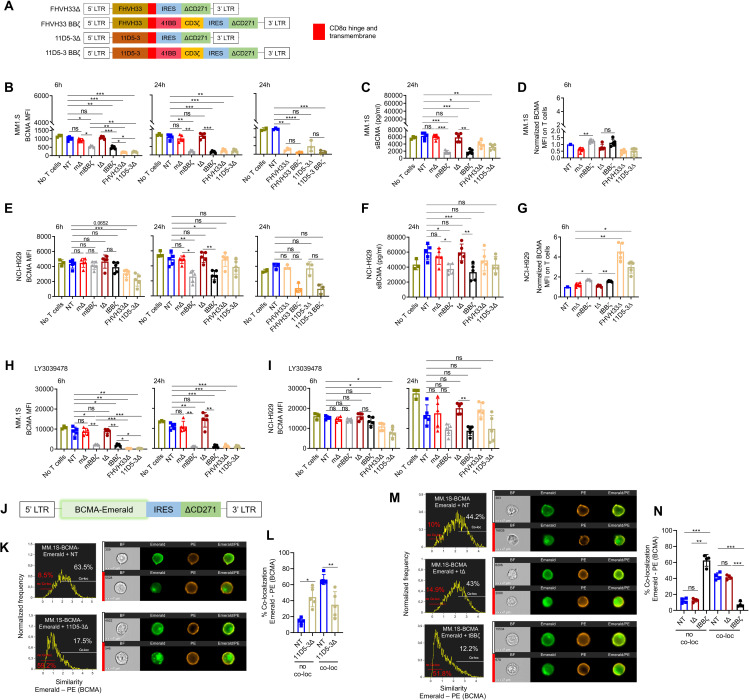
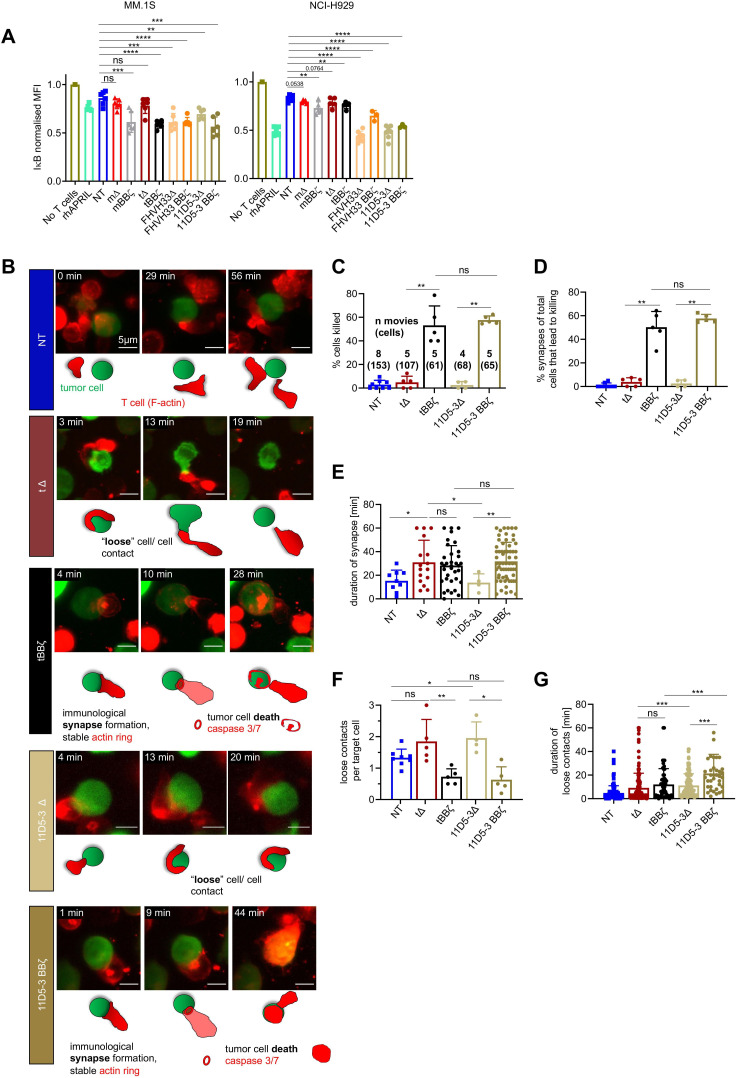
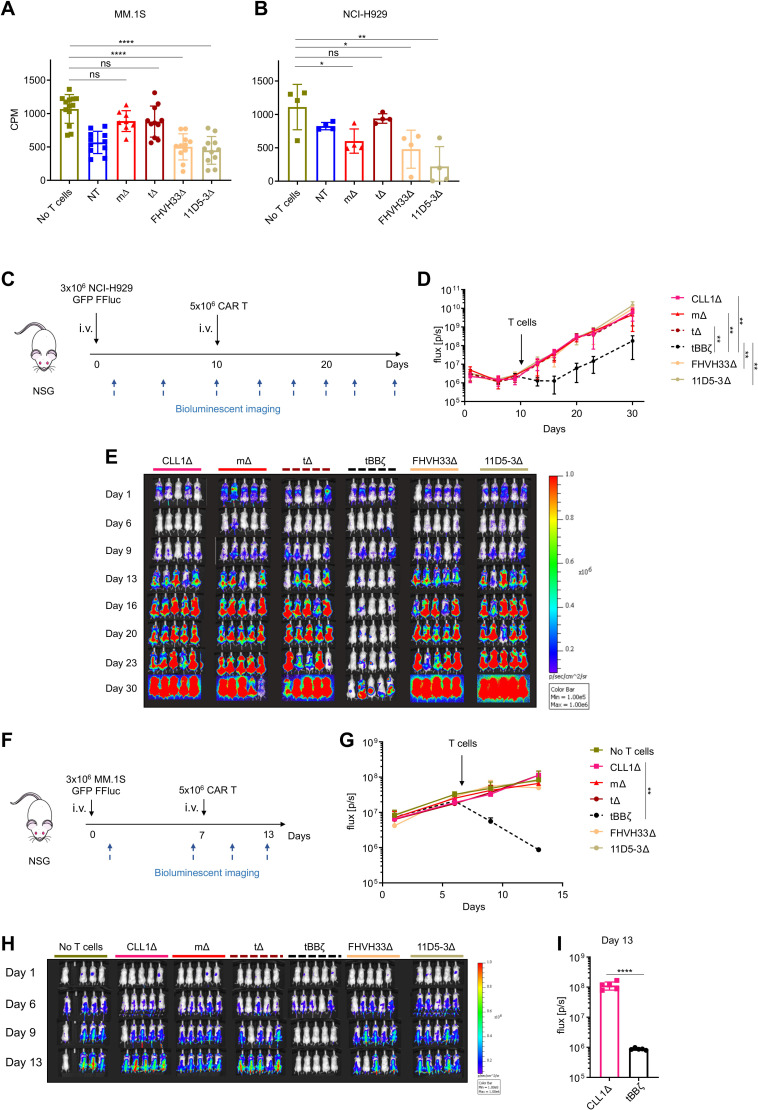
Methods: Three new APRIL-CARs were designed and characterized. Human APRIL-CAR T cells were evaluated for their cytotoxic function in vitro and in vivo, for their polyfunctionality, immune synapse formation, memory, exhaustion phenotype and tonic signaling activity. To investigate resistance mechanisms, we analyzed BCMA levels and cellular localization and quantified CAR T cell-target cell interactions by live microscopy. Impact on pathway activation and tumor cell proliferation was assessed in vitro and in vivo.

Results: APRIL-CAR T cells in a trimeric ligand binding conformation conferred fast but not sustained antitumor responses in vivo in mouse xenograft models. In vitro trimer-BBζ CAR T cells were more polyfunctional and formed stronger immune synapses than monomer-BBζ CAR T cells. After CAR T cell-myeloma cell contact, BCMA was rapidly downmodulated on target cells with all evaluated binding moieties. CAR T cells acquired BCMA by trogocytosis, and BCMA on MM cells was rapidly internalized. Since BCMA can be re-expressed during progression and persisting CAR T cells may not protect patients from relapse, we investigated whether non-functional CAR T cells play a role in tumor progression. While CAR T cell-MM cell interactions activated BCMA pathway, we did not find enhanced tumor growth in vitro or in vivo.

Conclusion: Antitumor responses with APRIL-CAR T cells were fast but not sustained. Rapid BCMA downmodulation occurred independently of whether an APRIL or antibody-based binding moiety was used. BCMA internalization mostly contributed to this effect, but trogocytosis by CAR T cells was also observed. Our study sheds light on the mechanisms underlying CAR T cell failure in MM when targeting BCMA and can inform the development of improved treatment strategies.

Keywords: T-lymphocytes; cell engineering; hematologic neoplasms; immunotherapy; receptors, chimeric antigen.


Conflict of interest statement

Competing interests: CA holds patents and provisional patent applications in the field of engineered T cell therapies and receives royalties from Immatics. VZ is a consultant for Cellestia Biotech. All other authors declare no competing financial interest.

Figures

Figure 1
Figure 1
Molecular design and expression of APRIL CARs on human T cells. (A–D) Computational models of monomeric (m) and trimeric (t) APRIL ligand binding domains in CAR format. (A) left: mBBζ CAR, right: tBBζ CAR, compared with (B) left: human soluble APRIL monomer, right: human soluble APRIL trimer, interacting with BCMA (pink). (C) Close-up view on histidine residues contributing to the trimer folding, red arrows point to G/S linkers of optimal length. (D) Interaction between the APRIL-trimer (each monomer is colored differently in tan, dark brown and goldenrod), and three copies of BCMA (light pink). The surface of one BCMA is shown in transparent pink that is mainly binding one APRIL monomer (surface colored in transparent tan), additional interactions occur with His203, Asp205, Arg206, Tyr208 and His241 residues (in ball and stick representation) of a second APRIL monomer (surface colored in transparent goldenrod). (E) CAR construct schemes: mΔ, mBBζ, tΔ, t28ζ, tBBζ expressed in the pSFG retroviral vector. (F) Left: Bar charts represent summary of transduction efficiencies of APRIL CARs in human T cells before or after CD271 selection, based on CD271 marker gene or APRIL cell surface staining (n=8–16 donors; mean±SD). Right: representative FACS plots from one donor, after CD271 selection. APRIL, a proliferation inducing ligand; BCMA, B cell maturation antigen; CARs, chimeric antigen receptor; FACS, fluorescence activated cell sorting.
Figure 2
Figure 2
In vitro and in vivo antitumor function of APRIL CAR T cells. (A) BCMA and TACI expression on cell lines relative to isotype control staining. (B) Scheme of rechallenge co-culture stress test, effector to target ratio E:T 1:1. (C) Kaplan-Meier curves in the top row depict probability of tumor control in the rechallenge co-culture stress test, n=6 donors, log-rank test (table top right). Line graphs show T cell expansion in co-cultures, n=6, mean±SD, unpaired t-test with Welch’s correction on AUC (table bottom right). (D) Scheme of the in vivo experimental timeline. 1 of 2 representative experiments shown, n=5 mice per group per experiment. (E) Tumor growth measured by BLI, individual mouse pictures (color scale min 1×10⁵, max 1×10⁷ p/s/cm2/sr). Dorsal view identifies tumor growth in the spine and skull. (F) Individual line graph of tumor growth for each mouse per group. BLI flux (p/s) normalized to signal intensity measured on day 10. (G) BLI flux summary n=5, mean±SD. Unpaired Mann-Whitney-U test (non-parametric t-test) on AUC. (H) Survival of mice as defined by humane end-point criteria. Log-rank test. (C, G, H) Definition of significance levels: ns=not significant, *p<0.05, **p<0.01, ***p<0.001. APRIL, a proliferation inducing ligand; AUC, area under the curve; CAR, chimeric antigen receptor; BLI, bioluminescent imaging.
Figure 3
Figure 3
Analysis of polyfunctionality and immune synapses of APRIL CAR T cells. (A) Polyfunctionality by intracellular cytokine staining. Pies depict all different combinations of populations expressing 5, 4, 3, 2, 1 or 0 markers, and arcs around pies indicate the analyte detected. Pies represent mean of n=6 donors. Dependent t-test for paired samples was used to compare populations of CAR T cells expressing at least three markers. (B–E) Fixed cell confocal microscopy for GFP (green, tumor cell), α-tubulin (green, showing the microtubule organizing center (MTOC), centrosome), F-actin (red) and DNA (blue, Hoechst). (B) Left panel: Representative confocal microscopy field of view showing NT T cells and MM.1S-GFP-FFLuc tumor cells, scale bar 30 µm. Middle panel: enlarged inset of left panel, arrows marking T cell - tumor cell pairs, scale bar 30 µm, Inset: enlarged view of one T cell (upper cell)–tumor cell (lower cell) pair, scale bar 10 µm. Scheme on the right explains the immunofluorescence. (C) Left column: representative confocal microscopy images for T cell–tumor cell pair without features of an immunological synapse. Right column: representative images with features of an immunological synapse. First row: Merged images. Second row: F-actin, left: no F-actin accumulation at the cell-cell interface, right: F-actin accumulation at the synapse. Third row: alpha-tubulin and GFP. Arrows are pointing toward the centrosome, the MTOC. Scale bars 10 µm. (D) Quantification of % cell pairs with F-actin accumulation at the cell–cell interface. Each data point corresponds to one field of view, mean±SD, Mann-Whitney-U test. (E) Quantification of % cell pairs with the centrosome close to the cell–cell interface. Each data point corresponds to one field of view, mean±SD, Mann-Whitney-U test. (A, D, E) Definition of significance levels: ns=not significant, *p<0.05, ***p<0.001. APRIL, a proliferation inducing ligand; CAR, chimeric antigen receptor; GFP, green fluorescent protein.
Figure 4
Figure 4
B cell maturation antigen (BCMA) downmodulation on MM cells by CAR T cell trogocytosis and BCMA internalization. (A) Schemes of FHVH33 and 11D5-3 CAR retroviral vector constructs. (B) BCMA cell surface levels on MM.1S cells co-cultured with CAR T cells (E:T 1:1) at indicated time points. (C) Soluble BCMA (sBCMA) levels in MM.1S co-culture supernatant (24 hours). (D) BCMA levels on CAR T cells co-cultured with MM.1S cells, normalized to NT (6 hours). (E) BCMA cell surface levels on NCI-H929 cells co-cultured with CAR T cells (E:T 1:1) at indicated time points. (F) sBCMA levels in NCI-H929 co-culture supernatant (24 hours). (G) BCMA levels on CAR T cells co-cultured with NCI-H929 cells, normalized to NT (6 hours). (H–I) Cell surface BCMA levels on MM cells co-cultured with CAR T cells (E:T 1:1) at indicated time points, in the presence of γ-secretase inhibitor, 0.1 µM Crenigacestat (LY3039478). n=5, mean±SD, one-way ANOVA with Tukey’s comparison. (J) Scheme of BCMA-Emerald retroviral vector with ΔCD271 as selectable marker. (K–N) MM.1S-BCMA-Emerald cells were co-cultured for 1 hour with NT or 11D5-3Δ CAR T cells (K–L) or with NT, tΔ or tBBζ CAR T cells (M–N). Co-localization of BCMA-Emerald and BCMA cell surface staining (PE) was analyzed by Image Stream. (K, M) Representative images and gating. (L, N) Summary graphs show percentage of no co-localization (no co-loc) or co-localization (co-loc) of BCMA-Emerald and cell surface BCMA (PE) in MM.1S-BCMA-Emerald cells. n=4–5, mean±SD, paired t-test. (B–I, L, N) Definition of significance levels: ns, not significant, *p<0.05, **p<0.01, ***p<0.001, ****p<0.0001. (B, D, E, G, H, I) BCMA cell surface levels were determined by FACS. (C, F) sBCMA levels were determined by ELISA. CAR, chimeric antigen receptor; NT, non-transduced; ANOVA, analysis of variance.
Figure 5
Figure 5
NFkB pathway activation in multiple myeloma (MM) cells after interaction with chimeric antigen receptor (CAR) T cells. (A) Normalized intracellular IκBα MFI in MM cells co-cultured with CAR T cells for 30 min. MM.1S cells (left, E:T 1:1), NCI-H929 cells (right, E:T 10:1). n=3–6 donors, mean±SD, unpaired t-test. (B–G) Light sheet live imaging of immunological synapse formation, target cell killing and loose T cell–tumor cell interactions. (B) Representative stills from light sheet time-lapse movies. NT (dark blue), tΔ (dark red), tBBζ (black), 11D5-3Δ (beige), and 11D5-3BBζ (dark beige) CAR T cells with MM.1S-GFP-FFLuc (green) target cells. T cell F-actin (SPY-actin live dye (red)), and cell death (biotracker caspase 3/7 stain, red). One image per minute for 60 min. Scale bar 5 µm. (C) Percentage target cell killing per 60 min movie, mean±SD. Numbers of movies and numbers of single cells (in parentheses) analyzed from n=3 independent donors and experiments. (D) Percentage of observed immunological synapses between T cells and target cells (appearance of an F-actin ring stable for >2 min leading to target cell death measured by Biotracker caspase 3/7 red signal), mean±SD. (E) Contact time between T cell and target cell at each synapse in minutes, mean±SD. (F) Quantification of loose contacts per target cell, mean±SD. (G) Contact time between T cell and target cell in minutes for loose contacts, mean±SD. (A, C–G) Definition of significance levels: ns=not significant, *p<0.05, **p<0.01, ***p<0.001, ****p<0.0001.
Figure 6
Figure 6
Non-functional B cell maturation antigen (BCMA)-directed CAR T cells do not promote tumor growth. (A, B) H3 thymidine incorporation assay on chimeric antigen receptor (CAR) T cell co-culture with (A) MM.1S cells at E:T ratio 1:1 or (B) NCI-H929 cells at E:T ratio 5:1. Background T cell H3 thymidine incorporation was subtracted. n=4–11 donors, colored symbols depict mean of technical triplicates, bars mean±SD, unpaired t-test. (C) Scheme of the NCI-H929 mouse xenograft model. 1 representative experiment of 2. n=5 mice per group per experiment. (D) BLI summary and quantification of total flux (p/s), mean±SD, unpaired Mann-Whitney-U test on area under the curve (AUC). (E) Tumor growth measured by BLI, individual mouse pictures (color scale min 1×10⁵, max 1×10⁶ p/s/cm2/sr). Dorsal view identifies tumor growth in the spine and skull. (F) Scheme of the MM.1S mouse xenograft model. 1 representative experiment of 2. n=4–5 mice per group per experiment. (G) BLI summary and quantification of total flux (p/s), mean±SD, unpaired Mann-Whitney-U test on AUC. (H) Tumor growth measured by BLI, individual mouse pictures (color scale min 1×10⁵, max 1×10⁶ p/s/cm2/sr). Dorsal view identifies tumor growth in the spine and skull. (I) Bar graph shows comparison of BLI signal intensity at day 13 between CLL1Δ and tBBζ CAR T cell treated mice. (A, B, D, G, I) Definition of significance levels: ns, not significant, *p<0.05, **p<0.01, ****p<0.0001. BLI, bioluminescent imaging.

References

    1. Mikkilineni L, Kochenderfer JN. CAR T cell therapies for patients with multiple myeloma. Nat Rev Clin Oncol 2021;18:71–84. 10.1038/s41571-020-0427-6 - DOI - PubMed
    1. van de Donk NWCJ, Usmani SZ, Yong K. CAR T-cell therapy for multiple myeloma: state of the art and prospects. Lancet Haematol 2021;8:e446–61. 10.1016/S2352-3026(21)00057-0 - DOI - PubMed
    1. Carpenter RO, Evbuomwan MO, Pittaluga S, et al. . B-cell maturation antigen is a promising target for adoptive T-cell therapy of multiple myeloma. Clin Cancer Res 2013;19:2048–60. 10.1158/1078-0432.CCR-12-2422 - DOI - PMC - PubMed
    1. O'Connor BP, Raman VS, Erickson LD, et al. . BCMA is essential for the survival of long-lived bone marrow plasma cells. J Exp Med 2004;199:91–8. 10.1084/jem.20031330 - DOI - PMC - PubMed
    1. Benson MJ, Dillon SR, Castigli E, et al. . Cutting edge: the dependence of plasma cells and independence of memory B cells on BAFF and APRIL. J Immunol 2008;180:3655–9. 10.4049/jimmunol.180.6.3655 - DOI - PubMed

Publication types