. 2022 Nov 2;13(1):6579.
doi: 10.1038/s41467-022-34000-6.

MYC promotes immune-suppression in triple-negative breast cancer via inhibition of interferon signaling

Affiliations

MYC promotes immune-suppression in triple-negative breast cancer via inhibition of interferon signaling

Dario Zimmerli et al. Nat Commun. .

Abstract

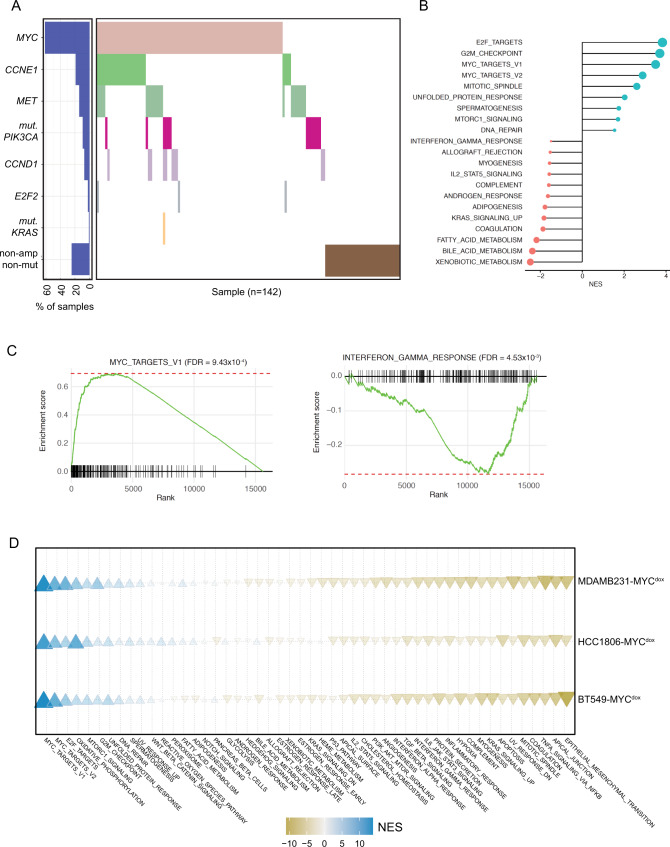
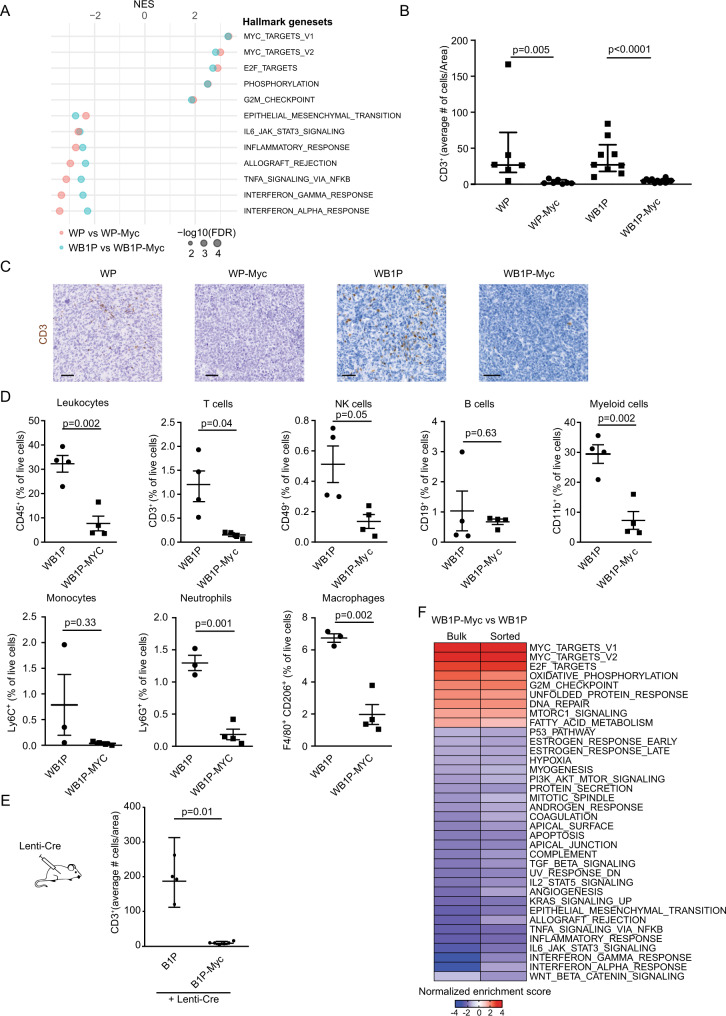
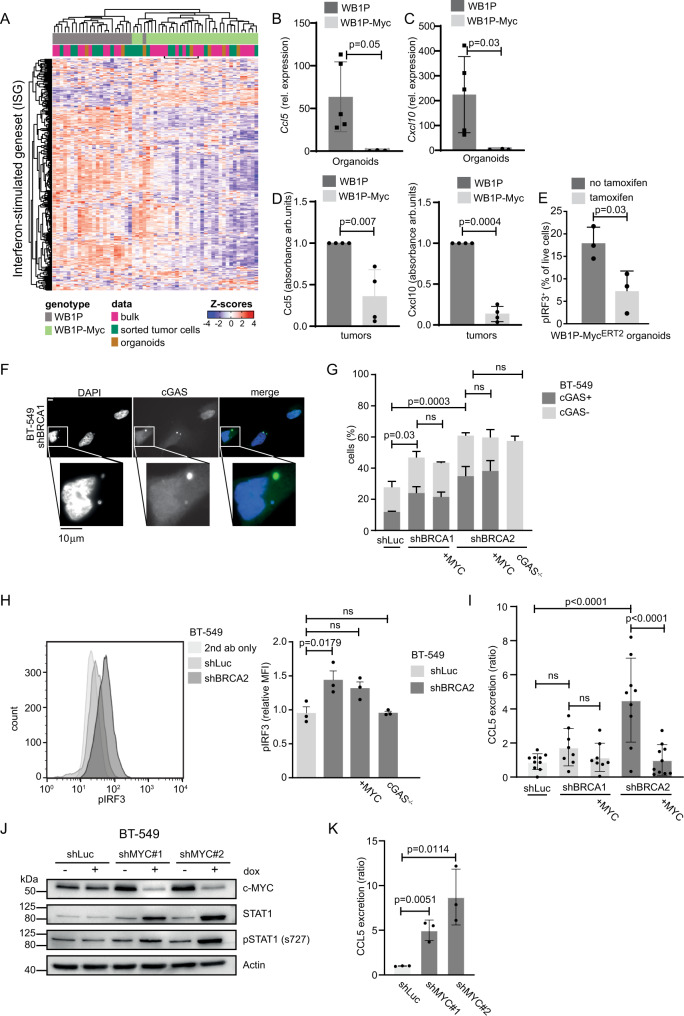
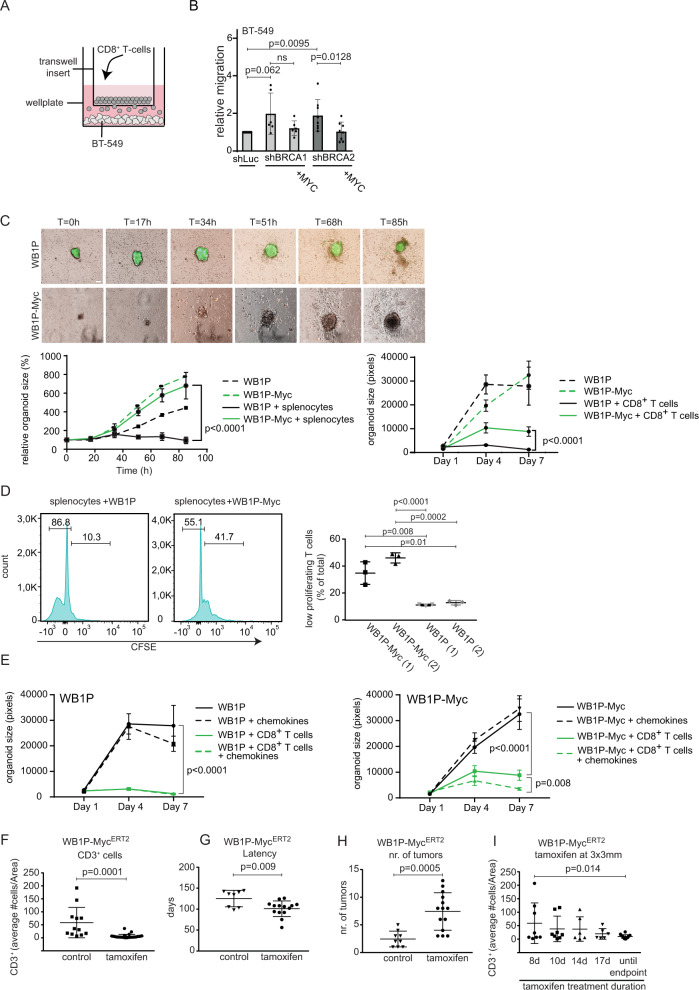
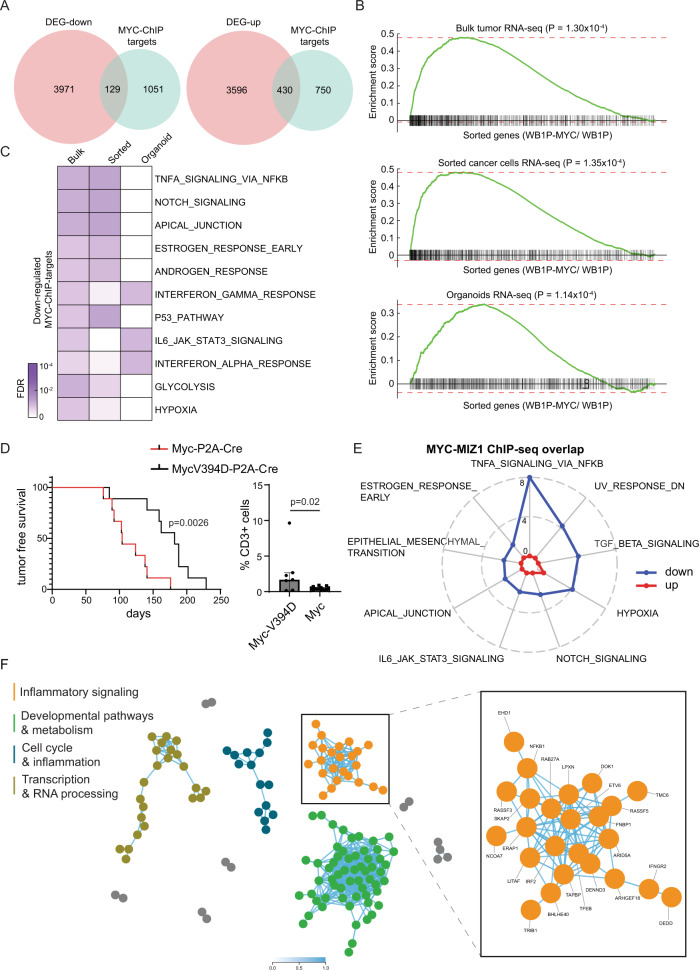
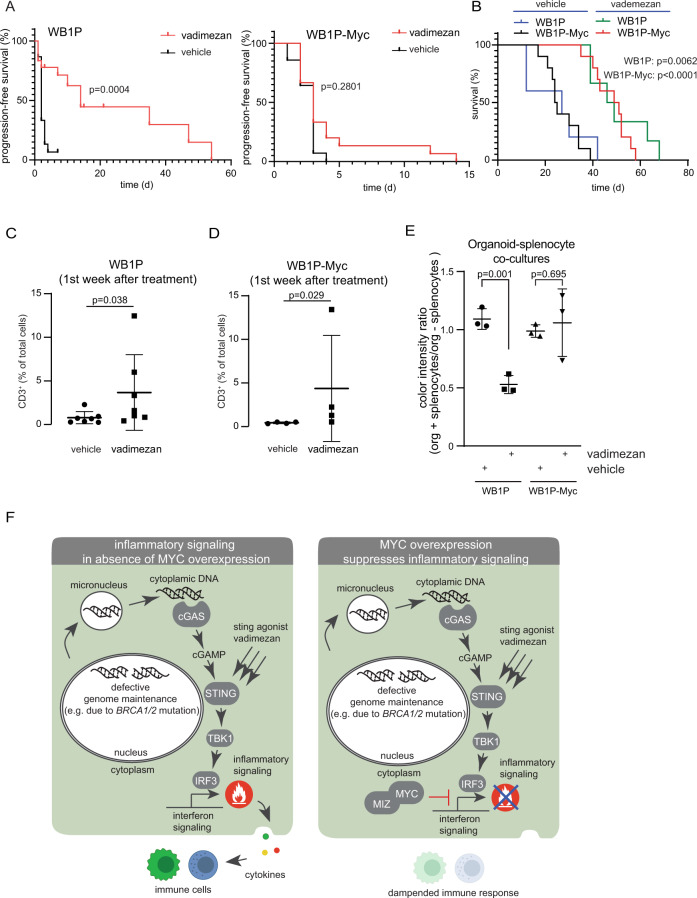
The limited efficacy of immune checkpoint inhibitor treatment in triple-negative breast cancer (TNBC) patients is attributed to sparse or unresponsive tumor-infiltrating lymphocytes, but the mechanisms that lead to a therapy resistant tumor immune microenvironment are incompletely known. Here we show a strong correlation between MYC expression and loss of immune signatures in human TNBC. In mouse models of TNBC proficient or deficient of breast cancer type 1 susceptibility gene (BRCA1), MYC overexpression dramatically decreases lymphocyte infiltration in tumors, along with immune signature remodelling. MYC-mediated suppression of inflammatory signalling induced by BRCA1/2 inactivation is confirmed in human TNBC cell lines. Moreover, MYC overexpression prevents the recruitment and activation of lymphocytes in both human and mouse TNBC co-culture models. Chromatin-immunoprecipitation-sequencing reveals that MYC, together with its co-repressor MIZ1, directly binds promoters of multiple interferon-signalling genes, resulting in their downregulation. MYC overexpression thus counters tumor growth inhibition by a Stimulator of Interferon Genes (STING) agonist via suppressing induction of interferon signalling. Together, our data reveal that MYC suppresses innate immunity and facilitates tumor immune escape, explaining the poor immunogenicity of MYC-overexpressing TNBCs.


Conflict of interest statement

K.E.d.V. receives research funding from Roche/Genentech and is consultant for Macomics, both outside the scope of this manuscript. The other authors declare no potential conflict of interest.

Figures

Fig. 1
Fig. 1. MYC expression is associated with downregulation of inflammatory pathways in human breast cancer.
A Distribution plot of TNBC samples used for GSEA analysis from TCGA data. In total, 142 samples were included in the analyses. Individual samples are plotted on the x-axis. B GSEA for the genes which are positively (cyan) or negatively (pink) correlated with expression of MYC in the TONIC trial dataset. The normalized enrichment scores (NES) for the significantly enriched gene sets (FDR < 0.05) are presented in the bar plot. MsigDB Hallmark gene sets were used for GSEA analysis. C GSEA plots for two significant gene sets, MYC_TARGETS_V1 and INTERFERON _GAMMA_RESPONSE. D GSEA of TNBC cell lines BT-549, MB-231 and HCC1806 overexpressing MYC in a doxycycline-inducible manner was performed. Depicted is a bubble plot of the enrichment of specific gene sets between the three tested cell lines upon MYC induction. Increased expression is depicted in blue, while repression is depicted in orange.
Fig. 2
Fig. 2. MYC-overexpressing mouse TNBCs display an immune-depleted microenvironment.
A MSigDB Hallmark gene sets significantly represented by WP vs WP-Myc (pink) and WB1P vs WB1P-Myc (cyan) tumors from GSEA analysis. The normalized enrichment scores (NES) for the significantly enriched gene sets (FDR < 0.05) are presented in the bar plot. B Quantification of CD3+ T cells in WP (n = 6), WP-Myc (n = 7), WB1P (n = 9) and WB1P-Myc (n = 12) tumors (unpaired 2-sided Mann-Whitney test, p = 0.005 for WP vs WP-Myc and p < 0.0001 for WB1P vs WB1P-Myc, mean with SD is plotted). C Representative immunostainings (of at least 5 tumors) for CD3+ T cells in WP, WP-Myc, WB1P and WB1P-Myc tumors. Scale bars = 50 µm. D FACS analysis of leukocytes (CD45+) (n = 4 animals/genotype, p = 0.002), T cells (CD3+) (n = 4 animals/genotype, p = 0.04), NK-cells (CD49b+) (n = 4 animals/genotype, p = 0.05), B-cells (CD19+) (n = 4 animals/genotype, p = 0.63), myeloid cells (CD11b+) (n = 4, p = 0.002), Monocytes (Ly6C+) (n = 3 (WB1P), n = 4 (WB1P-Myc), p = 0.33, Neutrophils (Ly6G+) (n = 3 (WB1P), n = 4 (WB1P-Myc), p = 0.001 and Macrophages (F4/80+, CD206+) (n = 3 (WB1P), n = 4 (WB1P-Myc), p = 0.002. WB1P-Myc tumors were compared to WB1P tumors (two tailed Student’s t-test as data were normally distributed, mean with SEM plotted). E Tumors generated by intraductal lenti-Cre injections in B1P (n = 4) and B1P-Myc (n = 5) mice are analyzed via immunohistochemistry for CD3 expression and quantified by counting positive cells/area. P value was calculated using 2 sided Mann-Whitney test, p = 0.01, mean with SD plotted. F Heatmap showing the gene sets represented by the comparison of WB1P-Myc versus WB1P tumors and sorted cancer cells from GSEA analysis. Normalized enrichment scores are plotted. Source data are provided as a Source Data file.
Fig. 3
Fig. 3. MYC overexpression in mammary tumor cells down-regulates IFN-stimulated genes.
A Heatmap depicting previously reported interferon-stimulated genes in RNA-seq of bulk tumors, sorted epithelial tumor cells and organoids. B qRT-PCR for Ccl5 in a WB1P (n = 5) and a WB1P-Myc (n = 3) derived mouse tumor organoid line. Relative gene expression levels normalized to RPM20 (unpaired two-tailed student’s t-test, p < 0.05, mean with SD plotted). C qRT-PCR analysis for Cxcl10 in a WB1P (n = 5) and a WB1P-Myc (n = 4) derived mouse tumor organoid line, relative gene expression levels normalized to RPM20 are plotted (unpaired two-tailed student’s t-test, p < 0.05, mean with SD plotted). D ELISA for CCL5 and CXCL10 from supernatant collected 48 h after seeding of equal numbers of dissociated organoids derived from WB1P and WB1P-Myc tumors (n = 3, absorbance in arbitrary units (arb. units), normalized to WB1P, unpaired two-tailed t-test, p < 0.05, mean with SD plotted). E Quantification of pIRF3 by FACS analysis of WB1P-MycERT2 organoids with and without tamoxifen treatment. (n = 3, unpaired two-tailed t-test, p < 0.05, mean with SD plotted). F Representative images of BT-549 cells harboring shBRCA2 and treated with doxycycline (dox) for three days. Cells were stained with anti-cGAS and DAPI. Scale bars =10 µm. G Quantification of cGAS-positive micronuclei as described in F. ≥ 100 Cells were counted per condition. Error bars indicate SEM of at least three independent experiments (one-way ANOVA, with Sidak’s multiple comparison test). H Left panel: BT-549 cells with indicated hairpins, were treated with doxycycline for 5 days. Levels of pIRF3 were analyzed by FACS. Right panel: Quantification of median fluorescence intensities (MFI) were normalized to cells without doxycycline. Error bars indicate SEM of 3 independent experiments (one-way ANOVA, with Sidak’s multiple comparison tests). I BT-549 cells with indicated hairpins, with overexpression of MYC or deletion of cGAS with or without doxycycline (dox) for 6 days. Secretion of CCL5 was measured with ELISA. Error bars indicate SEM of n = 8 (shBRCA1), n = 9 (shBRCA2) or n = 10 (shLuc, shBRCA2-MYC) independent experiments (one-way ANOVA, with Sidak’s multiple comparison tests). (J) BT-549 cells with indicated Luc or MYC shRNAs with or without doxycycline (dox) for 3 days. Immunoblotting was performed for c-MYC, STAT1 and pSTAT1. K BT-549 cells with MYC shRNAs with or without doxycycline (dox) for 5 days. Secretion of CCL5 was measured with ELISA. Concentrations were normalized to untreated conditions. Error bars indicate SEM of 3 independent experiments (unpaired two-tailed t-test). Source data are provided as a Source Data file.
Fig. 4
Fig. 4. MYC directly regulates lymphocyte trafficking and activation in vitro and in vivo.
A Schematic overview of the transwell assay. BT-549 cells were cultured for 5 days with doxycycline to induce expression of indicated shRNAs. Human CD8+ T cells were added for 24 h. T cells migrated towards the lower compartment were counted. B Transwell assays were performed as described in A. Migrated T cells were counted after 24 h. Data was normalized to shLUC values. Data of n = 6 (shBRCA) or n = 8 (shLuc/shBRCA2) independent experiments are shown (one-way ANOVA, with Sidak’s multiple comparison tests). C Live imaging of WB1P (green) and WB1P-Myc organoids (red) with splenocytes. Time after seeding in hours is indicated. Quantification of tumor organoid sizes is depicted in the lower left panel (scale = 100 µm) (n = 3, two-way ANOVA, p < 0.0001). The lower right panel shows in vitro co-culture of WB1P and WB1P-Myc organoids with CD8+ T cells. Organoid sizes were measured at day 1, 4 and 7 (n = 3, representative experiment shown, two-way ANOVA, p < 0.0001, mean with SD plotted). D FACS analysis of WB1P and WB1P-Myc organoid-splenocyte co-cultures stained for CSFE. Halving of fluorescence-intensity marks one cell division. Fluorescence-intensity per number of cells is plotted. Percentage of low proliferating T cells of 2 different organoid lines/condition is shown in the right panel. (unpaired two tailed t-tests, mean with SD plotted). E Co-cultures of WB1P (left) and WB1P-Myc (right) organoids with and without CD8+ T cells and chemokines (CXCL10 and CCL5). Organoid sizes were measured at day 1, 4 and 7 (two-way ANOVA, for WB1P+/− CD8+-T cells p < 0.0001; with versus without chemokines p = 0.794 (ns); for WB1P-MYC+/− CD8-T cells p < 0.0001; with versus without chemokines p = 0.0081, n = 3 organoid wells/genotype and condition, repeated 3 times independently, representative experiment shown, mean with SD plotted). F Counts/Area of CD3+ T cells of mammary tumors in the MycERT2 GEMM with (n = 34) and without tamoxifen chow (n = 12) until endpoint (tumor 15 mm x 15 mm) (unpaired two-tailed t-test, p = 0.0001, mean with SD plotted). G Tumor latency in WB1P-MycERT2 mice with (n = 14) and without tamoxifen chow (n = 8), (unpaired two-tailed student’s t-test, p = 0.009, mean with SD plotted). H Tumor burden in mice with (n = 14) and without tamoxifen (n = 9), (unpaired two-tailed student’s t-test, p = 0.0005, mean with SD plotted). I Counts/Area of CD3+ T cells of mammary tumors in the MycERT2 GEMM upon tamoxifen administration at 3 × 3 mm tumor-volume (unpaired two-tailed student’s t-test, Tamoxifen for 8 days (n = 8) versus until endpoint (n = 16), (unpaired two-tailed student’s t-test, p = 0.014, mean with SD plotted). Source data are provided as a Source Data file.
Fig. 5
Fig. 5. MYC controls expression of multiple IFN signaling components in tumors and organoids.
A Overlap between MYC target genes from ChIP-seq and differentially expressed genes (DEGs) comparing WB1P-Myc with WB1P. For this comparison, MYC targets were obtained from the common MYC-binding loci from tumor and organoid ChIP-seq data, and DEGs were obtained from the union of the genes showing differential expression between WB1P-Myc versus WB1P in bulk tumor, sorted tumor cells, and organoid RNA-seq data (see Methods). B GSEA analysis of MYC targets in each bulk tumor, sorted cancer cells, and organoid RNA-seq data comparing WB1P-Myc to WB1P. The genes closest to common MYC-binding loci between tumor and organoid ChIP-seq defined MYC targets. C Gene sets significantly over-represented by the down-regulated MYC targets from Fisher’s exact test (FDR < 0.1). The down-regulated MYC targets were defined by the genes in Fig. 5A (129 down-regulated MYC targets). D Left: Kaplan-Meyer curve of mammary tumor latency analysis of B1P mice injected with lenti-viruses encoding Cre-P2A-MYC-V394D and Cre-P2A-MYC (log rank (Mantel-Cox) test, n = 9 mice/genotype, p = 0.0026). Right: Immunohistochemistry was performed to analyze CD3+ T cell numbers using quPath software (unpaired two-tailed Kolmogorov-Smirnov test to check for differences in variability between groups, n = 7 (Myc-V394D) and 14 (wild-type Myc), p = 0.02, median with interquartile range plotted). E Spider plot of gene sets significantly over-represented by the downregulated MYC targets within the overlapping peaks of MYC and MIZ1 ChIP-seq in the promoter regions. The numbers on the lines of the plot indicate -log10(FDR). F Constructed co-functionality network of genes downregulated by MYC (n = 250) retrieved from both MYC-ChIP-seq and MIZ1 ChIP-seq of WB1P-Myc tumors as well as RNA-seq data of WB1P and WB1P-Myc tumors and organoids. Right: one of four identified clusters with strong shared predicted co-functionality (r > 0.5) shows enrichment for inflammatory pathways (e.g. innate immune system, Interferon signaling and cytokine signaling in immune system). Detailed lists of enriched pathways can be found in Supplementary Fig. S8E. Source data are provided as a Source Data file.
Fig. 6
Fig. 6. MYC suppresses anti-cancer efficacy of pharmacological STING activation in WB1P tumors.
A Kaplan-Meyer-curves of mice carrying WB1P tumors (left panel) or mice carrying WB1P-Myc tumors (right panel) and treated every 14 days for 6 weeks with vehicle or 25 mg/kg vadimezan i.p when tumors reached 100 mm3. Shown is the time of progression-free survival after treatment (n = 10, Log-rank (Mantel-Cox) test). B Kaplan-Meyer-curves of mice carrying WB1P tumors or WB1P-Myc tumors, treated as for A. Shown is the time of overall survival after treatment (n = 10, Log-rank (Mantel-Cox) test, p = 0.0062 for WB1P and p < 0.0001 for WB1P-Myc). C Analysis of CD3+ cell counts in vehicle and vadimezan treated WB1P tumors in the first week after treatment. Plotted are percentages of CD3+ cells/total cells as analyzed by quPath (n = 7, unpaired two tailed Mann-Whitney test, p < 0.05, mean with SD plotted). D Analysis of CD3+ cell counts in vehicle and vadimezan treated WB1P-Myc tumors in the first week after treatment. Plotted are percentages of CD3+ cells/total cells as analyzed by quPath. (n = 4, unpaired two tailed Mann-Whitney test, p < 0.05, mean with SD plotted). E Organoid-splenocyte co-cultures were checked for viability with an MTT-assay with and without vadimezan treatment (10ug/ml, 7 days culture, n = 3). Organoid viability as measured by color intensity from the MTT assay was used as read-out. Plotted is the ratio of color intensity of organoids cultured with splenocytes versus organoids without them, demonstrating that MYC expression protects organoids from splenocyte attack during vadimezan treatments (two tailed unpaired student’s t-test, p < 0.01, n = 3 independent replicates, average of 5 wells/condition/replicate is plotted as mean with SD). F Model illustrating how MYC directly suppresses STING/IFN signaling in tumor cells with genomic instability. While genomic instability enhances STING/IFN signaling, no immune response is mounted due to MYC-mediated repression of the downstream effectors, resulting in lack of immune cell recruitment. Source data are provided as a Source Data file.

References

    1. Bray F, et al. Global cancer statistics 2018: GLOBOCAN estimates of incidence and mortality worldwide for 36 cancers in 185 countries. Ca. Cancer J. Clin. 2018;68:394–424. - PubMed
    1. Koboldt DC, et al. Comprehensive molecular portraits of human breast tumours. Nature. 2012;490:61–70. - PMC - PubMed
    1. Dent R, et al. Triple-Negative Breast Cancer: Clinical Features and Patterns of Recurrence. Clin. Cancer Res. 2007;13:4429–4434. - PubMed
    1. Lehmann BD, et al. Refinement of Triple-Negative Breast Cancer Molecular Subtypes: Implications for Neoadjuvant Chemotherapy Selection. PLOS ONE. 2016;11:e0157368. - PMC - PubMed
    1. Gong J, Chehrazi-Raffle A, Reddi S, Salgia R. Development of PD-1 and PD-L1 inhibitors as a form of cancer immunotherapy: a comprehensive review of registration trials and future considerations. J. Immunother. Cancer. 2018;6:8. - PMC - PubMed

Publication types