. 2022 Nov 2;13(1):6566.
doi: 10.1038/s41467-022-34257-x.

Deep learning empowered volume delineation of whole-body organs-at-risk for accelerated radiotherapy

Affiliations

Deep learning empowered volume delineation of whole-body organs-at-risk for accelerated radiotherapy

Feng Shi et al. Nat Commun. .

Abstract

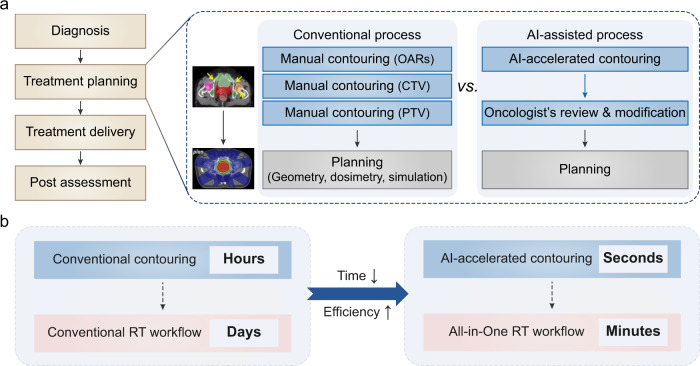
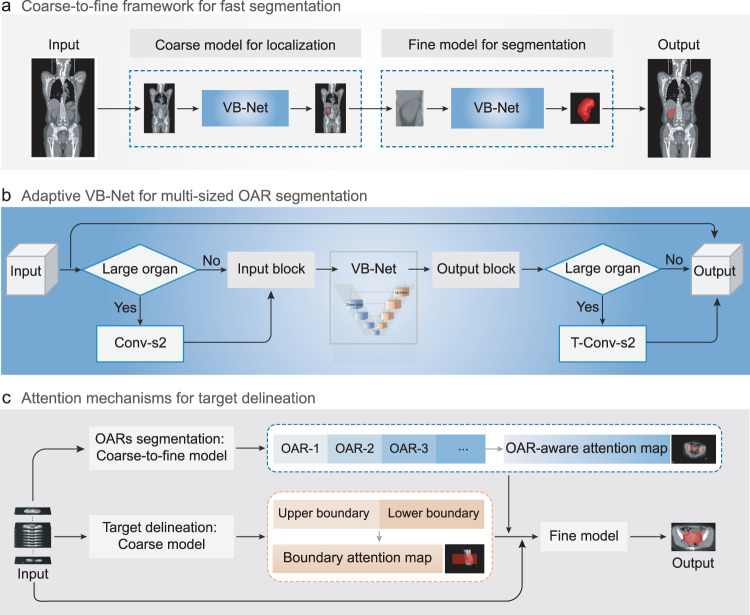
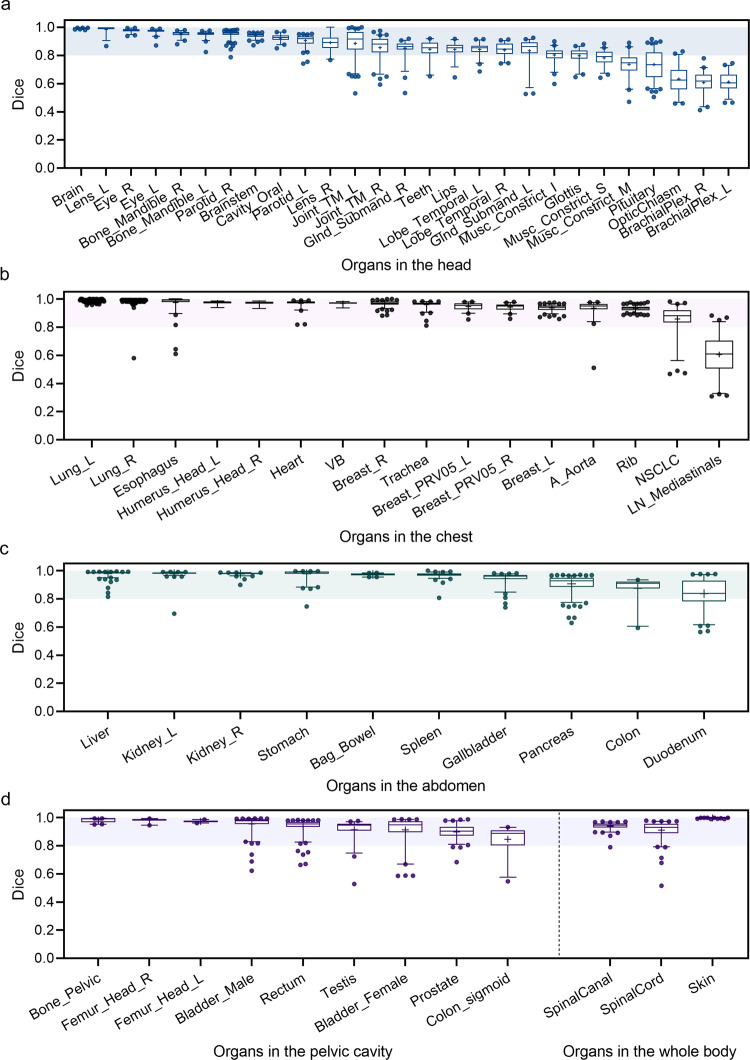
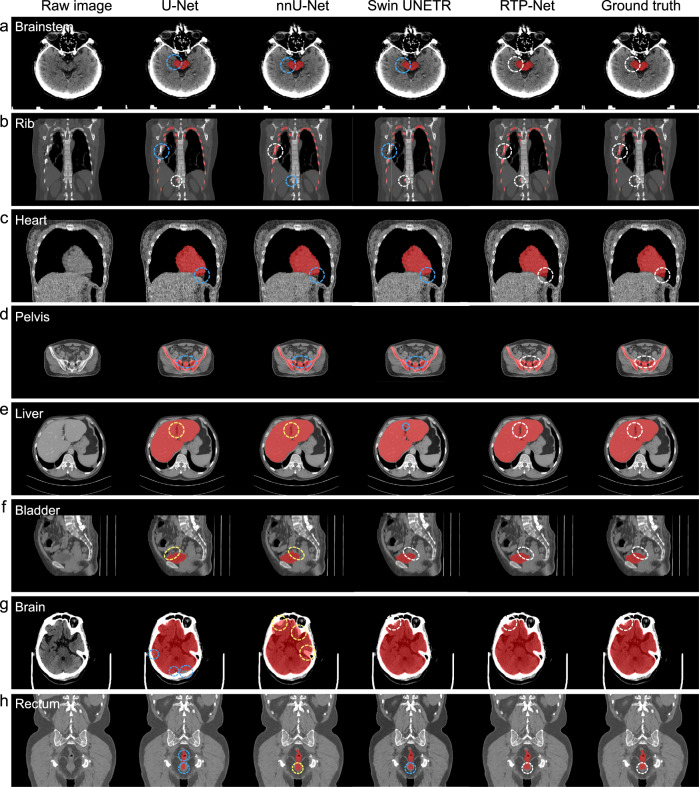
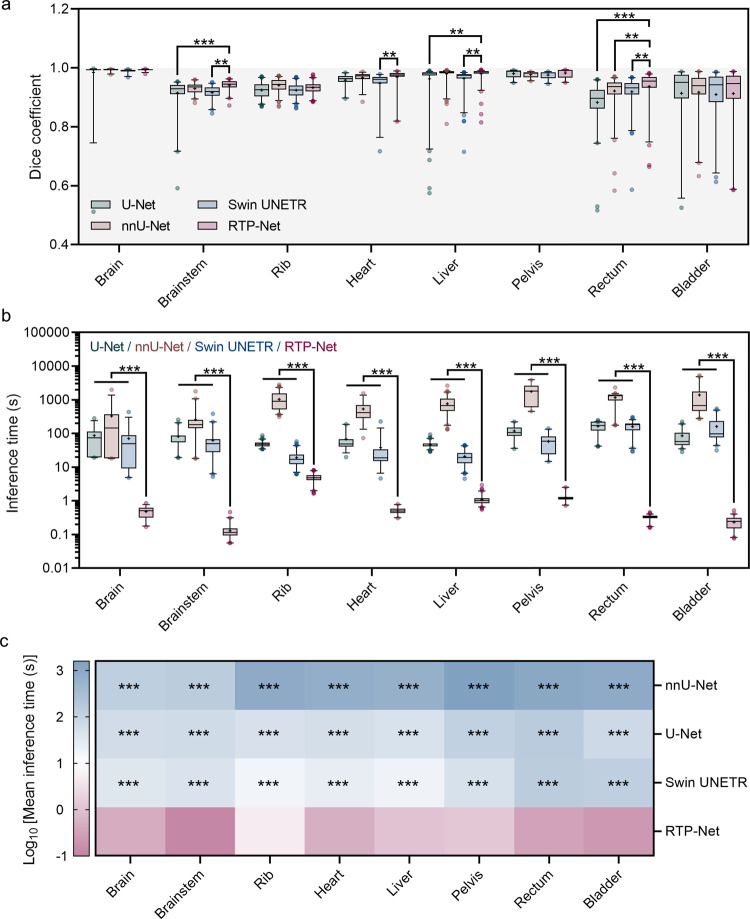
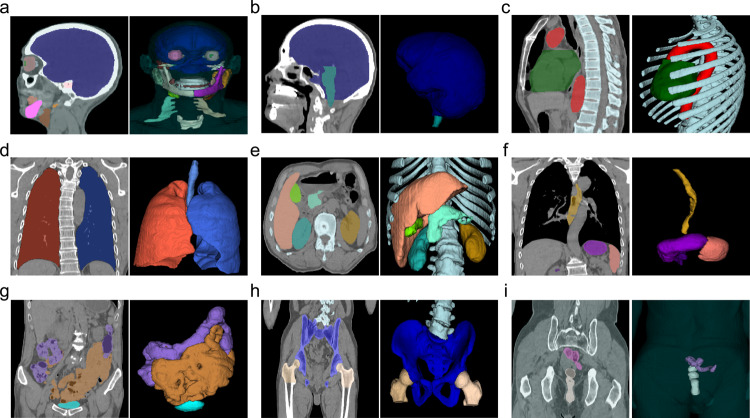
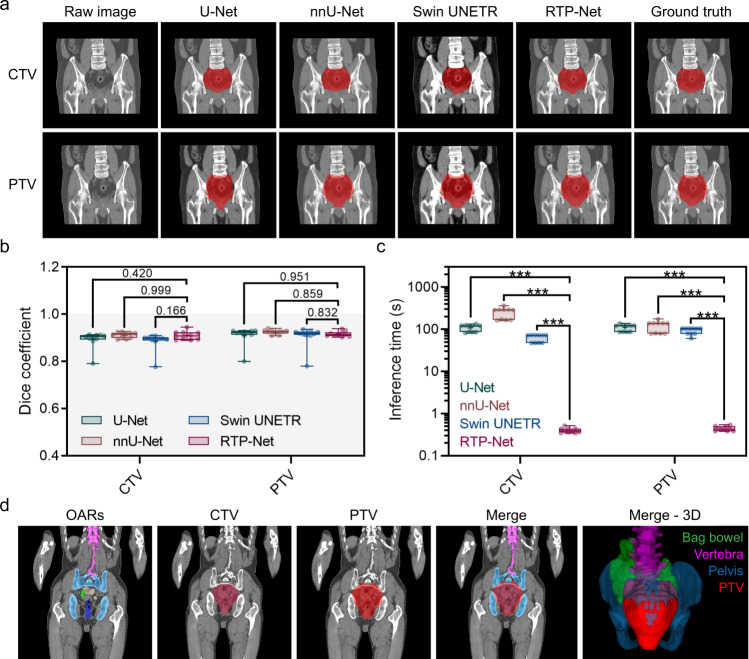
In radiotherapy for cancer patients, an indispensable process is to delineate organs-at-risk (OARs) and tumors. However, it is the most time-consuming step as manual delineation is always required from radiation oncologists. Herein, we propose a lightweight deep learning framework for radiotherapy treatment planning (RTP), named RTP-Net, to promote an automatic, rapid, and precise initialization of whole-body OARs and tumors. Briefly, the framework implements a cascade coarse-to-fine segmentation, with adaptive module for both small and large organs, and attention mechanisms for organs and boundaries. Our experiments show three merits: 1) Extensively evaluates on 67 delineation tasks on a large-scale dataset of 28,581 cases; 2) Demonstrates comparable or superior accuracy with an average Dice of 0.95; 3) Achieves near real-time delineation in most tasks with <2 s. This framework could be utilized to accelerate the contouring process in the All-in-One radiotherapy scheme, and thus greatly shorten the turnaround time of patients.


Conflict of interest statement

F.S., J.W., M.H., Q.Z., Y.W., Y.S., Y.C., Y.Y., X.C., Y.Z., X.S.Z., Y.G., and D.S. are employees of Shanghai United Imaging Intelligence Co., Ltd.; W.Z., and J.Z. are employees of Shanghai United Imaging Healthcare Co., Ltd. The companies have no role in designing and performing the surveillance and analyzing and interpreting the data. All other authors report no conflicts of interest relevant to this article.

Figures

Fig. 1
Fig. 1. Artificial intelligence (AI)-accelerated contouring promotes All-in-One radiotherapy (RT).
a The process overview of conventional RT vs. AI-accelerated All-in-One RT. The RT workflow can be divided into four steps, in which treatment planning step can be accelerated by AI. Conventional treatment planning includes manual contouring of organs-at-risk (OARs), clinical target volume (CTV), and planning target volume (PTV), followed by the planning procedures. The contouring step can be accelerated by AI algorithms, followed by an oncologist’s review with minimal required modification. b The time scales of contouring and RT workflow in the conventional RT and the AI-accelerated All-in-One RT, respectively. The contouring step can be accelerated by AI from hours to seconds, and the whole RT process can be shortened from days to minutes.
Fig. 2
Fig. 2. Schematic representations of RTP-Net for fast and accurate delineation of organs-at-risk (OARs) and tumors.
a Coarse-to-fine framework with multi-resolutions for fast segmentation. A coarse-resolution model is to localize the region of interest (ROI) in the original image (labeled in the red box), and a fine-resolution model is to refine the detailed boundaries of ROI. b Adaptive VB-Net for multi-sized OAR segmentation, which can be also applied to large organs. This is achieved by adding a stridden convolution layer with a stride of 2 (Conv-s2) and a transposed convolution layer with a stride of 2 (T-Conv-s2) to the beginning and the end of the VB-Net, respectively. c Attention mechanisms used in the segmentation framework for accurate target volume delineation. The OAR-aware attention map is generated by the fine-level OAR segmentation, and the boundary-aware attention map is generated by the coarse-level target volume bounding box. Two attention maps combined with multi-dimensional adaptive loss function are adopted to modify the fine-level model for obtaining accurate target delineation.
Fig. 3
Fig. 3. The segmentation performance of the RTP-Net on whole-body OARs.
The Dice coefficients in segmenting OARs in the head (a), chest (b), abdomen (c) parts, as well as those in the pelvic cavity part and whole body (d). The shadows in four box-and-whisker plots give the Dice coefficients with a range from 0.8 to 1.0. The first quartile forms the bottom and the third quartile forms the top of the box, in which the line and the plus sign represent the median and the mean values, respectively. The whiskers range from 2.5th to 97.5th percentile, and points below and above the whiskers are drawn as individual dots. The detailed number for each organ can be referred to Supplementary Fig. 1.
Fig. 4
Fig. 4. Visual comparison of segmentation performance of our proposed RTP-Net, U-Net, nnU-Net, and Swin UNETR.
Segmentation is performed on eight OARs, i.e., (a) brainstem, (b) rib, (c) heart, (d) pelvis, (e) liver, (f) bladder, (g) brain, and (h) rectum. The white circles denote accurate segmentation compared to manual ground truth by four methods. The blue and yellow circles represent under-segmentation and over-segmentation, respectively.
Fig. 5
Fig. 5. Quantitative comparison of segmentation performance of four methods in terms of Dice coefficient and inference time.
a Dice coefficients of eight segmentation tasks by our proposed RTP-Net, U-Net, nnU-Net, and Swin UNETR. b Mean inference times in segmenting eight OARs by four methods. Both Dice coefficients (a) and inference times (b) are shown in box-and-whisker plots. The first quartile forms the bottom and the third quartile forms the top of the box, in which the line and the plus sign represent the median and the mean values, respectively. The whiskers range from 2.5th to 97.5th percentile, and points below and above the whiskers are drawn as individual dots. The number of eight organs can be referred to Supplementary Fig. 1. Statistical analyses in (a) and (b) are performed using two-way ANOVA followed by Dunnett’s multiple comparisons tests. Asterisk represents two-tailed adjusted p value, with * indicating p < 0.05, ** indicating p < 0.01, and *** indicating p < 0.001. The p values of Dice coefficients in (a) between RTP-Net and other three methods (U-Net, nnU-Net, and Swin UNETR) are 0.596, 0.999, and 0.965 for brain segmentation, respectively; <0.001, 0.234, and 0.001 for brainstem segmentation, respectively; 0.206, 0.181, and 0.183 for rib segmentation, respectively; 0.367, 0.986, and 0.010 for heart segmentation, respectively; 0.002, 0.999, 0.003 for liver segmentation, respectively; 0.991, 0.900, and 0.803 for pelvic segmentation, respectively; <0.001, 0.010, and 0.003 for rectum segmentation, respectively; 0.999, 0.827, and 0.932 for bladder segmentation, respectively. All p values in (b) between RTP-Net and other three methods in eight organs are lower than 0.001. c The heat map of the mean inference times in multiple segmentation tasks. Asterisk represents two-tailed adjusted p value obtained in (b), with *** indicating p < 0.001, showing the statistical significance between RTP-Net and the other three methods.
Fig. 6
Fig. 6. Multiple organs-at-risk (OARs) segmentation results using the proposed RTP-Net.
a Brain, temporal lobe, eyes, teeth, parotid, mandible bone, larynx, brachial plexus; (b) brain, brainstem; (c) heart, trachea, rib, vertebra; (d) lungs; (e) liver, kidney, pancreas, gallbladder; (f) stomach, esophagus, spleen; (g) large bowel, small bowel, bladder; (h) femur head, bone pelvis; (i) testis, prostate. All samples are the CT images. In each sample, the left shows results in 2D view, and the right shows 3D rendering of segmented OARs.
Fig. 7
Fig. 7. The performance of target volume delineation by the proposed RTP-Net, compared with U-Net, nnU-Net, and Swin UNETR.
a Delineation results of the clinical target volume (CTV) and planning target volume (PTV) by the proposed RTP-Net, U-Net, nnU-Net, and Swin UNETR, labeled by red color. (b) Dice coefficients and (c) inference times of four methods in target volume delineation, shown in box-and-whisker plots. The first quartile forms the bottom and the third quartile forms the top of the box, in which the line and the plus sign represent the median and the mean values, respectively. The whiskers range from minimum to maximum showing all points. Statistical analyses in (b) and (c) are performed using two-way ANOVA followed by Dunnett’s multiple comparison tests, with n = 10 replicates per condition. The two-tailed adjusted p values of Dice coefficients in (b) between RTP-Net and other three methods (U-Net, nnU-Net, and Swin UNETR) are 0.420, 0.999, and 0.166 for CTV segmentation, respectively, while 0.951, 0.859, and 0.832 for PTV segmentation, respectively. All two-tailed adjusted p values of inference times in (c) between RTP-Net and other three methods are lower than 0.001, indicated with ***. (d) Overview of the organs-at-risk (OARs) and target volumes. The segmentation results of PTV and neighboring bag bowel, vertebra, and pelvis are marked in red, green, pink, and blue, respectively.

References

    1. Sung H, et al. Global cancer statistics 2020: Globocan estimates of incidence and mortality worldwide for 36 cancers in 185 countries. CA-Cancer J. Clin. 2021;71:209–249. - PubMed
    1. Siegel RL, Miller KD, Fuchs HE, Jemal A. Cancer statistics, 2021. CA-Cancer J. Clin. 2021;71:7–33. - PubMed
    1. Wei W, et al. Cancer registration in China and its role in cancer prevention and control. Lancet Oncol. 2020;21:e342–e349. - PubMed
    1. Atun R, et al. Expanding global access to radiotherapy. Lancet Oncol. 2015;16:1153–1186. - PubMed
    1. Delaney G, Jacob S, Featherstone C, Barton M. The role of radiotherapy in cancer treatment: Estimating optimal utilization from a review of evidence-based clinical guidelines. Cancer. 2005;104:1129–1137. - PubMed

Publication types