. 2022 Nov 2;13(1):6575.
doi: 10.1038/s41467-022-34251-3.

FOXA1 repression drives lineage plasticity and immune heterogeneity in bladder cancers with squamous differentiation

Affiliations

FOXA1 repression drives lineage plasticity and immune heterogeneity in bladder cancers with squamous differentiation

Joshua I Warrick et al. Nat Commun. .

Erratum in

  • Author Correction: FOXA1 repression drives lineage plasticity and immune heterogeneity in bladder cancers with squamous differentiation.
    Warrick JI, Hu W, Yamashita H, Walter V, Shuman L, Craig JM, Gellert LL, Castro MAA, Robertson AG, Kuo F, Ostrovnaya I, Sarungbam J, Chen YB, Gopalan A, Sirintrapun SJ, Fine SW, Tickoo SK, Kim K, Thomas J, Karan N, Gao SP, Clinton TN, Lenis AT, Chan TA, Chen Z, Rao M, Hollman TJ, Li Y, Socci ND, Chavan S, Viale A, Mohibullah N, Bochner BH, Pietzak EJ, Teo MY, Iyer G, Rosenberg JE, Bajorin DF, Kaag M, Merrill SB, Joshi M, Adam R, Taylor JA 3rd, Clark PE, Raman JD, Reuter VE, Chen Y, Funt SA, Solit DB, DeGraff DJ, Al-Ahmadie HA. Warrick JI, et al. Nat Commun. 2022 Dec 23;13(1):7920. doi: 10.1038/s41467-022-35644-0. Nat Commun. 2022. PMID: 36564410 Free PMC article. No abstract available.

Abstract

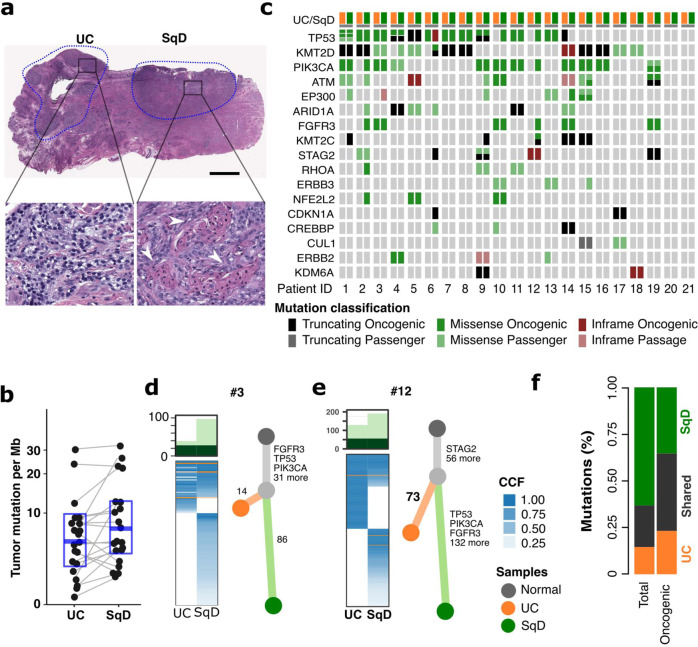
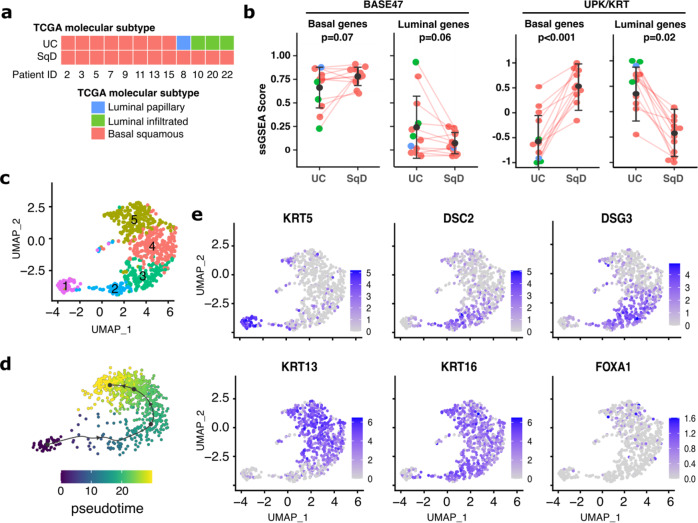
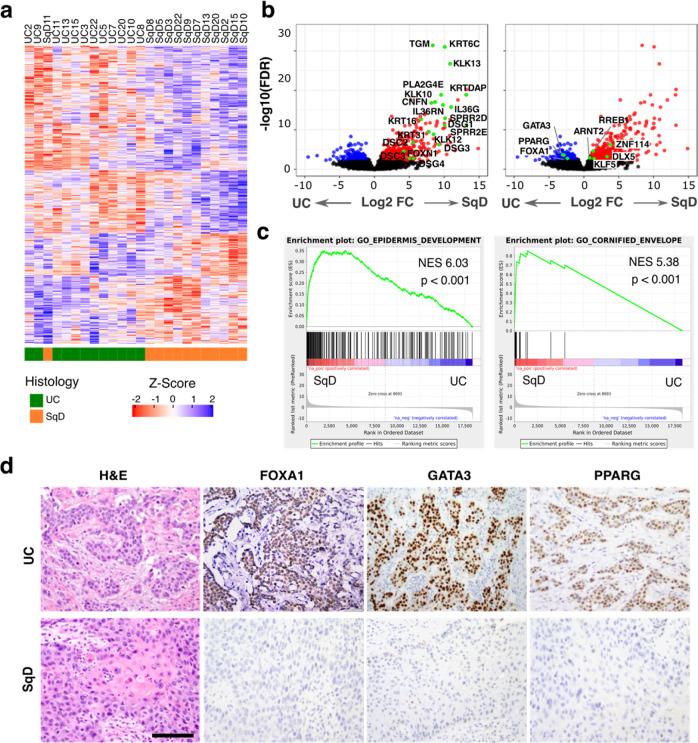
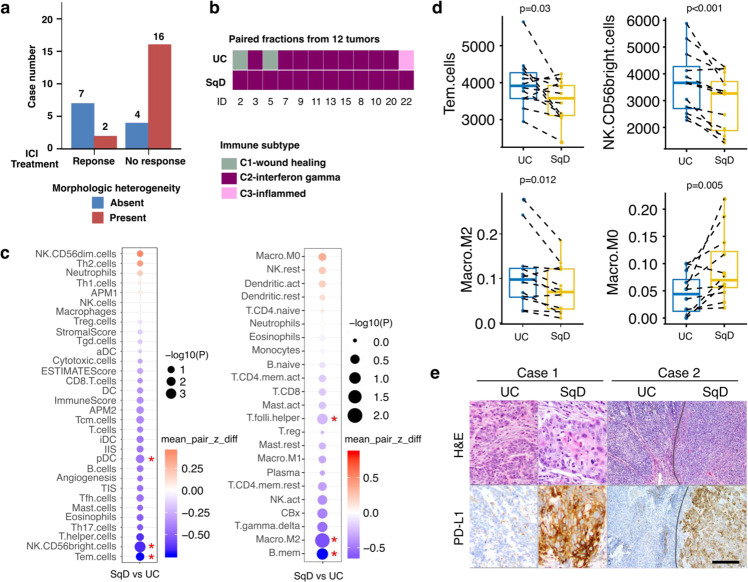
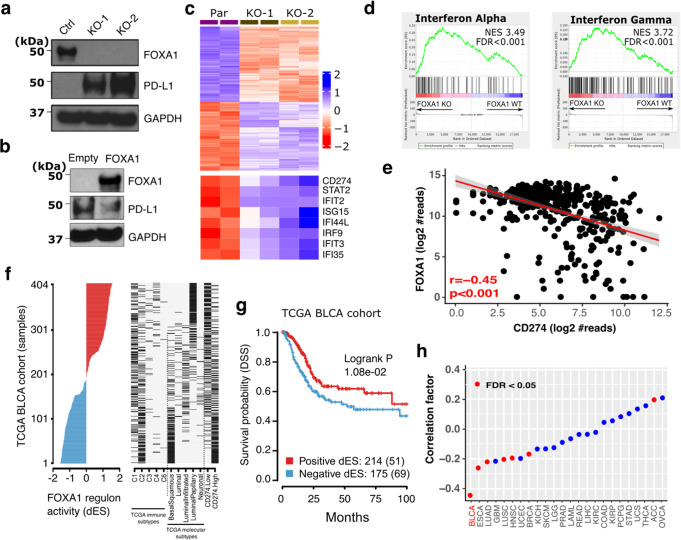
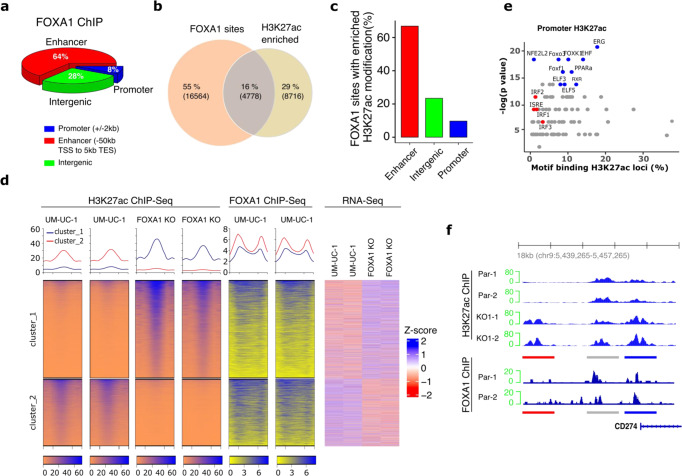
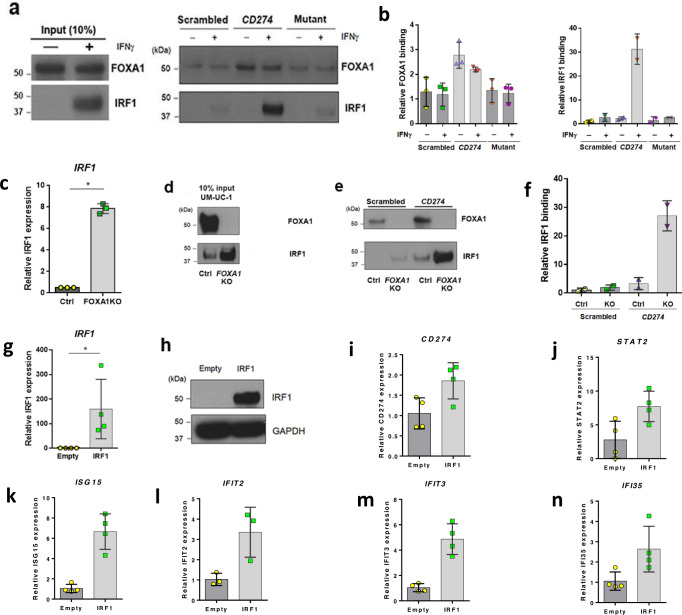
Cancers arising from the bladder urothelium often exhibit lineage plasticity with regions of urothelial carcinoma adjacent to or admixed with regions of divergent histomorphology, most commonly squamous differentiation. To define the biologic basis for and clinical significance of this morphologic heterogeneity, here we perform integrated genomic analyses of mixed histology bladder cancers with separable regions of urothelial and squamous differentiation. We find that squamous differentiation is a marker of intratumoral genomic and immunologic heterogeneity in patients with bladder cancer and a biomarker of intrinsic immunotherapy resistance. Phylogenetic analysis confirms that in all cases the urothelial and squamous regions are derived from a common shared precursor. Despite the presence of marked genomic heterogeneity between co-existent urothelial and squamous differentiated regions, no recurrent genomic alteration exclusive to the urothelial or squamous morphologies is identified. Rather, lineage plasticity in bladder cancers with squamous differentiation is associated with loss of expression of FOXA1, GATA3, and PPARG, transcription factors critical for maintenance of urothelial cell identity. Of clinical significance, lineage plasticity and PD-L1 expression is coordinately dysregulated via FOXA1, with patients exhibiting morphologic heterogeneity pre-treatment significantly less likely to respond to immune checkpoint inhibitors.


Conflict of interest statement

E.J.P. received honorarium from UpToDate, and received research funding from and is on the scientific advisory boards for Janssen Pharmaceuticals, Merck & Co. Inc., QED Therapeutics, UroGen Pharma and Steba Biotech. D.B.S. has consulted for/received honoraria from Pfizer, Loxo/Lilly Oncology, FORE Therapeutics, Vividion Therapeutics, Scorpion Therapeutics, Fog Pharma, and BridgeBio. D.J.D. received a research grant from Bristol-Myers-Squibb. H.A.A has consulted for Bristol-Myers-Squibb, AstraZeneca, Janssen Biotech, and Paige.ai. M.J. received research grant from AstraZeneca, Pfizer, and Eisai (drug only to Institution), and is on the advisory board for Seagen. J.S. is a consultant for Janssen Research & Development, LLC. S.A.F. received research support from AstraZeneca, Genentech/Roche, is a consultant/advisory board member for Merck and BioNTech, and owns stock/equity interest in Urogen, Allogene Therapeutics, Neogene Therapeutics, Kronos Bio, ByHeart, 76Bio, Vida Ventures, Inconovir, and Doximity. B.H.B is a consultant to Olympus corporation. D.F.B. reports personal fees from Bristol Myers Squibb and Merck; consulting/advisory role for Merck, Dragonfly Therapeutics, Fidia Farmaceutici S.p.A., and Bristol Myers Squibb Foundation; Travel/accommodations/expenses from Merck; and institutional research funding from Novartis, Merck, Bristol-Myers Squibb, AstraZeneca, Astellas Pharma, and Seattle Genetics/Astellas. Y.C. reports stock ownership in Oric Pharmaceuticals and sponsored Research from Foghorn Therapeutics. J.E.R is a Consultant for Seagen, Astellas, Bayer, AstraZeneca, QED Therapeutics, Merck, Genentech, Infinity, Gilead, Boehringer Ingelheim, Tyra, Mirati, Pfizer, EMD-Serono; reports sponsored research from Seagen, Astellas, Bayer, AstraZeneca, QED Therapeutics, Genentech; and received honoraria from Pfizer and EMD-Serono. The remaining authors declare no conflicts of interest.

Figures

Fig. 1
Fig. 1. Genomic analysis of urothelial carcinomas with squamous cell differentiation.
a Hematoxylin and Eosin (H&E) staining of a representative mixed histology bladder cancer with discrete and separable regions of urothelial carcinoma, NOS (UC), and squamous differentiation (SqD). In comparison to the urothelial component, the squamous regions were characterized by the presence of tumor cells with keratin formation (block arrow), a microscopic feature unequivocal for squamous differentiation. Scale bar = 2 mm. b Whole exome sequencing of macrodissected UC and SqD regions of 21 mixed histology bladder cancers revealed a significantly higher tumor mutational burden in the SqD versus UC regions (two-sided Wilcoxon paired test, p 0.02). c Oncoprint showing the mutation status of genes commonly mutated in bladder cancer. For each patient, the mutation status in the UC component is shown on the left, and the SqD component on the right. d, e Phylogenetic analysis of two representative urothelial carcinomas with squamous differentiation highlighting that the UC and SqD components were derived from a shared precursor. The number of non-synonymous mutations in each region is shown on top with shared mutations represented in dark green and mutations private to each component in light green. The cancer cell fraction (CCF) of individual mutations is indicated by the degree of blue shading. The UC (orange), SqD (green), and their hypothetical normal cell of origin (gray) are indicated by the different colors. f Average of concordant and discordant mutations between paired UC and SqD samples revealed higher concordance of oncogenic and likely oncogenic mutations (63.2%) versus all nonsynonymous mutations (33.9%).
Fig. 2
Fig. 2. SqD and UC regions of mixed histology tumors have distinct gene expression profiles.
a RNA sequencing analysis of 12 pairs of macrodissected UC and SqD regions from bladder tumors with mixed histology. Each region was classified using the TCGA molecular signature classification schema. All 12 SqD regions were basal/squamous subtype as were 8 of the 12 UC regions. Four tumors had discordant molecular subtypes. b Expression of BASE47 (left) and UPK/KRT (right) genes were evaluated by single sample GSEA analysis. Analysis was performed on 12 biologically independent UC-SqD pairs, Error bars represent standard error, p = 0.0005, two-sided paired Wilcoxon rank sum test. c Single-cell RNA-Seq analysis of a bladder carcinoma with extensive squamous differentiation revealed five clusters of tumor cells (clusters 1–5). d Trajectory analysis of these cell populations indicated a linear progression from cells resembling basal cells to those more similar to differentiated squamous cells. e Single-cell expression of select genes. Cluster 1 (61 cells) had an expression signature characteristic of the basal phenotype (high KRT5). Cluster 2 (64 cells) and Cluster 3 (152 cells) had expression signatures indicative of early squamous differentiation similar to that of suprabasal (spinous) cells (stratum spinosum), which are normally located immediately superficial to the basal cells of the epidermis (high DSC2, DSG2). Clusters 4 (231 cells) and 5 (220 cells) had a late squamous differentiation signature similar to that of granular squamous cells (stratum granulosum), which are normally located between the stratum spinosum and stratum corneum of the epidermis (high KRT13, KRT16).
Fig. 3
Fig. 3. SqD regions are characterized by loss of expression of the FOXA1, GATA3, and PPARG transcription factors.
a Differential gene expression analysis of RNAseq data from 12 biologically independent samples following macrodissection of paired UC and SqD regions revealed 718 significantly upregulated and 651 significantly downregulated genes in the SqD versus the UC regions (defined as log2 FoldChange >1 and FDR < 0.05). b Volcano plot of the same 12 UC-SqD pairs showing differentially expressed genes with log FoldChange on the x-axis and log p-value on the y-axis. Highlighted are genes associated with urothelial differentiation (left, blue color) or squamous differentiation during normal skin development (right, red color). c Gene Set Enrichment Analysis (GSEA) identified gene sets associated with epidermis development and the cornified envelope as the top gene sets upregulated in the SqD versus UC regions (two-sided paired Wilcoxon test). d Representative H&E and immunohistochemical stains showing loss of FOXA1, GATA3, and PPARɣ protein expression exclusive to the SqD regions of mixed histology tumors. Scale bar = 500 μm.
Fig. 4
Fig. 4. Distinct immune response gene signatures in paired UC and SqD samples.
a Morphologic heterogeneity was associated with a lack of clinical benefit in bladder cancer patients treated with the anti-PD-L1 antibody atezolizumab (n = 29) (p = 0.01, Fisher’s exact test). b RNAseq data was used to classify the UC and SqD components from the 12 UC-SqD pairs based on TCGA immune subtypes. c Immune cell deconvolution analysis was performed using single sample Gene Set Enrichment analysis (ssGSEA, left) or the CIBERSORTX algorithm (right). The size of the circles is reflective of the p-value and the red * indicates significantly enriched immune cells in either the SqD or UC fractions (two-sided Paired sample Wilcoxon test). d Immune cell deconvolution scores for individual UC-SqD paired regions were plotted for significantly enriched immune cell types identified by either ssGSEA or CIBERSORTX. Analyses were performed on 12 biologically independent samples following macrodissection of paired UC and SqD regions. All analyses used paired sample Wilcoxon test. The line in the center of box plot denotes the median. The lower and upper bounds of the box indicate 1st and 3rd quartiles, respectively. The whisker reaches to the maximum and minimum point within the 1.5x interquartile range. Data beyond the end of the whiskers are outliers. e PD-L1 immunohistochemical analysis (clone SP263) of two representative tumors showing significantly higher PD-L1 expression in the SqD region versus the adjacent UC region (p = 0.02, Wilcoxon rank sum test, also Supplementary Table 1) of mixed histology tumors. Scale bar = 1 mm. Additional microscopic images from Case 2 taken at higher magnifications are included in Supplementary Fig. 13.
Fig. 5
Fig. 5. Genetic ablation of FOXA1 in bladder cancer cells results in increased expression of PD-L1 and interferon sensitive genes (ISGs).
a CRISPR-Cas9 gene editing was used to generate isogenic UM-UC-1 bladder cancer cells with loss of FOXA1 expression. Immunoblot analysis showing that loss of FOXA1 expression was associated with increased PD-L1 expression. This analysis was performed in triplicate. Source data are provided as a Source Data file. b UM-UC-3 cells were transfected with FOXA1 or with empty vector. Immunoblot analysis was then performed to quantitate expression of FOXA1, PD-L1, and GAPDH as a loading control. This analysis was performed in triplicate. c Differential gene expression (FDR q < 0.05) in parental and FOXA1-KO UM-UC-1 bladder cancer cells. Loss of FOXA1 expression was associated with upregulation of 1358 genes including CD274 (PD-L1) and other interferon response genes, and downregulation of 2187 genes. d Gene set enrichment analysis (GSEA) identified the interferon alpha and gamma pathways as the top two gene sets altered following FOXA1 knockout in UM-UC-1 bladder cancer cells. e FOXA1 mRNA expression was significantly negatively correlated with CD274 (which encodes PD-L1) mRNA expression in the TCGA bladder cancer cohort (two-sided Spearman correlation). f FOXA1 regulon activity profiles for 404 samples in the TCGA BLCA cohort sorted by FOXA1 regulon activity (left), molecular subtypes and CD274 gene expression (right). g Kaplan-Meier plot of the bladder TCGA cohort showed that disease-specific survival (DSS) was significantly associated with positive vs. negative FOXA1 regulon activity status (Log-rank p-value = 0.01). Numbers indicate patients in each group and, in curved parentheses, deceased patients. h Correlation between FOXA1 and CD274 mRNA expression across 24 cancer types from the TCGA analysis showed that the most significant inverse association between these genes was observed in bladder cancer.
Fig. 6
Fig. 6. FOXA1 knockout was associated with widespread enhancer and promoter epigenetic reprogramming in bladder cancer cells.
a ChIP-Seq was performed in duplicates using chromatin extracted from UM-UC-1 parental and UM-UC-1 FOXA-1-KO cells. 21,766 FOXA1 binding sites were identified in the ChIP-Seq data by MACS2 (FDR < 0.001). Genomic regions where FOXA-1 binding sites were located were then annotated as promoter (2 kb+/− transcriptional start site—TSS), enhancer (between −50 kb from TSS and 5 kb after transcriptional end site—TES), or intergenic (other sites). b Integrated ChIP-Seq analysis of FOXA1 binding sites and H3K27ac revealed 14971 differentially modified H3K27ac loci enriched in either parental UM-UC-1 cells or those with FOXA1 KO (55% were unique FOXA1 binding, 29% were histone H3K27ac enriched sites, and 16% overlapping sites, defined as within 5 kb), c The majority of the overlapping sites were in enhancer regions with fewer sites in the intergenic or promoter regions. d Cluster analysis of the H3K27ac-modified enhancer regions enriched in either the parental UM-UC-1 cells or the isogenic FOXA1-KO cells (left), FOXA1 binding coverage around the same region (middle), and the expression of genes associated with these sites (right). The number of clusters was defined by kmean (k = 2) in H3K27ac enriched peaks. All analyses were performed in duplicate. e Known motif scanning of the sites enriched with H3K27ac modification in the gene promoter regions identified the top 10 significantly enriched motifs (blue dots) and motifs of interferon-regulatory factors (IRF) or interferon-sensitive response element (ISRE) (red dots). f Increased acetylation of CD274 gene regulatory elements including an upstream enhancer (red line region) and the proximal promoter region (blue line) in FOXA1-KO versus parental UM-UC-1 cells (top). For reference, unchanged peaks are shown (grey line). FOXA1 binding sites were also identified in the promoter region of CD274 gene by ChIP-Seq (bottom).
Fig. 7
Fig. 7. FOXA1 KO increases expression of IRF1 and enhances IRF1 binding to the CD274 promoter.
Western blotting (a) and quantification (b) following DNA affinity purification for FOXA1 (n = 3) and IRF1 (n = 2) in parental UM-UC-1 treated in the presence and absence of IFNɣ. In the absence of IFNɣ, FOXA1 exhibits significantly greater binding to the wild-type CD274 probe relative to scrambled negative control DNA probe (Student’s t-test; p = 0.0319) or mutant (Student’s t-test; p = 0.0256) CD274 probes. In the presence of IFNɣ, FOXA1 still showed significantly greater binding to wild-type CD274 promoter relative to scrambled DNA probe (Student’s t-test; p = 0.0319) and FOXA1-binding mutant (Student’s t-test; p = 0.0256) CD274 probes. There were no significant differences in FOXA1 binding relative to IFNɣ treatment. Following IFNɣ treatment, IRF1 shows increases in binding to wild-type CD274 relative to scrambled and mutant probes. Q-RT-PCR data are expressed as the mean ± S.D. from independent experiments of FOXA1 (n = 3), IRF1 (n = 2), respectively. Source data are provided as a Source Data file (c) and western blotting (d) shows that FOXA1 KO in UM-UC-1 results in significant increases in IRF1 expression at the mRNA and protein levels, respectively. Data of Q-RT-PCR are expressed as the mean ± S.D. from independent experiments (n = 3). Source data are provided as a Source Data file. Western blotting (e) and quantification (f) following DNA affinity purification for FOXA1 and IRF1 in parental UM-UC-1 (Ctrl) and FOXA1 KO UM-UC-1 (FOXA1 KO) cell lines. IRF1 purified from FOXA1 KO UM-UC-1 exhibited a 26-fold increase in binding to the CD274 promoter fragment relative to parental UM-U-C1. IRF1 was unable to be purified from parental and FOXA1 KO UM-UC-1 cells with scrambled negative control oligo (n = 2). Ectopic expression of IRF1 in parental UM-UC-1 cells followed by Q-RT-PCR (n = 4). Data are expressed as the mean ± S.D. from independent experiments (g) and western blotting (h). Source data are provided as a Source Data file. Overexpression of IRF1 significantly increased expression of i CD274 (n = 4, Student’s t-test; p = 0.0344), j STAT2 (n = 4, Student’s t-test p = 0.0321), k ISG15 (n = 4, Student’s t-test p = 0.0008), l IFIT2 (n = 3 Student’s t-test; p = 0.0338), m IFIT3 (n = 4, Student’s t-test; p = 0.0009) and n IFI35 (n = 4, Student’s t-test; p = 0.0406). Data are expressed as the mean ± S.D. from independent experiments. *p < 0.05 was considered as a statistically significant. ns not significant. All tests are unpaired two-sided Student’s t-test.

References

    1. Loehrer PJ, Sr., et al. A randomized comparison of cisplatin alone or in combination with methotrexate, vinblastine, and doxorubicin in patients with metastatic urothelial carcinoma: a cooperative group study. J. Clin. Oncol. 1992;10:1066–1073. doi: 10.1200/JCO.1992.10.7.1066. - DOI - PubMed
    1. von der Maase H, et al. Long-term survival results of a randomized trial comparing gemcitabine plus cisplatin, with methotrexate, vinblastine, doxorubicin, plus cisplatin in patients with bladder cancer. J. Clin. Oncol. 2005;23:4602–4608. doi: 10.1200/JCO.2005.07.757. - DOI - PubMed
    1. De Santis M, et al. Randomized phase II/III trial assessing gemcitabine/carboplatin and methotrexate/carboplatin/vinblastine in patients with advanced urothelial cancer who are unfit for cisplatin-based chemotherapy: EORTC study 30986. J. Clin. Oncol. 2012;30:191–199. doi: 10.1200/JCO.2011.37.3571. - DOI - PMC - PubMed
    1. Rosenberg JE, et al. Atezolizumab in patients with locally advanced and metastatic urothelial carcinoma who have progressed following treatment with platinum-based chemotherapy: a single-arm, multicentre, phase 2 trial. Lancet. 2016;387:1909–1920. doi: 10.1016/S0140-6736(16)00561-4. - DOI - PMC - PubMed
    1. Zibelman M, Ramamurthy C, Plimack ER. Emerging role of immunotherapy in urothelial carcinoma-Advanced disease. Urol. Oncol. 2016;34:538–547. doi: 10.1016/j.urolonc.2016.10.017. - DOI - PubMed

Publication types

MeSH terms

Substances