. 2022 Nov 2;13(1):6543.
doi: 10.1038/s41467-022-33624-y.

Cholinergic basal forebrain degeneration due to sleep-disordered breathing exacerbates pathology in a mouse model of Alzheimer's disease

Affiliations

Cholinergic basal forebrain degeneration due to sleep-disordered breathing exacerbates pathology in a mouse model of Alzheimer's disease

Lei Qian et al. Nat Commun. .

Abstract

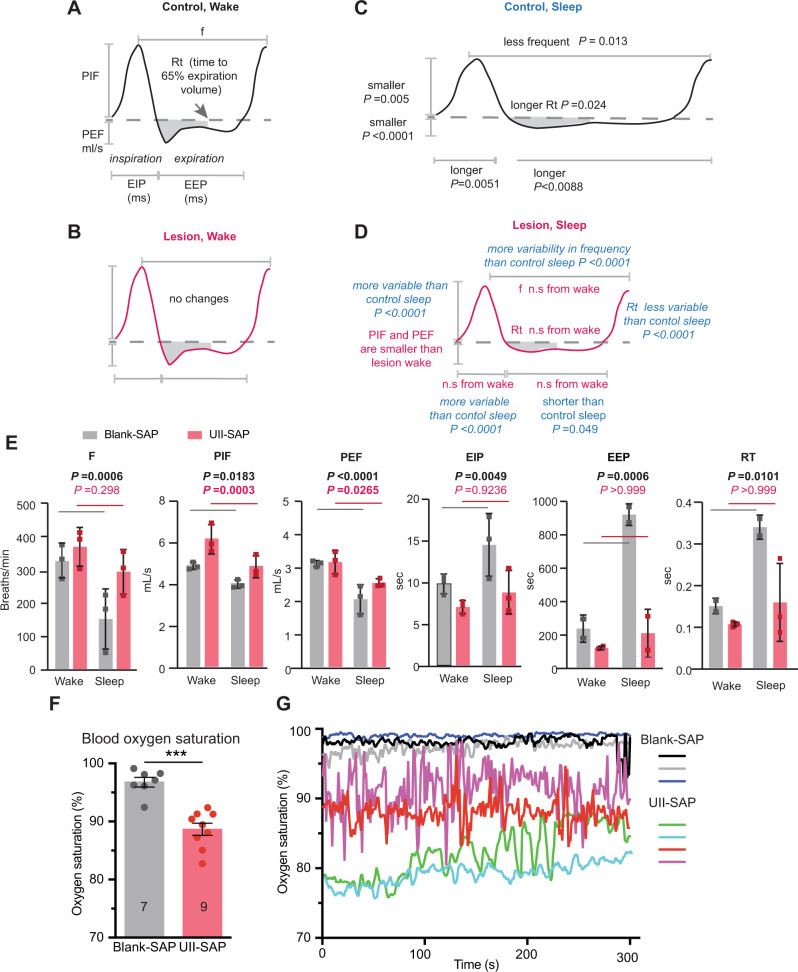
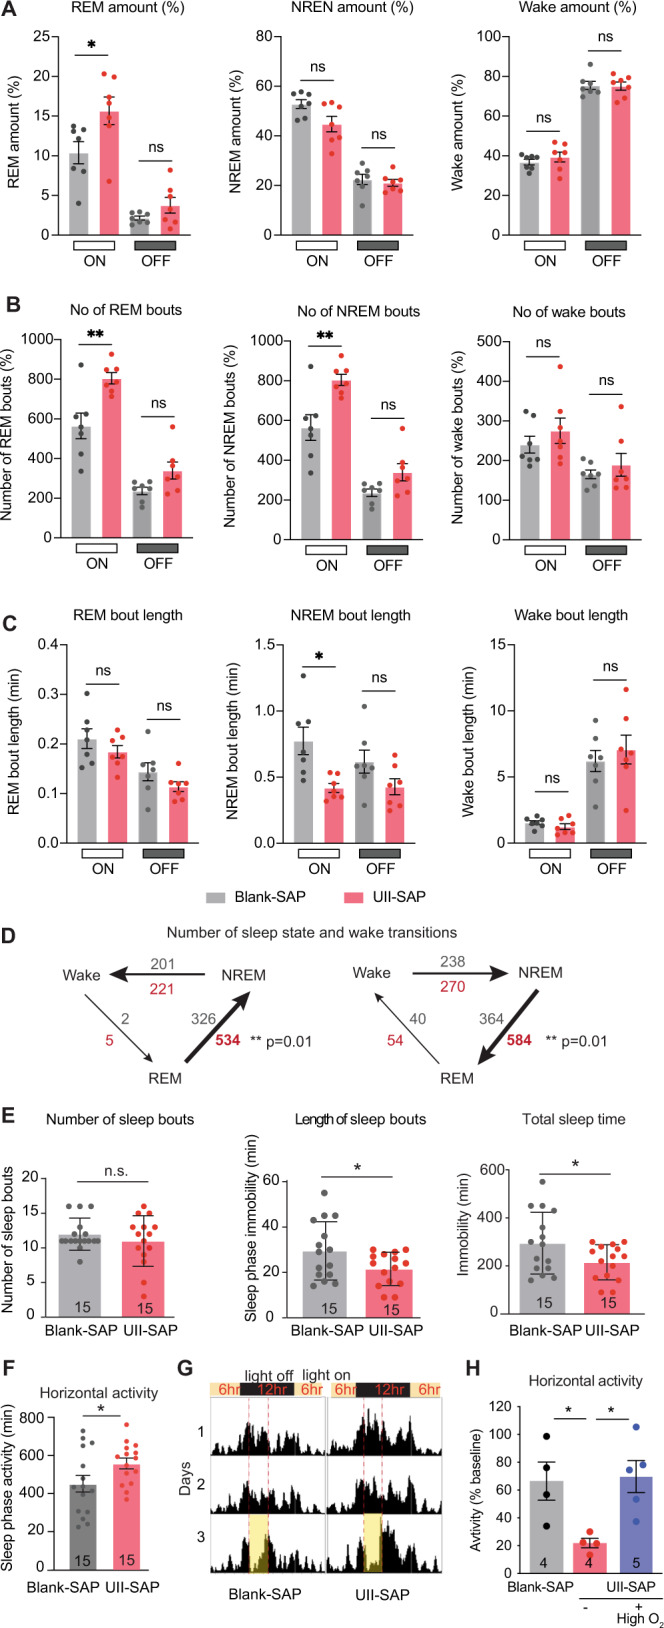
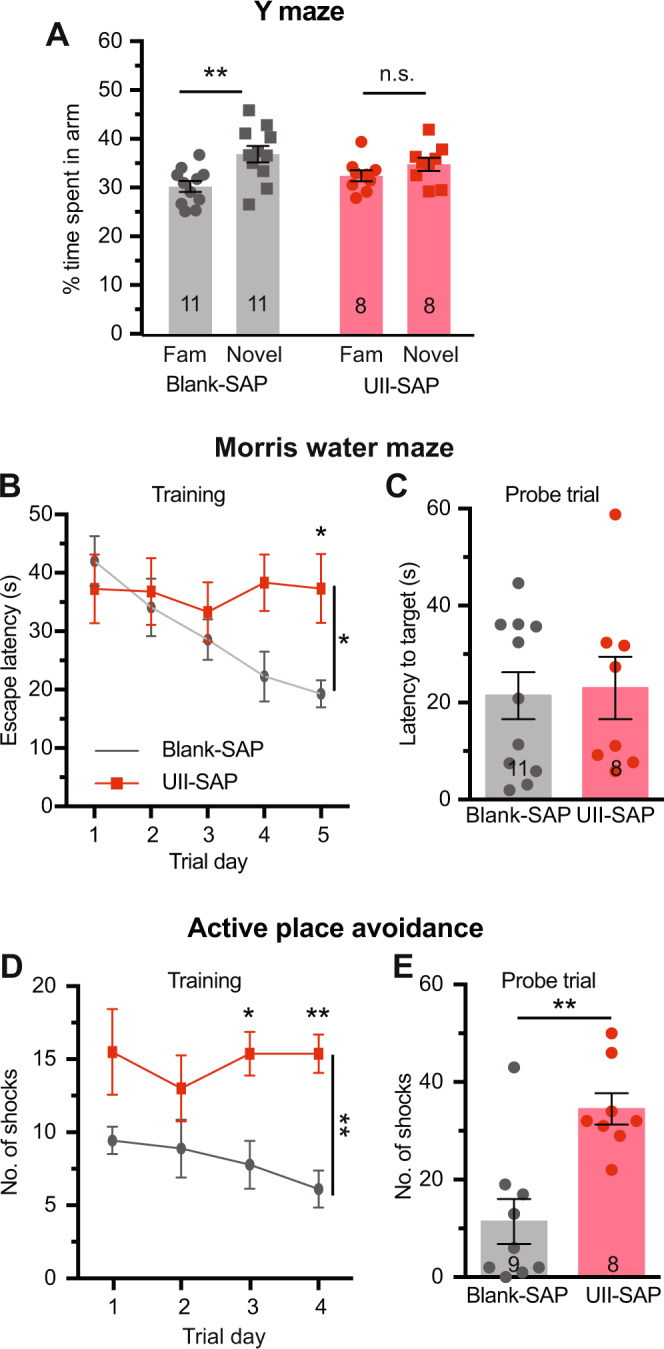
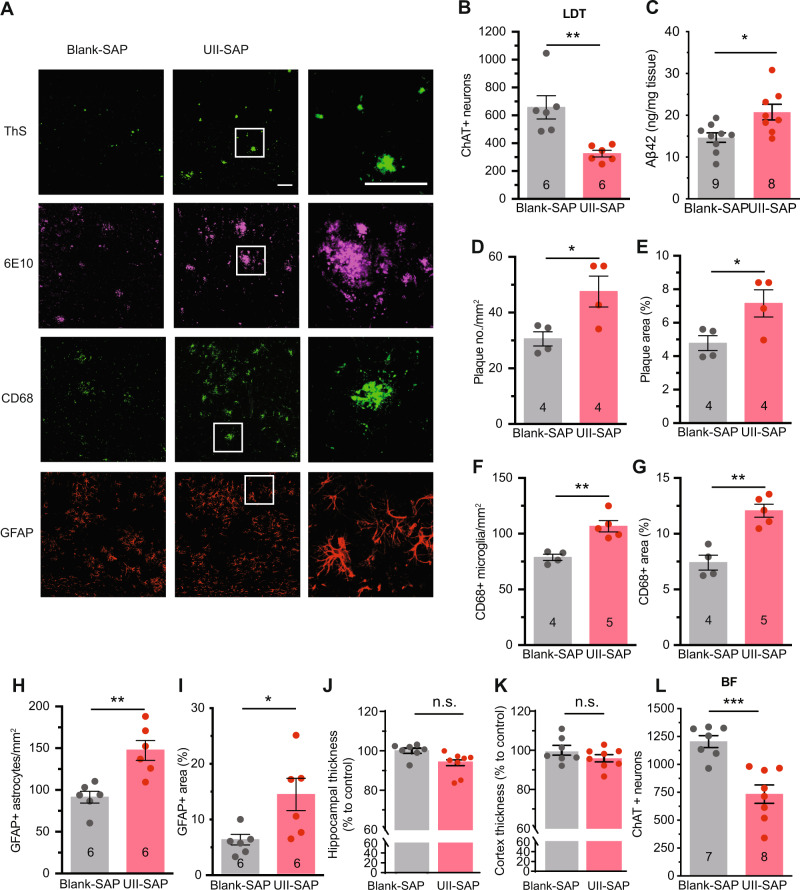
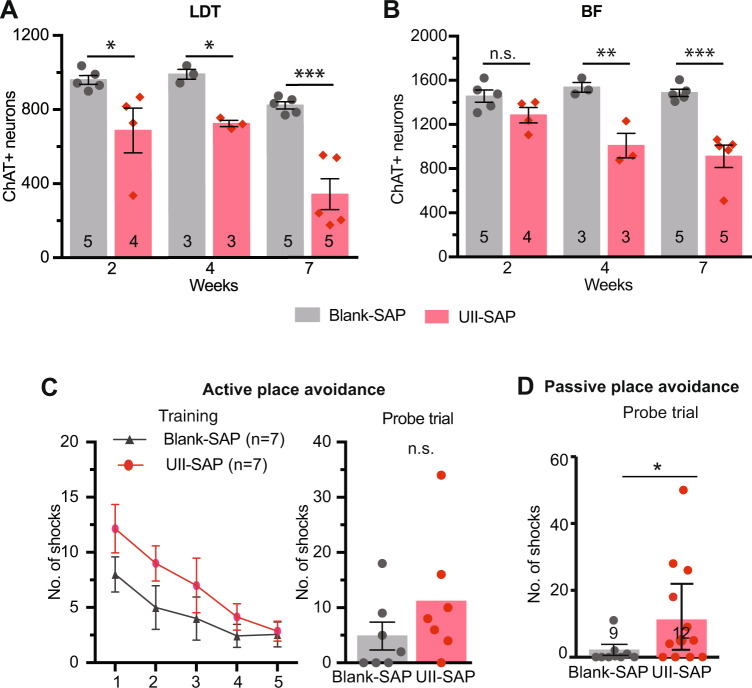
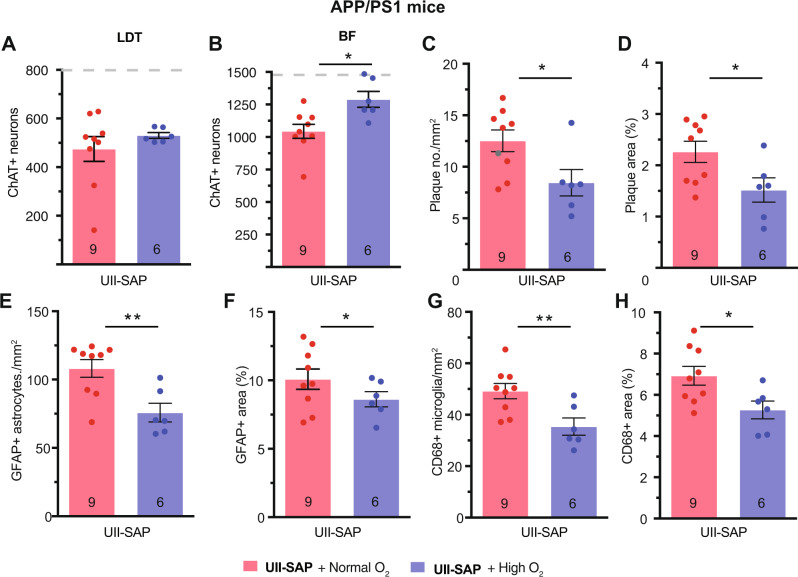
Although epidemiological studies indicate that sleep-disordered breathing (SDB) such as obstructive sleep apnea is a strong risk factor for the development of Alzheimer's disease (AD), the mechanisms of the risk remain unclear. Here we developed a method of modeling SDB in mice that replicates key features of the human condition: altered breathing during sleep, sleep disruption, moderate hypoxemia, and cognitive impairment. When we induced SDB in a familial AD model, the mice displayed exacerbation of cognitive impairment and the pathological features of AD, including increased levels of amyloid-beta and inflammatory markers, as well as selective degeneration of cholinergic basal forebrain neurons. These pathological features were not induced by chronic hypoxia or sleep disruption alone. Our results also revealed that the cholinergic neurodegeneration was mediated by the accumulation of nuclear hypoxia inducible factor 1 alpha. Furthermore, restoring blood oxygen levels during sleep to prevent hypoxia prevented the pathological changes induced by the SDB. These findings suggest a signaling mechanism whereby SDB induces cholinergic basal forebrain degeneration.


Conflict of interest statement

The authors report no competing interests.

Figures

Fig. 1
Fig. 1. Urotensin II-saporin induces specific lesions of cholinergic neurons at mesopontine tegmentum.
A Diagrams and photomicrographs of coronal sections of the brainstem, the right column being immunostained for ChAT-positive neurons within the laterodorsal tegmental nucleus (LDT) following unilateral direct injection of UII-saporin (UII-SAP) into the right mesopontine tegmentum (MPT). Scale bar = 200 μm. Images are representative of N = 3 animals. B Direct injection bilateral of UII-SAP into the MPT reduces the number of ChAT-positive neurons within the LDT compared with Blank-SAP injections (P < 0.0001). C Intraventricular injection of UII-SAP reduced the number of ChAT-positive neurons within the LDT compared to control unconjugated saporin injections (Blank-SAP) (P = 0.0003). D Direct injection of UII-SAP into the LDT does not affect the number of calbindin-positive GABAergic neurons in the LDT compared to Blank-SAP injection (P = 0.8857). E The number of ChAT-positive hypoglossal motor neurons per section following injection of UII- SAP or Blank-SAP is not different (P = 0.9470). F The distance traveled by UII-SAP- and Blank-SAP-injected mice in the center area of the open field test, which was not different between conditions (P = 0.8313). G Time spent on the Rotarod in three successive trials lasting up to 3 min each is not different between UII-SAP- and Blank-SAP-injected mice. Comparisons by Students’ unpaired two-tailed t-test; ****P < 0.0001, n.s., non-significant. Results are presented as mean ± s.e.m. Each data point represents an individual animal. Source data are provided in the Source Data file.
Fig. 2
Fig. 2. Urotensin II-saporin treatment affects the breathing pattern and induces hypoxemia during sleep.
Stylized breathing traces based on the average measures of the polysomnography features recorded by whole body plethysmography and coincident EEG recordings in mice injected with control Blank-SAP (A, C) or UII-SAP (B, D) during wake (A, B) or sleep (C, D). Statistics refer to sleep-wake paired two-way ANOVA and Levene tests of variance of both male and female mice. E Average polysomnography measures for individual male mice in UII-SAP or control Blank-SAP groups (sleep-wake paired two-way ANOVA; mean ± s.d) f frequency, PIF peak inspiration flow, PEF the peak exhalation flow, EIP time for inspiration, EEP time for exhalation, RT: F Average blood oxygen saturation level of unrestrained UII-SAP- and Blank-SAP-injected male mice measured during their sleep period (P < 0.0001, Student’s unpaired two-tailed t-test; mean ± s.e.m). G Representative traces of blood oxygen saturation levels of male mice injected with either UII-SAP or control Blank-SAP. *P < 0.05, **P < 0.01, ***P < 0.001 ****P < 0.0001 n.s: non-significant. Each data point represents an individual animal.
Fig. 3
Fig. 3. Urotensin II-saporin treatment affects the sleeping patterns causing sleep deprivation.
A Average amount of REM, NREM, and wake sleep during lights on (sleep) and lights off (wake) periods. (P = 0.0264, two–way ANOVA with Tukey’s multiple comparisons test). B Average number of REM, NREM and wake sleep bouts during lights on (sleep) and lights off (wake) periods. (P = 0.0026, two-way ANOVA with Tukey’s multiple comparisons test). C Average length of REM, NREM an wake bouts during lights on (sleep) and lights off (wake) periods. (P = 0.0145, two way ANOVA with Tukey’s multiple comparisons test). D The average number of transitions during the lights on period that lesioned (gray) and UTII-SAP (red) lesioned mice moved between sleep states and sleep and wake (P = 0.010 unpaired two-tailed t-test). E Average number and length of sleep bouts (periods spent inactive lasting at least 10 min, P = 0.5023, P = 0.0475, unpaired two-tailed t-test) and total time spent inactive (P = 0.0475, unpaired two-tailed t-test) during a 12 h light phase for the first 48 h of activity recording. F Total time spent inactive during the 12 h light phase in the first 48 h (P = 0.0014, unpaired two-tailed t-test). G Activity traces of a control and a lesioned mouse over 3 days of in 12:12 h light:dark cycle. On day 3 during the dark phase, mice were exposed to 3 h of 30 Lux dim light. H Time spent active during the 3 h low light period during the 12 h light phase on day 3 of the experiment. (P = 0.04). Mice placed in 40% oxygenated (high O2) for 8 h a day during the sleep period for 2 weeks starting 2 weeks after injection with UII-SAP (purple bar) did not have a sleep debt compared to UTII-SAP-injected mice subjected to normoxia. (P = 0.0286, two-tailed Mann–Whitney test). *P < 0.05, **P < 0.01, ***P < 0.001 ****P < 0.0001 n.s: non-significant. Results are presented as mean ± s.e.m. Each data point represents an individual animal. Source data are provided in the Source Data file.
Fig. 4
Fig. 4. cMPT lesion exacerbates cognitive impairment in APP/PS1 mice.
A The percentage time spent in the novel arm of the Y maze on test, compared to the familiar (Fam) arm. Blank-SAP-injected mice displayed a preference for the novel arm, whereas cMPT- lesioned mice had no preference (P = 0.0040, two-way ANOVA, Tukey’s multiple comparison test; Blank-SAP: P = 0.0072, UII-SAP: P = 0.6994). B Escape latency in the training phase of the Morris water maze. cMPT-lesioned APP/PS1 mice spent significantly more time finding the escape platform on the last two training days (P = 0.0150, two-way ANOVA, Tukey’s multiple comparison test; day 5: P = 0.0376). C Latency to reach the platform position in the probe test of the Morris water maze. There were no significant differences in escape latency between groups (P = 0.8430, Student’s unpaired two-tailed t-test). D The number of shocks received by mice each training day of the active place avoidance test. cMPT-lesioned APP/PS1 mice received significantly more shocks on the last two training days (P = 0.0044, two-way ANOVA, Tukey’s multiple comparison test; day 3, P = 0.0159; day 4, P = 0.0022). E The number of shocks the mice would have received in the probe trial of the active place avoidance test was significantly higher for cMPT-lesioned APP/PS1 mice than non-lesioned APP/PS1 mice (P = 0.0012, Student’s unpaired two-tailed t-test). *P < 0.05; **P < 0.01; n.s., non-significant. Results are presented as mean ± s.e.m. Each data point represents an individual animal. Source data are provided in the Source Data file.
Fig. 5
Fig. 5. cMPT lesion exacerbates major AD hallmarks of lesioned APP/PS1 mice.
A Representative photomicrographs of sagittal brain sections of hippocampus and cortex of APP/PS1 mice treated with UII-saporin (6 animals) or control Blank-saporin (6 animals) and stained with thioflavin S (ThS) and 6E10 (both for Aβ plaques), CD68 or GFAP (for microglia and astrocytes). Scale bars = 100 μm. B The average number of ChAT-positive neurons in the LDT of UII-SAP -injected APP/PS1 mice was lower than that of APP/PS1 mice injected with Blank-SAP (P = 0.0033). C The amount of soluble Aβ in the hippocampal lysates of APP/PS1 mice treated with UII-SAP as measured by ELISA was higher than that of APP/PS1 mice injected with Blank-SAP (P = 0.0116). The density (D; P = 0.0320) and area (E; P = 0.0432) of thioflavin-S-positive Aβ plaque in neocortex of APP/PS1 mice treated with UII-SAP was higher than that of APP/PS1 mice injected with Blank- SAP. The density (F; P = 0.0028) and area (G; P = 0.0012) of CD68 immmunopositive staining in the neocortex of the APP/PS1 mice treated with UII-SAP was higher than that of APP/PS1 mice injected with Blank-SAP. Density (H; P = 0.0023) and area (I; P = 0.0241) of GFAP immunostaining in the neocortex of the mice treated with UII-SAP was higher than that of APP/PS1 mice injected with Blank-SAP. J The thickness of the CA1 pyramidal layer of UII-SAP-injected and Blank-SAP-injected APP/PS1 mice. K The thickness of the somatosensory cortex of UII-SAP-injected and Blank-SAP-injected APP/PS1 mice. L The average number of ChAT-positive basal forebrain (BF) neurons in APP/PS1 mice treated with UII-SAP was lower than that of APP/PS1 mice injected with Blank-SAP (P = 0.0038). *P < 0.05, **P < 0.01, ***P < 0.001 ****P < 0.0001 n.s.: non-significant. Student’s unpaired two-tailed t-test for panels (BL). Results are presented as mean ± s.e.m. Each data point represents an individual animal. Source data are provided in the Source Data file.
Fig. 6
Fig. 6. cMPT lesions induce cBF neuronal degeneration and cognitive impairment.
A The number of ChAT-positive neurons in the LDT of C57Bl6 mice following injection of either UII-SAP or Blank-SAP 2-7 weeks earlier (P < 0.0001, two-way ANOVA, Bonferroni’s multiple comparisons test, 2wk: P = 0.0133, 4wk: P = 0.0248, 7wk: P < 0.0001). B The number of ChAT-positive neurons in the basal forebrain (BF) of C57Bl6 mice following injection of either UII-SAP or Blank-SAP 2 to 7 weeks earlier. cBF neuron loss was subsequent to the loss in the LDT (P < 0.0001, two-way ANOVA, Bonferroni’s multiple comparisons test, 2wk: P = 0.3142, 4wk: P = 0.0010, 7wk: P < 0.0001). C In the active place avoidance test, the number of shocks was not significantly different between conditions on any given training day (P = 0.7580, two-way ANOVA, Tukey’s multiple comparison test) or in the probe test between the cMPT-lesioned mice and sham-lesioned mice (P = 0.2279, Student’s unpaired one-tailed t-test), although a trend for poorer performance was seen. D The number of potential shocks recorded in the probe trial of the passive place avoidance test was significantly different between the UII-SAP and control blank-SAP groups. (P = 0.04, Student’s unpaired one-tailed t-test) *P < 0.05, **P < 0.01, ***P < 0.001, ****P < 0.0001, n.s., non-significant. Results are presented as mean ± s.e.m. Each data point represents an individual animal. Source data are provided in the Source Data file.
Fig. 7
Fig. 7. Sleep deprivation causes cognitive impairment but not AD pathology.
A The percentage of time spent in the novel arm of the Y maze on test, compared to the familiar arm. APP/PS1 mice displayed a preference for the novel arm, whereas sleep-deprived mice had no preference (P = 0.0477, control: P = 0.0050, Sleep-deprived: P = 0.1733). B The number of cBF neurons in C57Bl6 mice following sleep deprivation was equivalent to that of control mice (P = 0.624, Student’s unpaired two-tailed t-test). C The amount of soluble Aβ in hippocampal (age: P = 0.0602, cage: P = 0.774, interaction: P = 0.8960) and cortical (age: P = 0.0733, cage: P = 0.155, interaction P = 0.734) lysates as measured by ELISA was not altered by sleep deprivation. D The area of thioflavin-S-positive Aβ plaque in the hippocampus (age: P = 0.0330, cage: P = 0.9852, interaction: P = 0.6177) and cortex (age: P = 0.0128, cage: P = 0.410, interaction P = 0.666) of APP/PS1 mice was affected by age but not by sleep deprivation. *P < 0.05, **P < 0.01, ***P < 0.001, ****P < 0.0001, n.s., non-significant. two-way ANOVA, Sidak’s multiple comparisons for panels (A, C, and D). Results are presented as mean of pooled age groups ± s.e.m. Each data point represents an individual animal. Source data are provided in the Source Data file.
Fig. 8
Fig. 8. cBF neuronal loss following cMPT lesion is induced by intermittent hypoxia.
A The number of cBF neurons in C67Bl6 mice following 4 weeks of daily sleep-time exposure to hypoxic conditions (P = 0.3780 unpaired two-tailed t-test).). B The percentage of cBF neurons in which HIF1α immunostaining was present in the nucleus in Blank-SAP (gray bar) or UII-SAP mice treated with daily 15 mg/kg 2ME2 (blue bar) or vehicle (red bar) for 3 weeks. (Blank-SAP vs. UII-SAP: ***P = 0.0001, Blank-SAP vs. 2ME2 treated: P = 0.1766, UII-SAP vs. 2ME2 treated: **P = 0.0011). C Representative confocal images of basal forebrain sections from 4 animals immunostained for ChAT (red), HIF1α (green) and nuclei (DAPI; blue). The number of cLDT (D) and cBF (E) neurons in mice following injection of either Blank-SAP (gray bar) or UII-SAP and treated with daily 15 mg/kg 2ME2 (blue bar) or vehicle (red bar) for 3 weeks (cBF results: Blank-SAP vs. UII-SAP: P = 0.0001, Blank-SAP vs. 2ME2 treated: P = 0.0020, UII-SAP vs. 2ME2 treated: P = 0.5401). 2ME2 treatment protects cBF neurons from the effects of lesioning. F Performance of 2ME2-treated (blue bar) and untreated UII-SAP-lesioned (red bar) mice compared to Blank-SAP-lesioned mice (gray bar) in the test phase of the passive place avoidance task. (Blank-SAP vs. UII-SAP: P = 0.0152, Blank-SAP vs. 2ME2 treated: P = 0.4014, UII-SAP vs. 2ME2 treated: *P = 0.0112). G The number of cBF neurons in UII-SAP-injected ChAT-cre HIF-1αfl/wt mice was not significantly different from that in Blank-SAP-injected ChAT-cre HIF-1αfl/wt mice (P = 0.084 unpaired two tailed t-test). * P < 0.05, **P < 0.01, ***P < 0.001 ****P < 0.0001 n.s., non-significant. one-way ANOVA Tukey’s multiple comparison test for panels (BF). Results are presented as mean ± s.e.m. Each data point represents an individual animal. Source data are provided in the Source Data file.
Fig. 9
Fig. 9. High oxygen treatment protects from OSA-exacerbated AD phenotypes.
Number of cLDT (A) and cBF (B) neurons in APP/PS1 mice injected with UII-SAP and either the untreated (normoxia, normal oxygen) or treated daily with high oxygen. Number (C; P = 0.0320) and area (D; P = 0.0432) of thioflavin-S-positive Aβ plaques in the neocortex of APP/PS1 mice injected with UII-SAP and treated with normoxia or high oxygen. Density (E; P = 0.0056) and area (F; P = 0.0432) of GFAP-positive microglia in the neocortex of APP/PS1 mice injected with UII-SAP and treated with normoxia or high oxygen. Density (G; P = 0.0098) and area (H; P = 0.0264) of CD68-positive astrocytes in the neocortex of APP/PS1 mice injected with UII-SAP and treated with normoxia or high oxygen. * P < 0.05, **P < 0.01, n.s., non-significant. Student’s unpaired two-tailed t-test for panels (AH). Results are presented as mean ± s.e.m. Each data point represents an individual animal. Source data are provided in the Source Data file.

References

    1. Hardy J, Selkoe DJ. The amyloid hypothesis of Alzheimer’s disease: Progress and problems on the road to therapeutics. Science. 2002;297:353–356. doi: 10.1126/science.1072994. - DOI - PubMed
    1. Karran E, De Strooper B. The amyloid hypothesis in Alzheimer disease: New insights from new therapeutics. Nat. Rev. Drug Discov. 2022;21:306–318. doi: 10.1038/s41573-022-00391-w. - DOI - PubMed
    1. Zhu X, Zhao Y. Sleep-disordered breathing and the risk of cognitive decline: A meta-analysis of 19,940 participants. Sleep. Breath.; Schlaf Atm. 2018;22:165–173. doi: 10.1007/s11325-017-1562-x. - DOI - PubMed
    1. Punjabi NM. The epidemiology of adult obstructive sleep apnoea. Proc. Am. Thorac. Soc. 2008;5:136–143. doi: 10.1513/pats.200709-155MG. - DOI - PMC - PubMed
    1. Yaffe K, Falvey CM, Hoang T. Connections between sleep and cognition in older adults. Lancet Neurol. 2014;13:1017–1028. doi: 10.1016/S1474-4422(14)70172-3. - DOI - PubMed

Publication types

Substances