. 2022 Nov 2;13(1):6581.
doi: 10.1038/s41467-022-34412-4.

Reactive astrocytes transduce inflammation in a blood-brain barrier model through a TNF-STAT3 signaling axis and secretion of alpha 1-antichymotrypsin

Affiliations

Reactive astrocytes transduce inflammation in a blood-brain barrier model through a TNF-STAT3 signaling axis and secretion of alpha 1-antichymotrypsin

Hyosung Kim et al. Nat Commun. .

Abstract

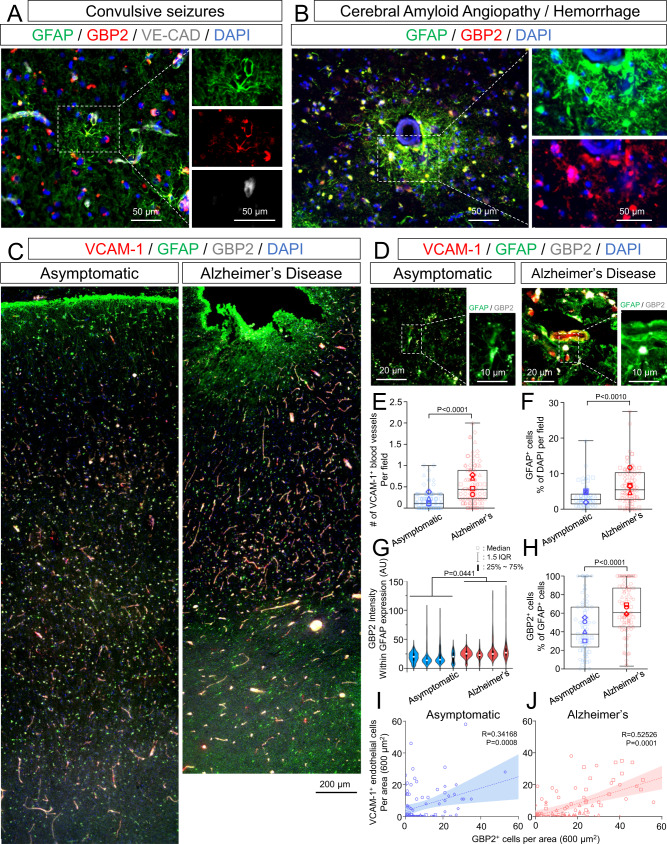
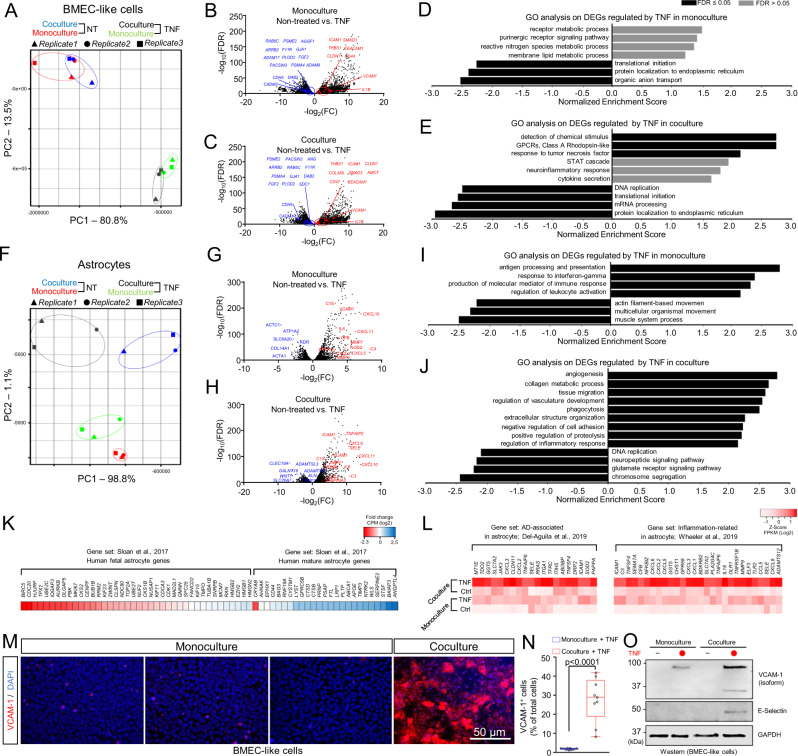
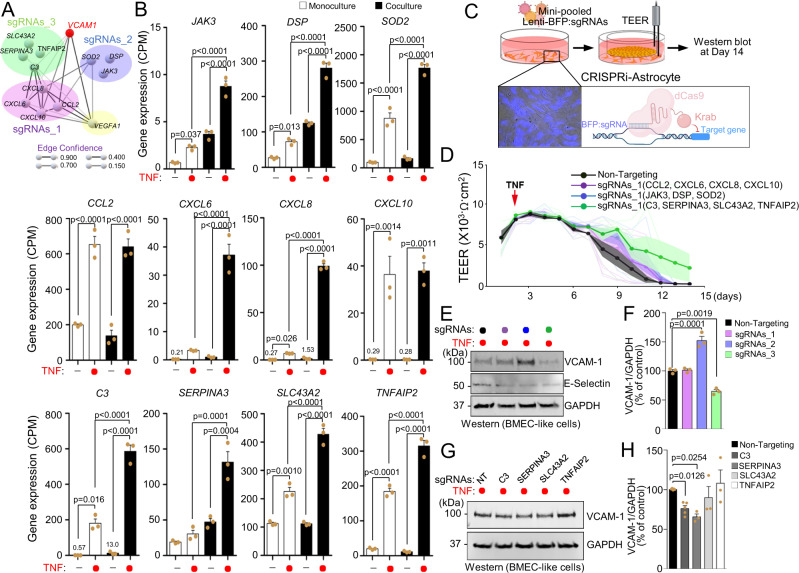
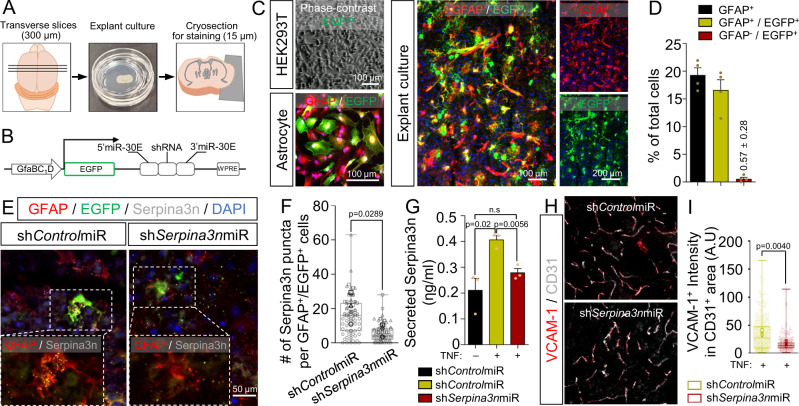
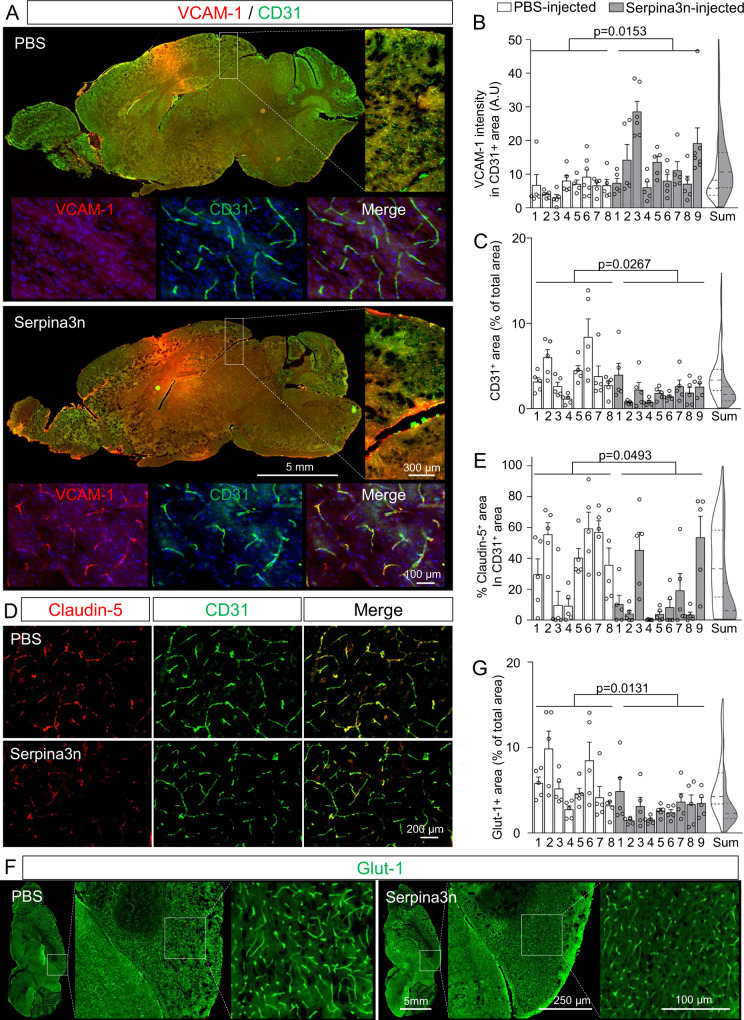
Astrocytes are critical components of the neurovascular unit that support blood-brain barrier (BBB) function. Pathological transformation of astrocytes to reactive states can be protective or harmful to BBB function. Here, using a human induced pluripotent stem cell (iPSC)-derived BBB co-culture model, we show that tumor necrosis factor (TNF) transitions astrocytes to an inflammatory reactive state that causes BBB dysfunction through activation of STAT3 and increased expression of SERPINA3, which encodes alpha 1-antichymotrypsin (α1ACT). To contextualize these findings, we correlated astrocytic STAT3 activation to vascular inflammation in postmortem human tissue. Further, in murine brain organotypic cultures, astrocyte-specific silencing of Serpina3n reduced vascular inflammation after TNF challenge. Last, treatment with recombinant Serpina3n in both ex vivo explant cultures and in vivo was sufficient to induce BBB dysfunction-related molecular changes. Overall, our results define the TNF-STAT3-α1ACT signaling axis as a driver of an inflammatory reactive astrocyte signature that contributes to BBB dysfunction.


Conflict of interest statement

M.K. serves on the Scientific Advisory Board of Engine Biosciences, Casma Therapeutics, and Cajal Neuroscience and is an advisor to Modulo Bio and Recursion Therapeutics. None of the other authors declare competing interests.

Figures

Fig. 1
Fig. 1. Hallmarks of GBP2+ inflammatory reactive astrocytes and vascular VCAM-1 expression in human brain tissue isolated from patients with neuropathological diseases.
A Representative images of perivascular GBP2+/GFAP+ astrocytes in brain tissue from a patient with unspecified convulsive seizures. B Representative images of perivascular GBP2+/GFAP+ astrocytes in brain tissue from a patient with cerebral amyloid angiopathy and associated hemorrhage. C Representative images of VCAM-1, GFAP, and GBP2 expression across the cortex of an asymptomatic patient (left) versus a patient diagnosed with Alzheimer’s disease (right). D Representative cortical perivascular images of VCAM-1, GFAP, and GBP2 expression in an asymptomatic patient (left) versus a patient diagnosed with Alzheimer’s disease (right). EH Quantification of VCAM-1+ vessels (E), GFAP+ astrocytes (F), GBP2 intensity in GFAP + astrocytes (G), and the percentage of GBP2+ astrocytes (H) in age-matched asymptomatic brains and Alzheimer’s disease brains (n = 4 biological replicates for each condition). The boxes for E, F, and H show the range between the 25th and 75th percentiles, the line within each box indicates the median, and the outer lines extend to 1.5 times the interquartile range (IQR) from the box. Faint datapoints indicate individual images and solid datapoints indicate the mean for each biological replicate. The violin plot (G) shows the same features for each biological replicate. Statistical analyses were performed with a two-sided t test. I, J Pearson correlation of VCAM-1+ cells to GBP2+ cells per area in age-matched asymptomatic brains (I) and Alzheimer’s disease brains (J) (n = 4 biological replicates for each condition). Best-fit lines with a shaded area of 95% confidence intervals from linear regression, as well as Pearson correlation coefficients and p values from a two-tailed test, are presented on each plot.
Fig. 2
Fig. 2. Co-culture of iPSC-derived BMEC-like cells and astrocytes is necessary for disruption of passive barrier function by inflammatory cytokines.
A Schematic procedure for deriving astrocytes from iPSCs. B Representative immunofluorescent images of astrocyte markers after 40 days of differentiation. C Schematic procedure for deriving BMEC-like cells from iPSCs. D Representative immunofluorescent images of smooth and continuous tight junctions in the BMEC-like cells 8 days after differentiation. E Representative TEER values in BMEC-like cells in monoculture or in co-culture with astrocytes. Data are graphed as mean ± SEM from technical triplicates. Trends were confirmed across n = 3 biological replicates. F Representative immunofluorescent images of GFAP and GBP2 expression in astrocytes 48 h after treatment with an inflammatory cytokine cocktail. G, H Schematic diagram of the procedure for treating BMEC-like cells with astrocyte conditioned medium (G) and subsequent TEER measurements (H). Astrocyte conditioned medium without inflammatory cytokines is noted as “ACM” and astrocyte conditioned medium collected after cytokine treatment is referred to as reactive astrocyte conditioned medium, or “RACM.” Data are graphed as mean ± SEM from technical triplicates. Trends were confirmed across n = 3 biological replicates. I, J Experimental setup (I) and subsequent TEER measurements (J) after dosing BMEC-like cells with cytokines in monoculture or co-culture. Data are graphed as mean ± SEM from technical triplicates. Trends were confirmed across n = 3 biological replicates.
Fig. 3
Fig. 3. Comparison of transcriptomic signatures and inflammatory phenotypes in astrocytes and BMEC-like cells as a function of co-culture and treatment with TNF.
A PCA clustering plot of RNA-seq data in BMEC-like cell. B, C Volcano plot of DEGs (FDR < 0.1) in BMEC-like cells in monoculture versus co-culture, with or without TNF treatment. Red and blue points highlight genes associated with endothelial cell-cell junctions, internalization and trafficking, and angiogenesis. D, E GO analyses in the BMEC-like cells in monoculture versus co-culture. F PCA clustering plot of RNA-seq data in astrocytes. G, H Volcano plot of DEGs (FDR < 0.1) in astrocytes in monoculture versus co-culture, with or without TNF treatment. Red and blue points highlight genes associated with inflammation, chemokines, and immune responses. I, J GO analyses in the astrocytes in monoculture versus co-culture. K Heat map showing fold change of gene expression of maturity-related genes in co-cultured astrocytes compared to monocultured astrocytes. The gene set is based on ref. . L Heat map showing relative expression of genes associated with AD and inflammation across all astrocyte conditions. The gene sets are based on ref. (left panel) and ref. (right panel). The color of the heat map represents the log2(FPKM value) for each gene. M, N Representative immunofluorescent images of VCAM-1 expression in BMEC-like cells under different conditions (M) and select quantification (N). Data were acquired at day 14 according to the timing presented in Fig. 2J. Quantification was conducted using n = 3 biological replicates. The box shows the range between the 25th and 75th percentiles, the line within each box indicates the median, the outer lines extend to 1.5 times the interquartile range from the box, and each data point represents an individual image (3 images quantified per biological replicate). Statistical analyses were performed with a two-sided t test. O Representative western blot showing relative VCAM-1 and E-selectin expression in BMEC-like cells in monoculture or co-culture, with or without TNF treatment. Data were acquired at day 14 according to the timing presented in Fig. 2J. GAPDH was used as a loading control. Trends were confirmed across n = 3 biological replicates.
Fig. 4
Fig. 4. STAT3 signaling is active in reactive inflammatory astrocytes in vitro and in human tissue samples from Alzheimer’s disease patients.
A Network analysis (confidence score >0.7) of the top 50 differentially expressed astrocytic genes encoding secreted factors, with corresponding endothelial genes encoding receptors. B Network analysis (confidence score >0.9) of the STAT3 interactome. C Ingenuity Pathway Analysis (IPA) on DEGs (FDR < 0.1) between co-cultured astrocytes with or without TNF treatment. p values were calculated using a right-tailed Fisher’s exact test. D Representative images of pSTAT3Y705, C3, and GFAP expression in the cortex of an asymptomatic patient versus a patient diagnosed with Alzheimer’s disease. E Quantification of nuclear pSTAT3Y705 intensity in the cortex of asymptomatic patients versus patients diagnosed with Alzheimer’s disease. Statistical analyses were performed with a one-sided t test. F Quantification of nuclear pSTAT3Y705 intensity in GFAP- versus GFAP+ cells in the cortex of patients diagnosed with Alzheimer’s disease (70 cells counted per sample; n = 4 biological replicates). The boxes show the range between the 25th and 75th percentiles with a line and a plus sign indicating median and mean, respectively. Statistical analyses were performed with a one-sided t test. G Pearson correlation of C3 intensity in GFAP+ astrocytes to nuclear pSTAT3Y705 intensity of GFAP+ astrocyte in the cortex of four patients diagnosed with Alzheimer’s disease. Best-fit lines with a shaded area of 95% confidence intervals from linear regression, as well as the Pearson correlation coefficient and p value from a two-tailed test, are presented in the plot.
Fig. 5
Fig. 5. STAT3 activation in reactive inflammatory astrocytes contributes to BBB dysfunction in vitro and in vivo.
A Representative images of GFAP, VCAM-1, and Glut-1 expression in mouse brain from a wild-type (WT) control versus astrocyte-specific Stat3 conditional knockout (Stat3cKO). B Bar graph showing GFAP expression in brains of WT (n = 6) versus Stat3cKO (n = 4) mice. Data are graphed as mean ± SEM. Statistical analyses were performed with a two-sided t test. C Bar graph showing VCAM-1 expression in Glut-1+ vessels in brains of WT (n = 6) versus Stat3cKO (n = 4) mice. Data are graphed as mean ± SEM. Statistical analyses were performed with a two-sided t test. D Bar graph showing STAT3 gene expression (CPM) in iPSC-derived astrocytes at day 5 of monoculture or co-culture, with or without TNF treatment. Data are graphed as mean ± SEM from n = 3 biological replicates. E Schematic diagram of the procedure for producing dominant-negative STAT3 iPSC-derived astrocytes for co-culture with BMEC-like cells and subsequent TEER measurements and western blot analysis. F TEER values in BMEC-like cells in co-culture with astrocytes after dominant negative STAT3 overexpression. Data are presented as a continuous mean ± shaded SEMs per condition from n = 3 technical replicates. Trends were confirmed across n = 3 biological replicates. G, H Representative western blot and quantification of VCAM-1 expression in BMEC-like cells. Data were acquired at day 14 according to the timing presented in Fig. 2J. GAPDH was used as a loading control. Data are graphed as mean ± SEM from n = 3 biological replicates. Statistical analyses were performed with a one-sided t test.
Fig. 6
Fig. 6. Pooled CRISPRi screen identifies SERPINA3 expression in astrocytes as a contributor to BBB dysfunction.
A Network representation connecting VCAM1 to astrocytic genes predominantly upregulated by TNF in co-culture. Line thickness indicates the edge confidence. The VCAM1 bait gene is labeled in red. Genes were segregated with colored circles into 4 clusters roughly based on their known functions. B Expression levels (CPM) of the selected astrocytic genes of A. Data are graphed as mean ± SEM from n = 3 biological replicates. Statistical significance was calculated using a one-way ANOVA with Tukey’s post hoc test. C Schematic procedure for pooled gene knockdown in CRISPRi-astrocytes and co-culture with BMEC-like cells, followed by TEER measurements and western blot analysis. D TEER values in BMEC-like cells in co-culture with astrocytes transduced with pooled sgRNAs. Data are presented as continuous means ± shaded SEMs aggregated from n = 3 biological replicates per condition. E, F Representative western blot and quantification of VCAM-1 expression in BMEC-like cells co-cultured with CRISPRi-astrocytes. CRISPRi-astrocytes were transduced with pooled sgRNAs targeting genes color coded to the clusters in A. Data were acquired at day 14 after co-culture. GAPDH was used as a loading control. Data are graphed as mean ± SEM from n = 3 biological replicates. Statistical significance was calculated using a one-way ANOVA with Tukey’s post hoc test. G, H Representative western blot and quantification of VCAM-1 expression in BMEC-like cells co-cultured with CRISPRi-astrocytes. CRISPRi-astrocytes were transduced with a single sgRNA targeting individual genes in the cluster colored in green in A. Data were acquired at day 14 after co-culture. GAPDH was used as a loading control. Data are graphed as mean ± SEM from n = 3 biological replicates (for non-targeting, SERPINA3, SLC43A2, and TNFAIP2) or n = 5 biological replicates (for C3). Statistical significance was calculated using a one-way ANOVA with Tukey’s post hoc test.
Fig. 7
Fig. 7. Inhibition of astrocytic Serpina3n expression in cortical explant cultures reduces BBB inflammation associated with TNF treatment.
A Schematic overview of the cortical explant culture preparation and analyses. B Schematic representation of the master AAV vector encoding EGFP and miR−30-shRNA driven by a shortened GFAP promoter. C Representative images of EGFP and GFAP expression in HEK293T cells, iPSC-derived astrocytes, and cortical explant cultures after transduction with the AAV vector. D Quantification of EGFP and GFAP labeling within the explant cultures. Data are plotted as mean ± SEM for n = 4 biological replicates. E Representative images of GFAP, EGFP, and Serpina3n expression in cortical explant cultures transduced with the AAV vector encoding either shControlmiR or shSerpina3nmiR. F Quantification of Serpina3n+ puncta per GFAP+/EGFP+ cell from the images in E. For each condition, at least 80 EGFP + /GFAP + cells were analyzed. Each quantified cell is represented by a faint data point, and solid datapoints indicate the mean for each biological replicate (n = 3). The boxes show the range between the 25th and 75th percentiles, the line within each box indicates the median, and the outer lines extend to 1.5 times the IQR from the box. Statistical analyses were performed with a one-sided t test. G ELISA quantification of soluble Serpina3n levels in cortical explant cultures after AAV and TNF treatment. Data are graphed as mean ± SEM from n = 3 biological replicates. Statistical significance was calculated using a one-way ANOVA with Tukey’s post hoc test. H Representative images of CD31 and VCAM−1 expression in cortical explant cultures transduced with the AAV vector encoding either shControlmiR or shSerpina3nmiR. I Quantification of VCAM-1 intensity across total CD31+ area (231 vessel segments analyzed in the shControlmiR condition and 330 vessel segments analyzed in the shSerpina3nmiR condition; n = 3 biological replicates per condition). The boxes show the range between the 25th and 75th percentiles, the line within each box indicates the median, and the outer lines extend to 1.5 times the IQR from the box. Faint datapoints indicate individual vessel segments and solid datapoints indicate the mean for each biological replicate. Statistical analyses were performed with a one-sided t test.
Fig. 8
Fig. 8. Exogenously administered Serpina3n causes BBB dysfunction-related molecular changes in cortical explant cultures.
A Representative images of endothelial VCAM-1 expression (upper panel) and claudin-5 expression (lower panel) in cortical explant cultures treated with varying concentrations of recombinant Serpina3n. B Quantification of VCAM-1 intensity across total CD31+ area. The boxes show the range between the 25th and 75th percentiles, the line within each box indicates the median, and the outer lines extend to 1.5 times the IQR from the box. Faint datapoints indicate individual vessel segments and solid datapoints indicate the mean for each biological replicate (n = 3). Statistical significance was calculated using a one-way ANOVA with Tukey’s post hoc test. C Quantification of percent claudin-5 coverage within CD31+ vessels (0 μM Serpina3n, 1181 vessel segments counted; 0.05 μM Serpina3n, 735 vessel segments counted; 0.1 μM Serpina3n, 673 vessel segments counted; n = 3 biological replicates). The boxes show the range between the 25th and 75th percentiles, the line within each box indicates the median, and the outer lines extend to 1.5 times the IQR from the box. Faint datapoints indicate individual vessel segments and solid datapoints indicate the mean for each biological replicate. Statistical significance was calculated using a one-way ANOVA with Tukey’s post hoc test. D Quantification of vessel density represented as the area of CD31+ vessels against total tissue area. Data are normalized to the non-treated control. The boxes show the range between the 25th and 75th percentiles, the line within each box indicates the median, and the outer lines extend to 1.5 times the IQR from the box. Faint datapoints indicate individual images and solid datapoints indicate the mean for each biological replicate (n = 3). Statistical significance was calculated using a one-way ANOVA with Tukey’s post hoc test.
Fig. 9
Fig. 9. Exogenously administered Serpina3n causes BBB dysfunction-related molecular changes in vivo.
Mice received an ICV injection of PBS or Serpina3n, and the entire cohort was euthanized 4 days after injections. For all quantifications, 5–7 regions in each mouse were randomly imaged at a distance of at least 3 mm away from the needle track to minimize contributions from sterile inflammation. A Representative sagittal brain section highlighting increased VCAM-1 expression after delivery of Serpina3n. The inset shows that VCAM-1 is localized exclusively to CD31+ blood vessels. B Quantification of VCAM-1 intensity within total CD31+ area in brains of PBS-injected (n = 8) versus Serpina3n-injected (n = 9) mice. Each data point represents an individual image, and data are bar-graphed as mean ± SEM for each biological replicate. Violin plot with median and 25th–75th percentile represents summarized data. Statistical significance was calculated by a one-sided t test. C Quantification of vessel coverage by normalizing CD31+ area to total tissue area. Each data point represents an individual image, and data are graphed as mean ± SEM for each biological replicate of PBS-injected (n = 8) versus Serpina3n-injected (n = 9) mouse. Violin plot with median and 25th–75th percentile represents summarized data. Statistical significance was calculated by a one-sided t test. D Representative images of CD31 and claudin-5 expression in a sagittal brain section. E Quantification of claudin-5 coverage within CD31+ vessel area. Each data point represents an individual image, and data are graphed as mean ± SEM for each biological replicate of PBS-injected (n = 8) versus Serpina3n-injected (n = 9) mouse. Violin plot with median and 25th–75th percentile represents summarized data. Statistical significance was calculated by a one-sided t test. F Representative images of Glut-1 expression in a sagittal brain section. G Normalized Glut-1+ area. Each data point represents an individual image, and data are graphed as mean ± SEM for each biological replicate of PBS-injected (n = 8) versus Serpina3n-injected (n = 9) mouse. Violin plot with median and 25th–75th percentile represents summarized data. Statistical significance was calculated by a one-sided t test.

References

    1. Hawkins BT, Davis TP. The blood-brain barrier/neurovascular unit in health and disease. Pharm. Rev. 2005;57:173–185. - PubMed
    1. Stanimirovic DB, Friedman A. Pathophysiology of the neurovascular unit: disease cause or consequence? J. Cereb. Blood Flow. Metab. 2012;32:1207–1221. - PMC - PubMed
    1. Najjar S, Pearlman DM, Devinsky O, Najjar A, Zagzag D. Neurovascular unit dysfunction with blood-brain barrier hyperpermeability contributes to major depressive disorder: a review of clinical and experimental evidence. J. Neuroinflammation. 2013;10:142. - PMC - PubMed
    1. Sweeney MD, Ayyadurai S, Zlokovic BV. Pericytes of the neurovascular unit: key functions and signaling pathways. Nat. Neurosci. 2016;19:771–783. - PMC - PubMed
    1. Pulido RS, et al. Neuronal activity regulates blood-brain barrier efflux transport through endothelial circadian genes. Neuron. 2020;108:937–952.e937. - PMC - PubMed

Publication types

Substances