. 2022 Nov 2;12(1):18506.
doi: 10.1038/s41598-022-21034-5.

Discovery of SARS-CoV-2 antiviral synergy between remdesivir and approved drugs in human lung cells

Affiliations

Discovery of SARS-CoV-2 antiviral synergy between remdesivir and approved drugs in human lung cells

Xammy Huu Wrynla et al. Sci Rep. .

Abstract

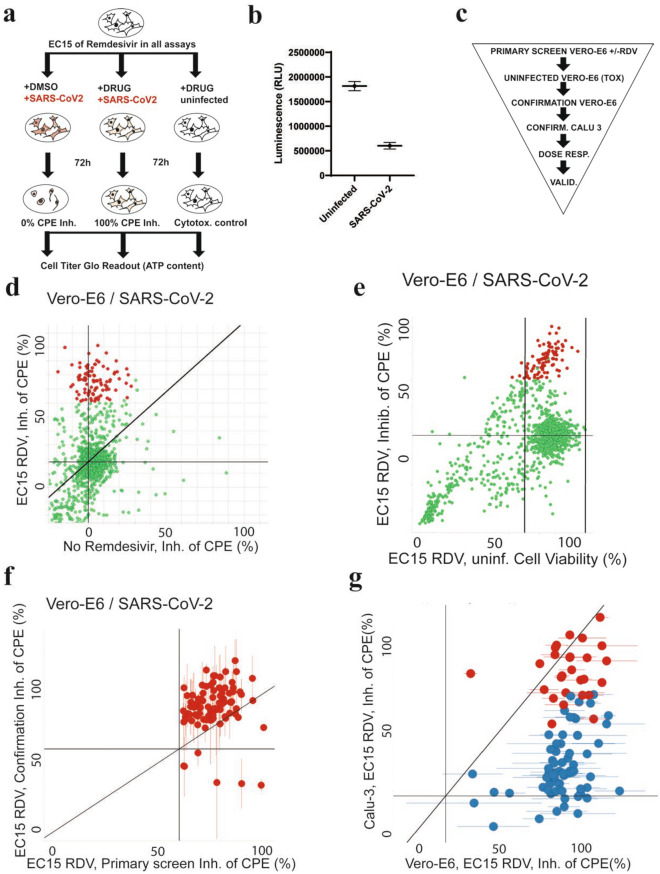
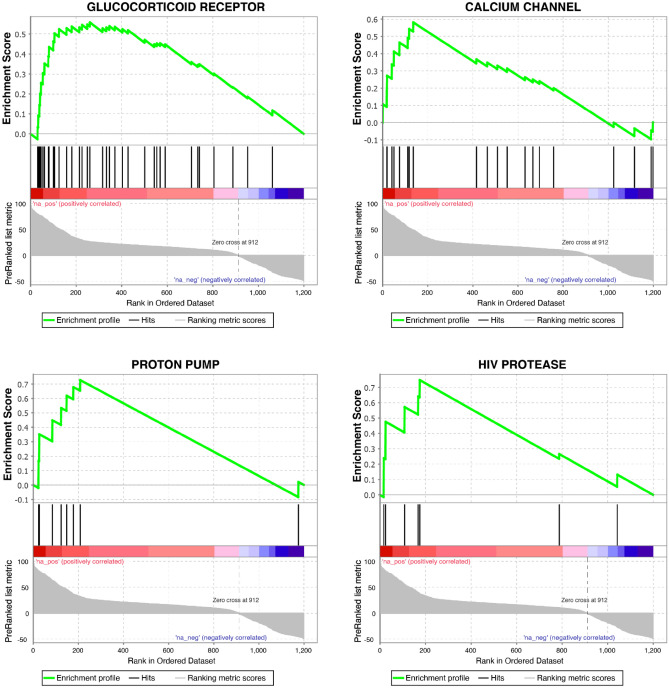
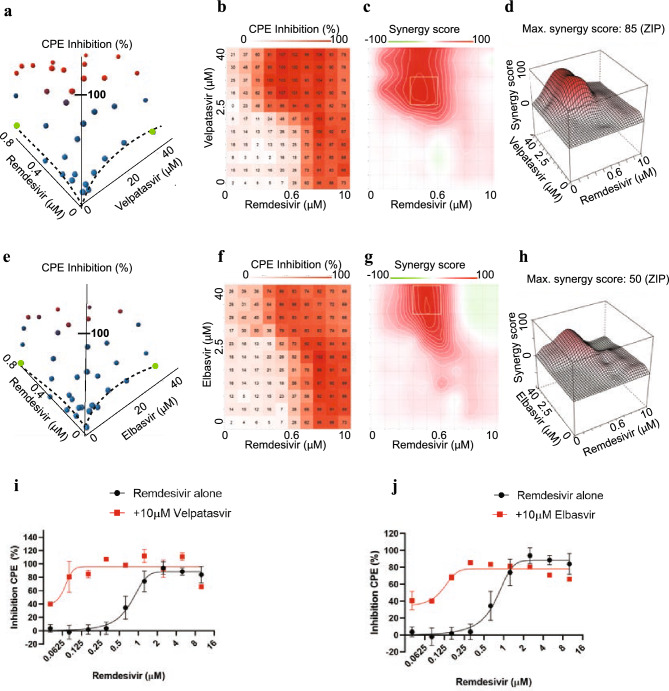
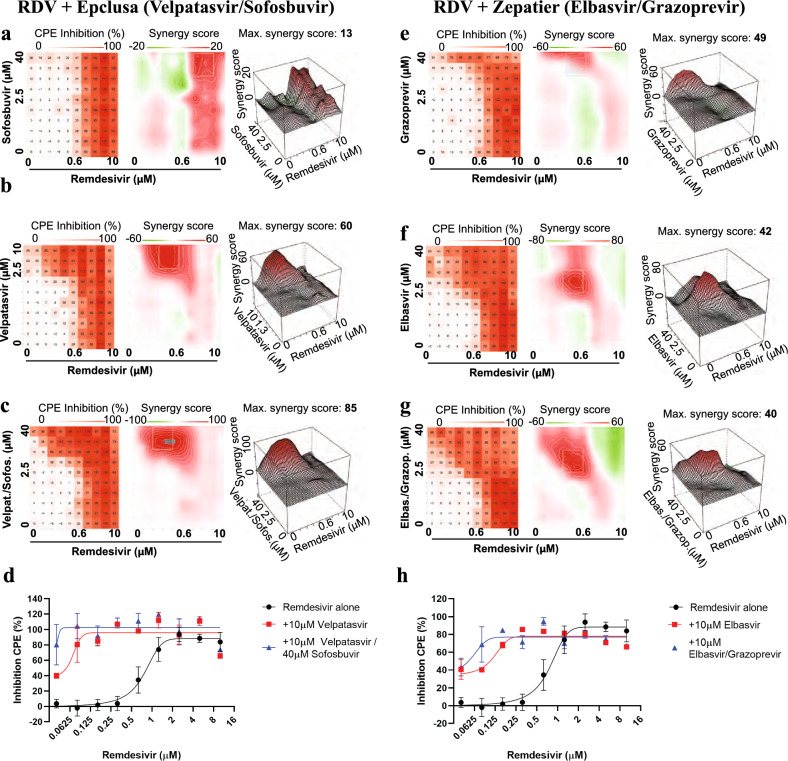
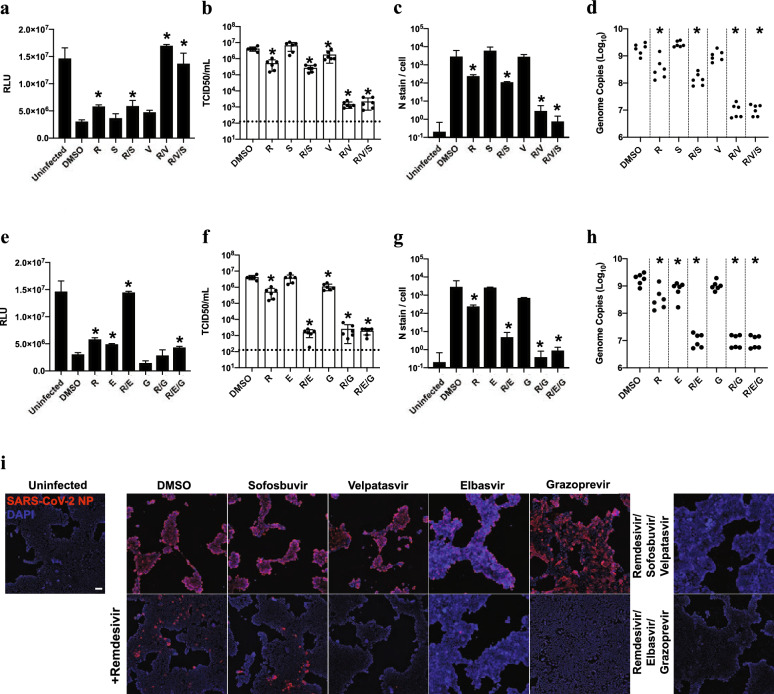
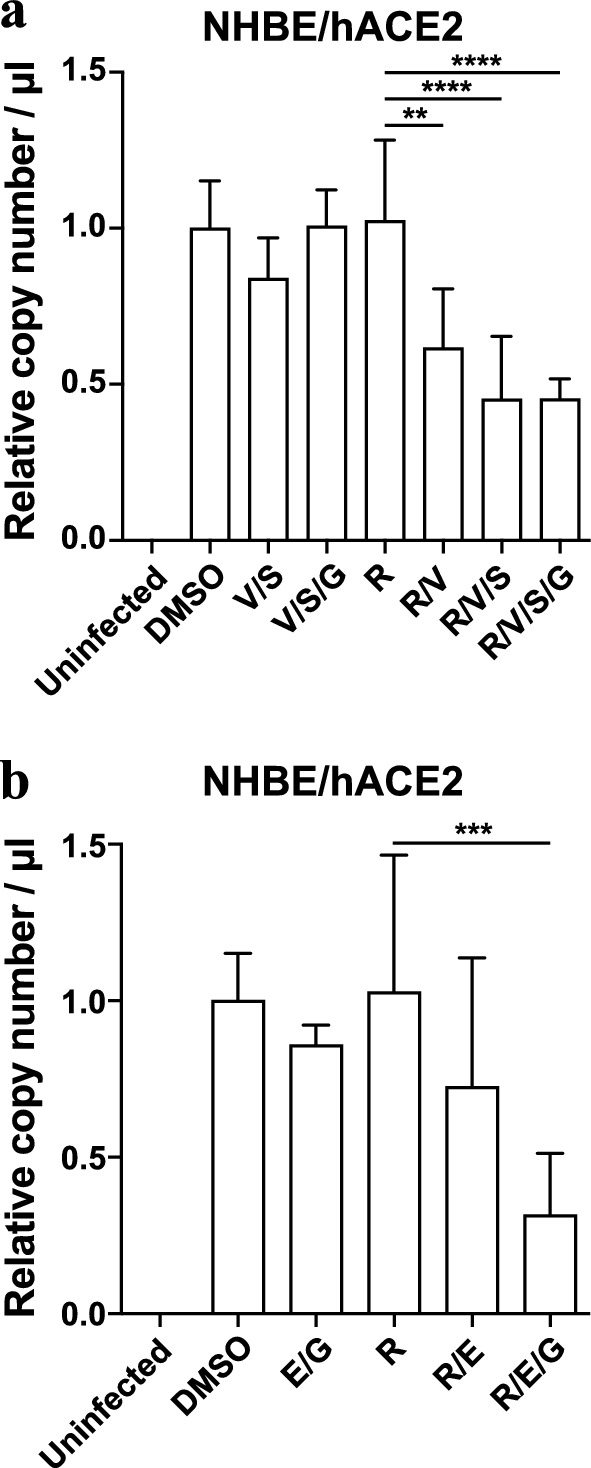
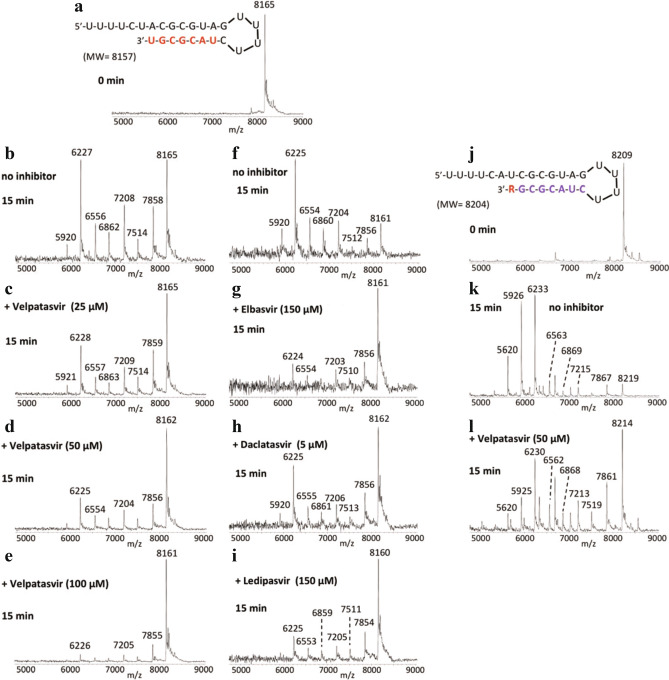
SARS coronavirus 2 (SARS-CoV-2) has caused an ongoing global pandemic with significant mortality and morbidity. At this time, the only FDA-approved therapeutic for COVID-19 is remdesivir, a broad-spectrum antiviral nucleoside analog. Efficacy is only moderate, and improved treatment strategies are urgently needed. To accomplish this goal, we devised a strategy to identify compounds that act synergistically with remdesivir in preventing SARS-CoV-2 replication. We conducted combinatorial high-throughput screening in the presence of submaximal remdesivir concentrations, using a human lung epithelial cell line infected with a clinical isolate of SARS-CoV-2. This identified 20 approved drugs that act synergistically with remdesivir, many with favorable pharmacokinetic and safety profiles. Strongest effects were observed with established antivirals, Hepatitis C virus nonstructural protein 5A (HCV NS5A) inhibitors velpatasvir and elbasvir. Combination with their partner drugs sofosbuvir and grazoprevir further increased efficacy, increasing remdesivir's apparent potency > 25-fold. We report that HCV NS5A inhibitors act on the SARS-CoV-2 exonuclease proofreader, providing a possible explanation for the synergy observed with nucleoside analog remdesivir. FDA-approved Hepatitis C therapeutics Epclusa® (velpatasvir/sofosbuvir) and Zepatier® (elbasvir/grazoprevir) could be further optimized to achieve potency and pharmacokinetic properties that support clinical evaluation in combination with remdesivir.


Conflict of interest statement

JS is inventor in a patent application on combination treatments for SARS-CoV-2, owned by the University of California. U.S. Patent Application Serial No. 63/053,208, entitled “COMPOSITIONS AND METHODS FOR TREATING VIRAL INFECTIONS” relates to aspects of this work and was filed on July 17th, 2020. XHW, EW, EVD, SBB, LY, CZ, JSt, CDD, TG, XW, SJ, CT, MC, WX, DP, CM, AG, TT, JJR, JJ, AN, SS declare no potential conflict of interest.

Figures

Figure 1
Figure 1
Primary screening results identifying compounds increasing antiviral effects of remdesivir (RDV). (a) Assay outline: Vero-E6 cells are added to 384 well plates, treated with DMSO (left panel) or drug (middle panel), infected with SARS-CoV-2 and incubated for 72 h to observe cytopathic effect (CPE; left panel). Effective drug treatment inhibits occurrence of CPE (middle panel). CPE is measured by quantifying ATP content in viable cells using a luminescent assay (Cell-Titer Glo). The right panel shows the cytotoxicity control, treating cells with drugs but without virus. (b) Screening assay performance. Average Luminescence is shown for the Vero E6 primary screen in presence of EC15 of remdesivir (n = 144, 24 wells each from 6 screening plates), error bars indicate standard deviation. “Uninfected”: positive control (equivalent to 100% inhibition of CPE), “SARS-CoV-2”: negative control, infected and treated with DMSO (equivalent to 0% inhibition of CPE). Z’ = 0.63 ± 0.04. (c) Screening paradigm outline in presence of EC15 of remdesivir. Cells infected with SARS-CoV-2 unless indicated. Dose resp.—Dose response; Valid.—Validation in orthogonal assays. (d) Primary screen results for 1200 approved drugs tested in Vero E6 cells infected with SARS-CoV-2 in the absence (x-axis) and presence (y-axis) of EC15 of remdesivir. Inhibition of CPE (%) is shown. The horizontal line indicates the background activity of EC15 of remdesivir (not subtracted). Diagonal line: 1:1 correlation. Red: high priority hits with a cutoff of > 60% inhibition of CPE in presence of remdesivir. (e) As in (d), but with cell viability data from cytotoxicity control (uninfected) on the x-axis. Vertical line: Cell viability of 70%. (f) Confirmation of > 95% of high priority hits from (e) after compound cherrypicking; assay conditions as in (e), Vero-E6 cells infected with SARS-CoV-2 in presence of EC15 of remdesivir; x-axis indicates primary screening results (Inhibition of CPE, %), y-axis confirmation results (Inhibition of CPE, %). Horizontal and vertical lines indicate hit progression cutoff from primary screen, diagonal line 1:1 correlation. Error bars indicate standard deviation. (g) 26 compounds (red; labeled) are active in both Vero E6 and human lung epithelial Calu-3 cells infected with SARS-CoV-2 in presence of EC15 of remdesivir. Inhibition of CPE (%) is shown on the x-axis for Vero E6, on the y-axis for Calu-3 cells.
Figure 2
Figure 2
Gene set enrichment analysis of drug targets in combinatorial screen. GSEA enrichment plots provide the distribution of the enrichment score (green line) across compounds annotated to molecular targets (vertical black line), ranked in order of antiviral activity (left to right). The enrichment score (ES) reflects the degree to which a gene set is overrepresented at the top of a ranked list of compounds interacting with the given target. GSEA calculates the ES by walking down the ranked list of compounds interacting with the given target, increasing a running-sum statistic when a gene is in the gene set and decreasing it when it is not. Glucocorticoid receptor (p = 0.0001; FDR q value = 0.013), Calcium Channel (p = 0.004; FDR q value = 0.086), Proton pump (p = 0.003; FDR q value = 0.085) and HIV protease (p = 0.007; FDR q value = 0.095) are identified as targets enriched in the hitlist for the synergy screen in background of EC15 of remdesivir.
Figure 3
Figure 3
Synergy of direct-acting HCV antivirals velpatasvir (a)-(d) and elbasvir (e)-(h) with remdesivir in Calu-3 cells infected with SARS-CoV-2. (a) Three-dimensional plot showing synergy of combinations of velpatasvir (x-axis, up to 40 μM) and remdesivir (y-axis, up to 0.6 μM). Z-axis indicates CPE Inhibition (%). Marker colored using a gradient from blue (0% CPE inhibition) to red (100% CPE inhibition). Green—highest concentration of velpatasvir and remdesivir alone, reaching only ~ 20% Inhibition of CPE. Dashed line indicates dose response results of remdesivir and velpatasvir alone. (b) Two-dimensional representation of dose response interaction matrix. X-axis—Remdesivir (up to 10 μM), y-axis: Velpatasvir (up to 40 μM). Color gradient indicates Inhibition of CPE (%); white—0%, red—100%. (c) Topographic two-dimensional map of synergy scores determined in synergyfinder from the data in (a) and (b), axes as in (b), color gradient indicates synergy score (red—highest score). (d) Three-dimensional surface plot representing synergy score (z-axis) for each compound combination. X-axis: remdesivir up to 10 μM, y-axis: velpatasvir up to 40 μM. (e), (f), (g), (h) as in (a), (b), (c), (d) but with elbasvir instead of velpatasvir. (i) Dose response of remdesivir alone (black) and in combination with 10 μM velpatasvir (red). (j) Dose response of remdesivir alone (black) and in combination with 10 μM elbasvir (red).
Figure 4
Figure 4
Velpatasvir and elbasvir enhance remdesivir activity when used in their commercially available co-formulation with sofosbuvir and grazoprevir. All experiments shown are in Calu-3 cells infected with SARS-CoV-2. (a) Left panel: Two-dimensional representation of dose response interaction matrix. X-axis—Remdesivir (up to 10 μM), y-axis: Sofosbuvir (up to 40 μM). Color gradient indicates Inhibition of CPE (%); white–0%, red-100%. Middle panel: Topographic two-dimensional map of synergy scores determined in synergyfinder from the data in (a), axes as in (b), color gradient indicates synergy score (red – highest score). NB coloring scheme and z-axis autoscales to the highest value observed, inflating small changes for weak compounds such as sofosbuvir. (b) As in (a), but remdesivir combined with velpatasvir (up to 10 μM); (c) as in (a) but remdesivir combined with both velpatasvir (up to 10 μM) and sofosbuvir (up to 40 μM); axis indicates sofosbuvir concentration only, Velpatasvir is 4 × lower. (d) Dose response of remdesivir alone (black) and in combination with 10 μM velpatasvir (red) or 10 μM velpatasvir/40 uM sofosbuvir (blue). (e) as in (a), but remdesivir combined with grazoprevir (up to 40 μM). (f) as in (a), but remdesivir combined with elbasvir (up to 40 μM). (g) as in (a), but remdesivir combined with both elbasvir and grazoprevir (both up to 40 μM). (h) Dose response of remdesivir alone (black) and in combination with 10 μM elbasvir (red) or 10uM elbasvir/10 μM grazoprevir (blue).
Figure 5
Figure 5
FDA-approved compounds synergize with low dose remdesivir to inhibit SARS-CoV-2 replication in orthogonal assays. (a) (e)Cell-titer Glo assay measuring ATP content of viable cells 96 h post-infection (hpi) in human lung epithelial Calu-3 cells infected with SARS-CoV-2 (MOI = 0.05). Drug was added at 40 μM except remdesivir, which was added at 0.625 μM (~ EC15), and velpatasvir, which was added at 10 μM to maintain the ratio of 1:4 in the coformulation with sofosbuvir. n = 3, error bars indicate Standard deviation. Asterisk indicates statistical significance with p < 0.05 relative to DMSO control. R: remdesivir; V: velpatasvir; S: sofosbuvir; E: elbasvir; G: grazoprevir (b) (f) infectious virus particle titer leading to 50% of cell death in Vero-E6 cells (TCID50) was determined from the supernatants of (a) and (e) 24hpi; other conditions as in (a) and (e). Dotted line indicates limit of detection in the assay. (c) (g) infection was quantified by direct visualization of virus particles by immunofluorescence assay, detecting number of SARS-CoV-2 nucleoprotein (N stain) 48hpi per infected cell. Other conditions were as in (a) and (e). For remdesivir/velpatasvir/sofosbuvir, results were not statistically significantly different from uninfected control cells (p = 0.18), as was the case with remdesivir/elbasvir/grazoprevir (p = 0.07) (d) (h) RT-qPCR quantifying SARS-CoV-2 genome equivalents of Calu-3 cells treated with the indicated drug combinations and infected with SARS-CoV-2 at MOI of 0.05 for 48hpi. (i) Representative images from (c) and (g), Calu-3 cells infected with SARS-CoV-2 48hpi. Scale bar corresponds to 100 μM.
Figure 6
Figure 6
FDA-approved compounds synergize with low dose remdesivir in primary human bronchial epithelial cells. (a) (b) RT-qPCR quantifying SARS-CoV-2 genome equivalents at 96hpi of Normal Human Bronchial Epithelial (NHBE) cells transiently expressing hACE2 treated with the indicated drug combinations and infected with SARS-CoV-2 at MOI of 5. Drug was added at 40 μM except remdesivir, which was added at (a) 0.37 μM or (b) 0.13 μM, and velpatasvir, which was added at 10 mM to maintain the ratio of 1:4 in dosing with its combination sofosbuvir. Data represent four combined replicates from three independent experiments and genome copy number was normalized to DMSO within the same experiment. R: remdesivir; V: velpatasvir; S: sofosbuvir; E: elbasvir; G: grazoprevir.
Figure 7
Figure 7
Inhibition of SARS-CoV-2 exonuclease activity by velpatasvir for remdesivir (R) terminated RNA. A mixture of 500 nM RNAs (sequences shown in (a), (j)) and 50 nM SARS-CoV-2 pre-assembled exonuclease complex (nsp14/nsp10) was incubated in buffer solution at 37 °C for 15 min in the absence (b), (f), (k) or presence of varying amounts of velpatasvir (c-e), (l), elbasvir (g), daclatasvir (h) or ledipasvir (i). The intact RNAs (a), (j) and the products of the exonuclease reaction (b-i), (k-l) were analyzed by MALDI-TOF MS. The signal intensity in each graph was normalized to the highest peak. In (a-i) the peak at 8165 Da corresponds to the full-length RNA and in (j-l) the peak at 8209 Da corresponds to remdesivir (R)-terminated RNA. In the absence of velpatasvir or elbasvir, exonuclease activity caused nucleotide cleavage from the 3’-end of the RNA as shown by the lower molecular weight fragments corresponding to cleavage of 1–7 nucleotides (b), (f), (k). In the presence of velpatasvir, elbasvir, daclatasvir or ledipasvir, exonuclease activity was significantly reduced as shown by the reduced intensities of the fragmentation peaks and increased peak of the intact RNA (c-e), (g-i), (l).

Similar articles

Cited by

References

    1. Yang, X. et al. Clinical course and outcomes of critically ill patients with SARS-CoV-2 pneumonia in Wuhan, China: A single-centered, retrospective, observational study. Lancet Respir. Med.8, 475–481. 10.1016/S2213-2600(20)30079-5 (2020). - PMC - PubMed
    1. Romagnoli, S., Peris, A., Gaudio, A. R. D. & Geppetti, P. SARS-CoV-2 and COVID-19: From the bench to the bedside. Physiol. Rev.100, 1455–1466. 10.1152/physrev.00020.2020 (2020). - PMC - PubMed
    1. Zhang, H. et al. Histopathologic Changes and SARS-CoV-2 Immunostaining in the Lung of a Patient With COVID-19. Ann Intern Med.172(9), 629–632, (2020) 10.7326/m20-0533. - PMC - PubMed
    1. Oxley, T. J. et al. Large-vessel stroke as a presenting feature of Covid-19 in the young. N. Engl. J. Med.382, e60. 10.1056/NEJMc2009787 (2020). - PMC - PubMed
    1. Spagnolo, P. et al. Pulmonary fibrosis secondary to COVID-19: A call to arms?. Lancet Respir. Med.8, 750–752. 10.1016/S2213-2600(20)30222-8 (2020). - PMC - PubMed

Publication types