. 2022 Nov;611(7936):578-584.
doi: 10.1038/s41586-022-05380-y. Epub 2022 Nov 2.

Inulin fibre promotes microbiota-derived bile acids and type 2 inflammation

Collaborators, Affiliations

Inulin fibre promotes microbiota-derived bile acids and type 2 inflammation

Mohammad Arifuzzaman et al. Nature. 2022 Nov.

Abstract

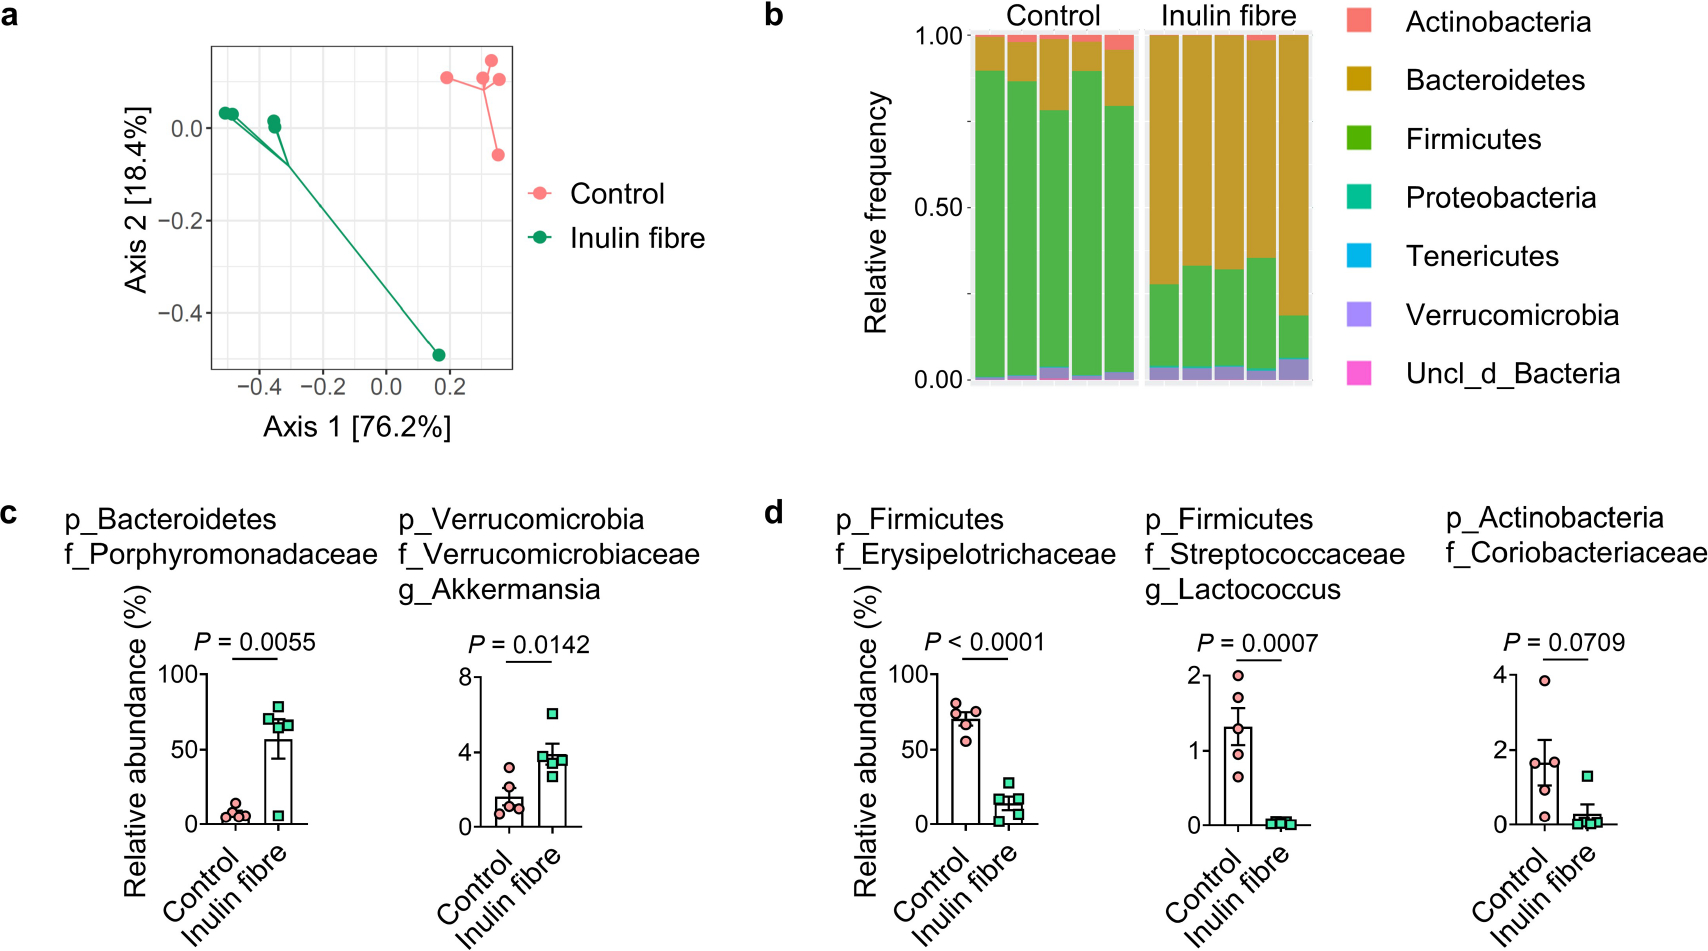
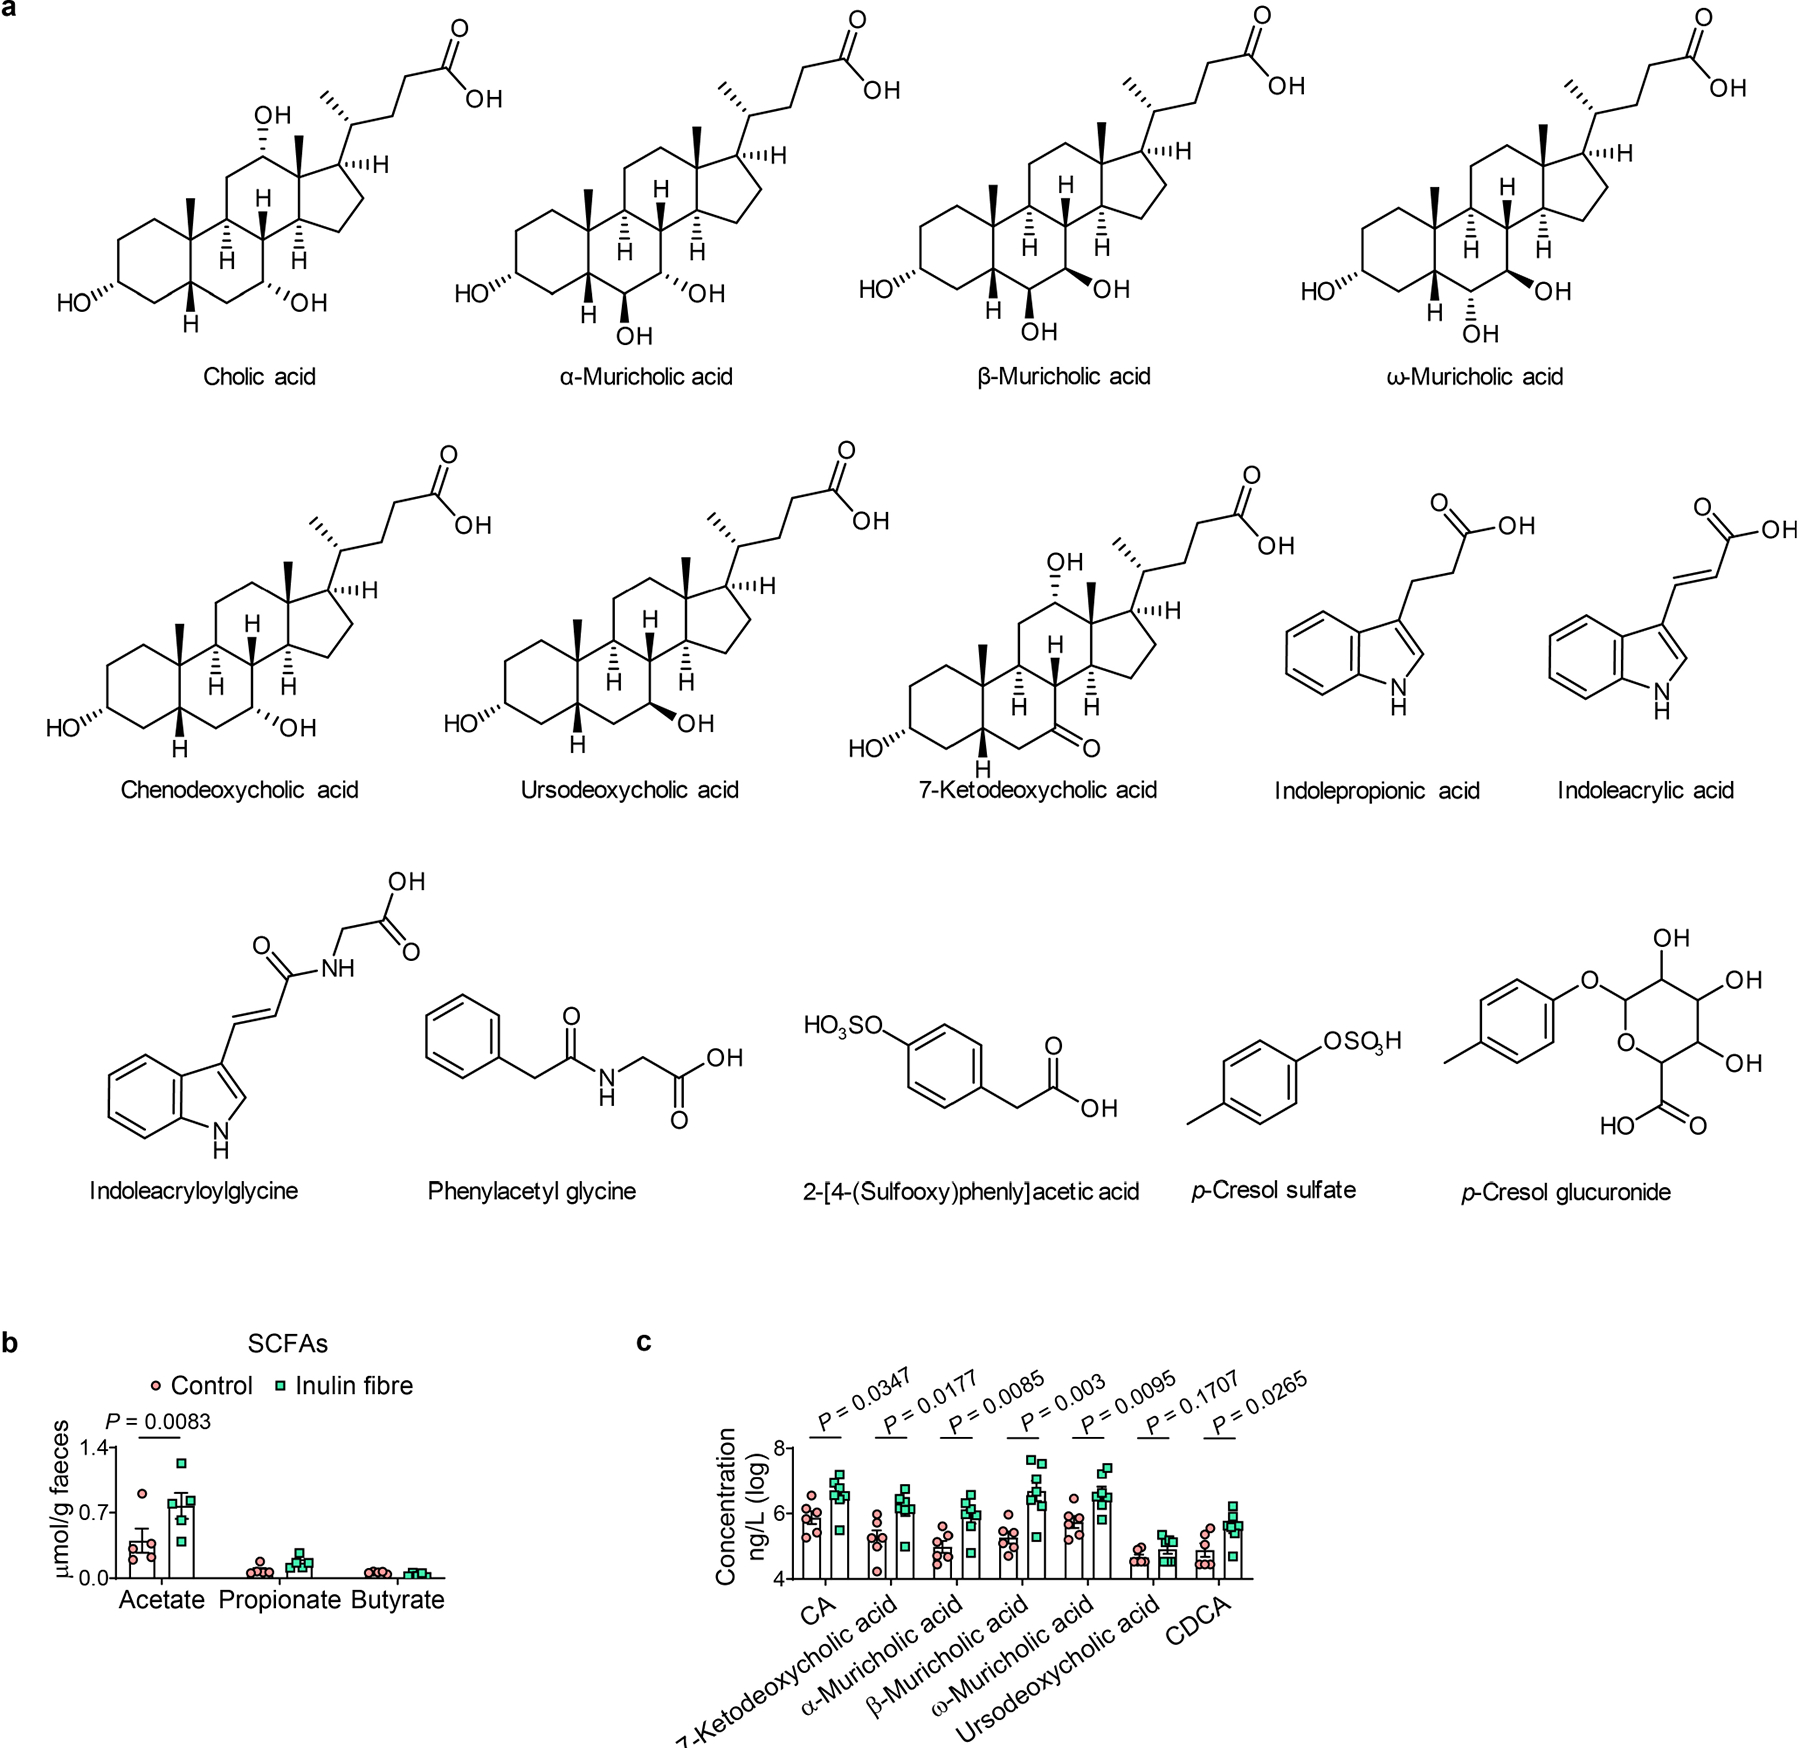
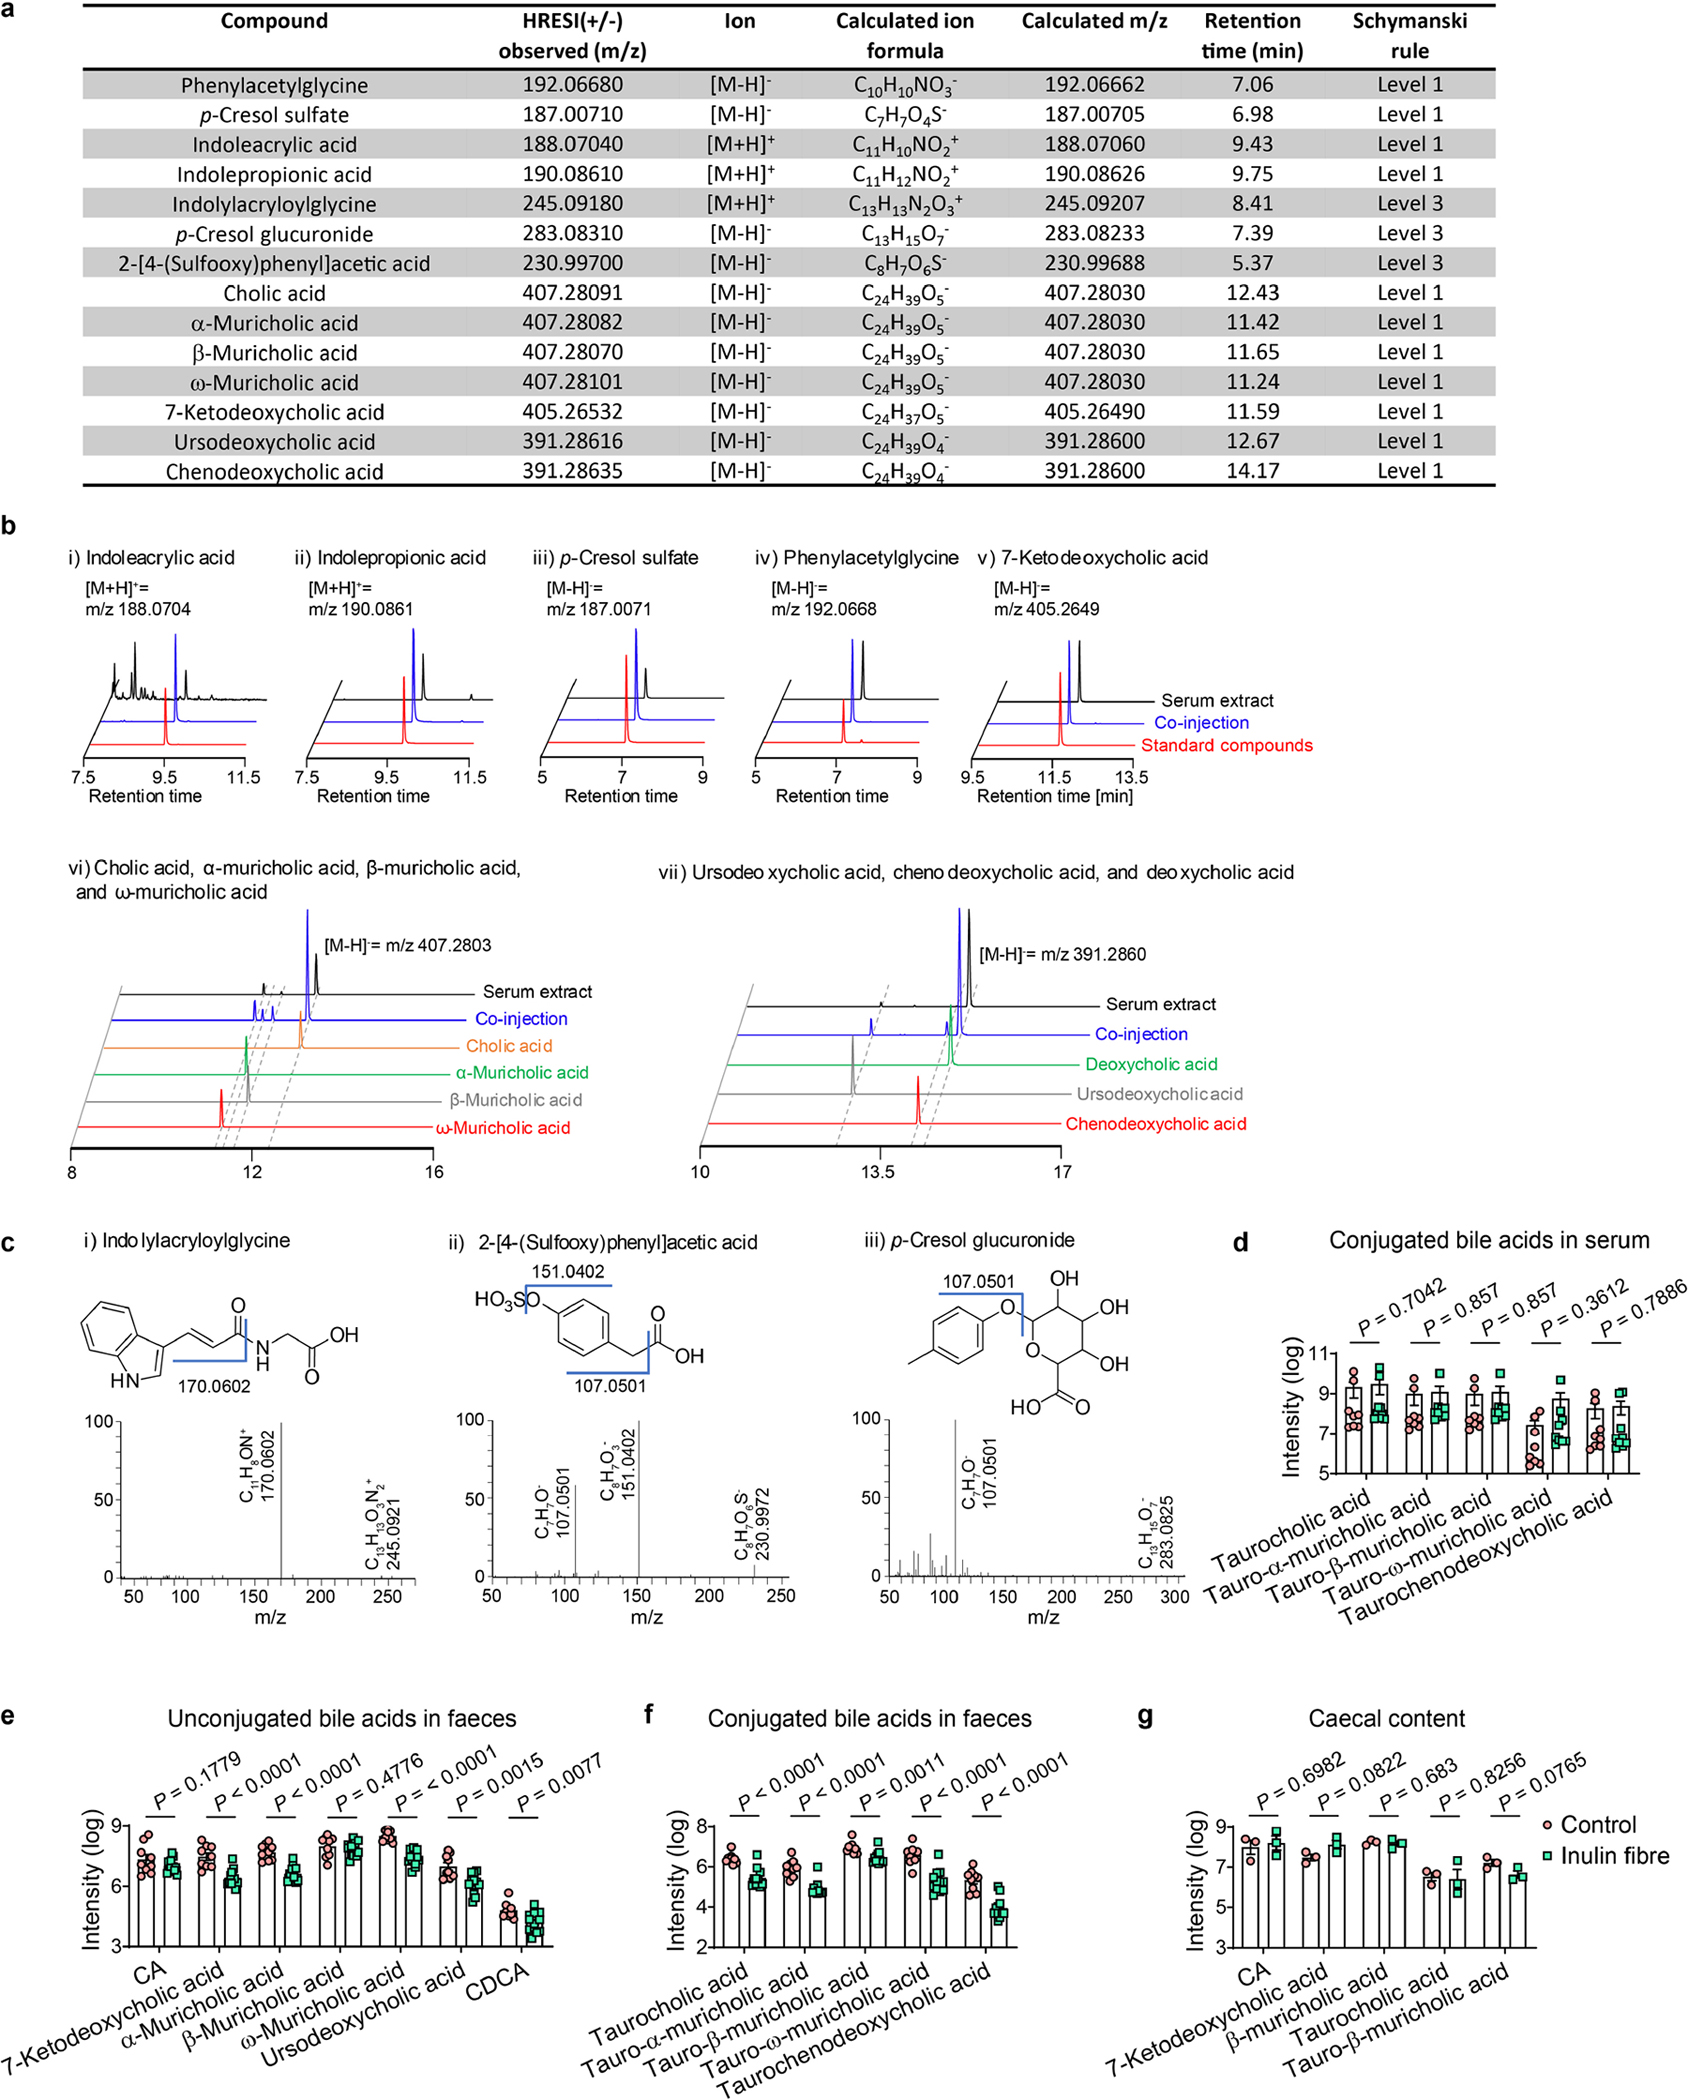
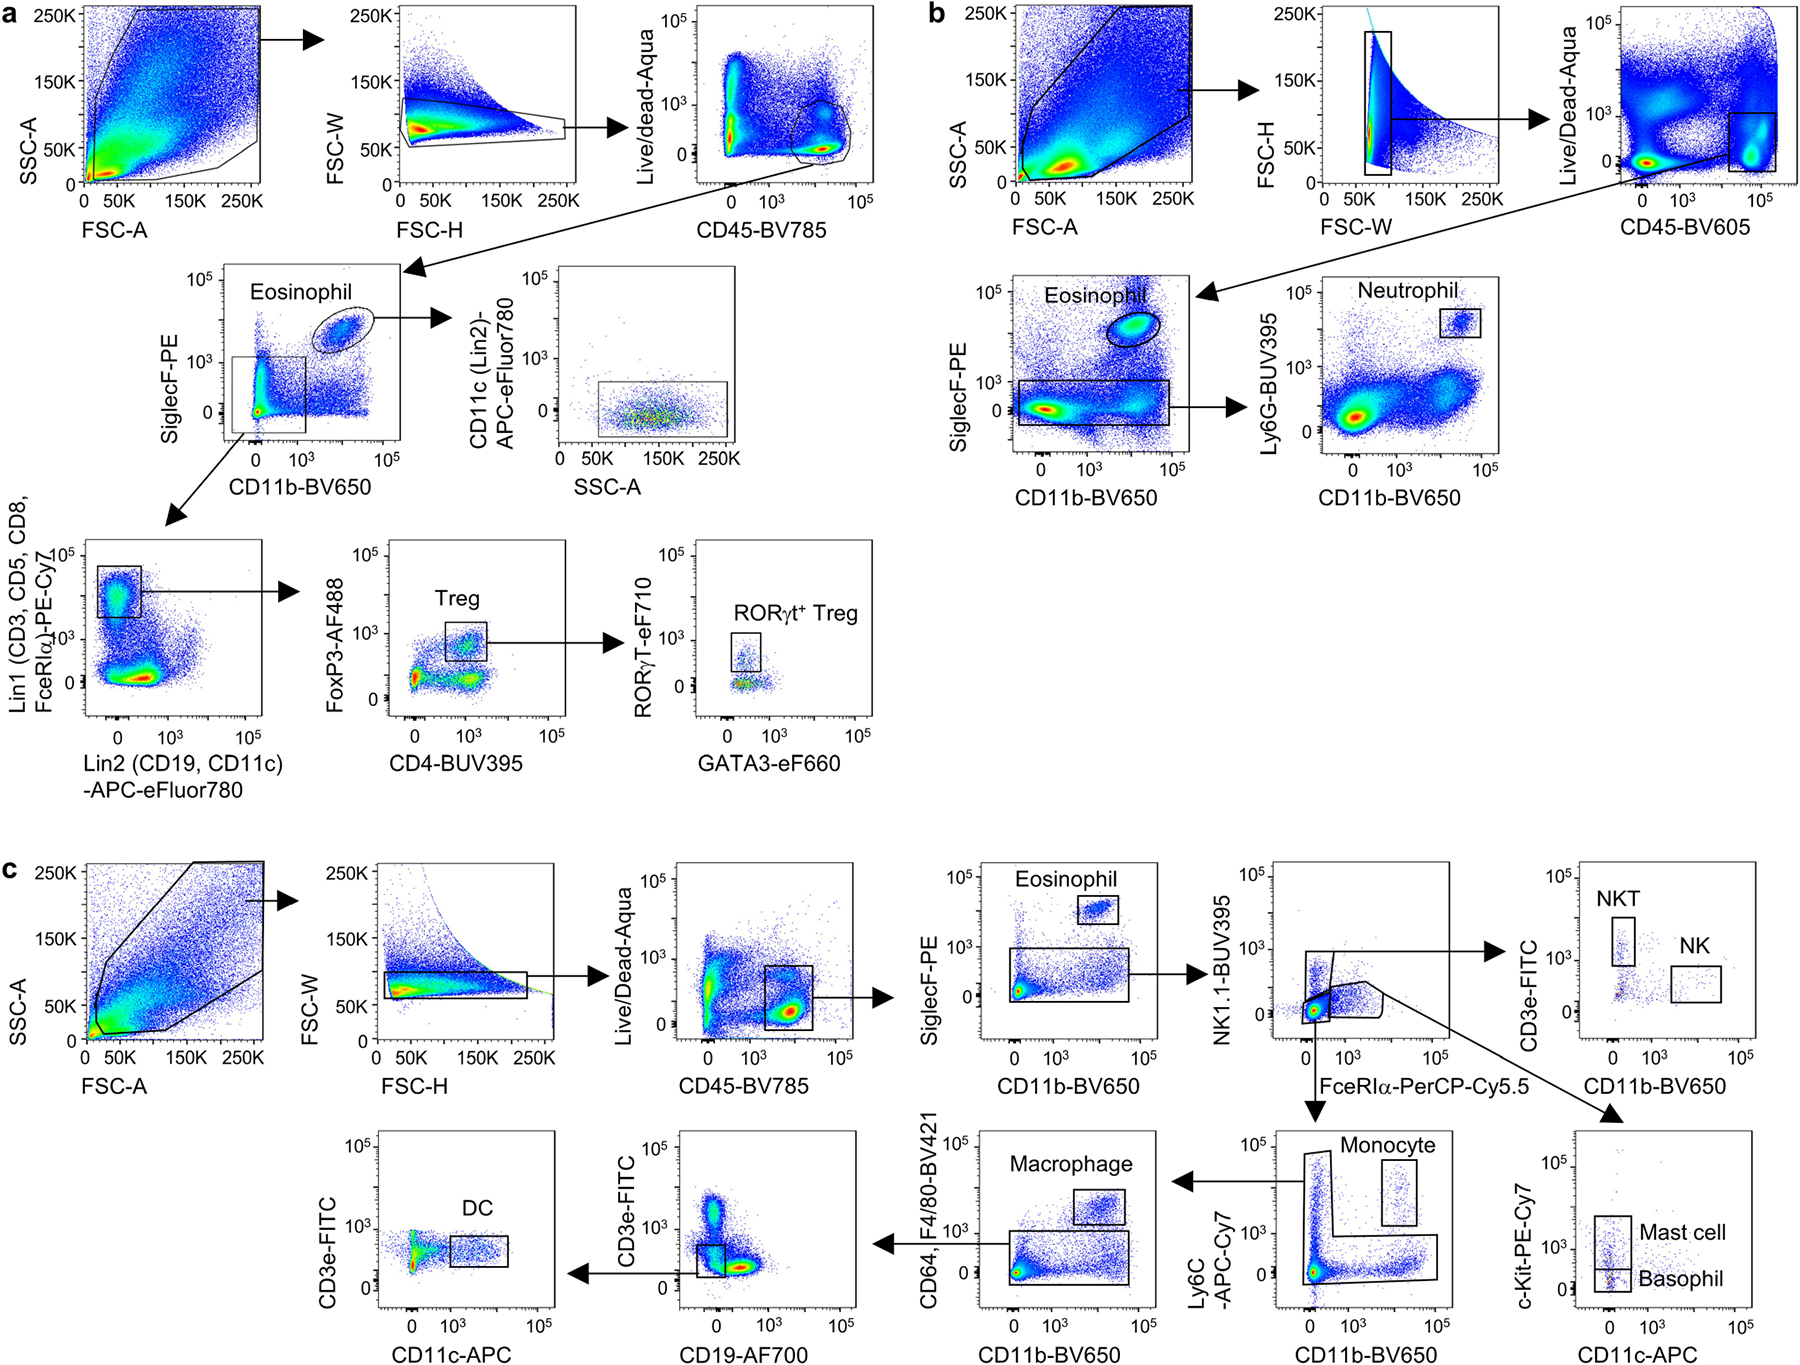
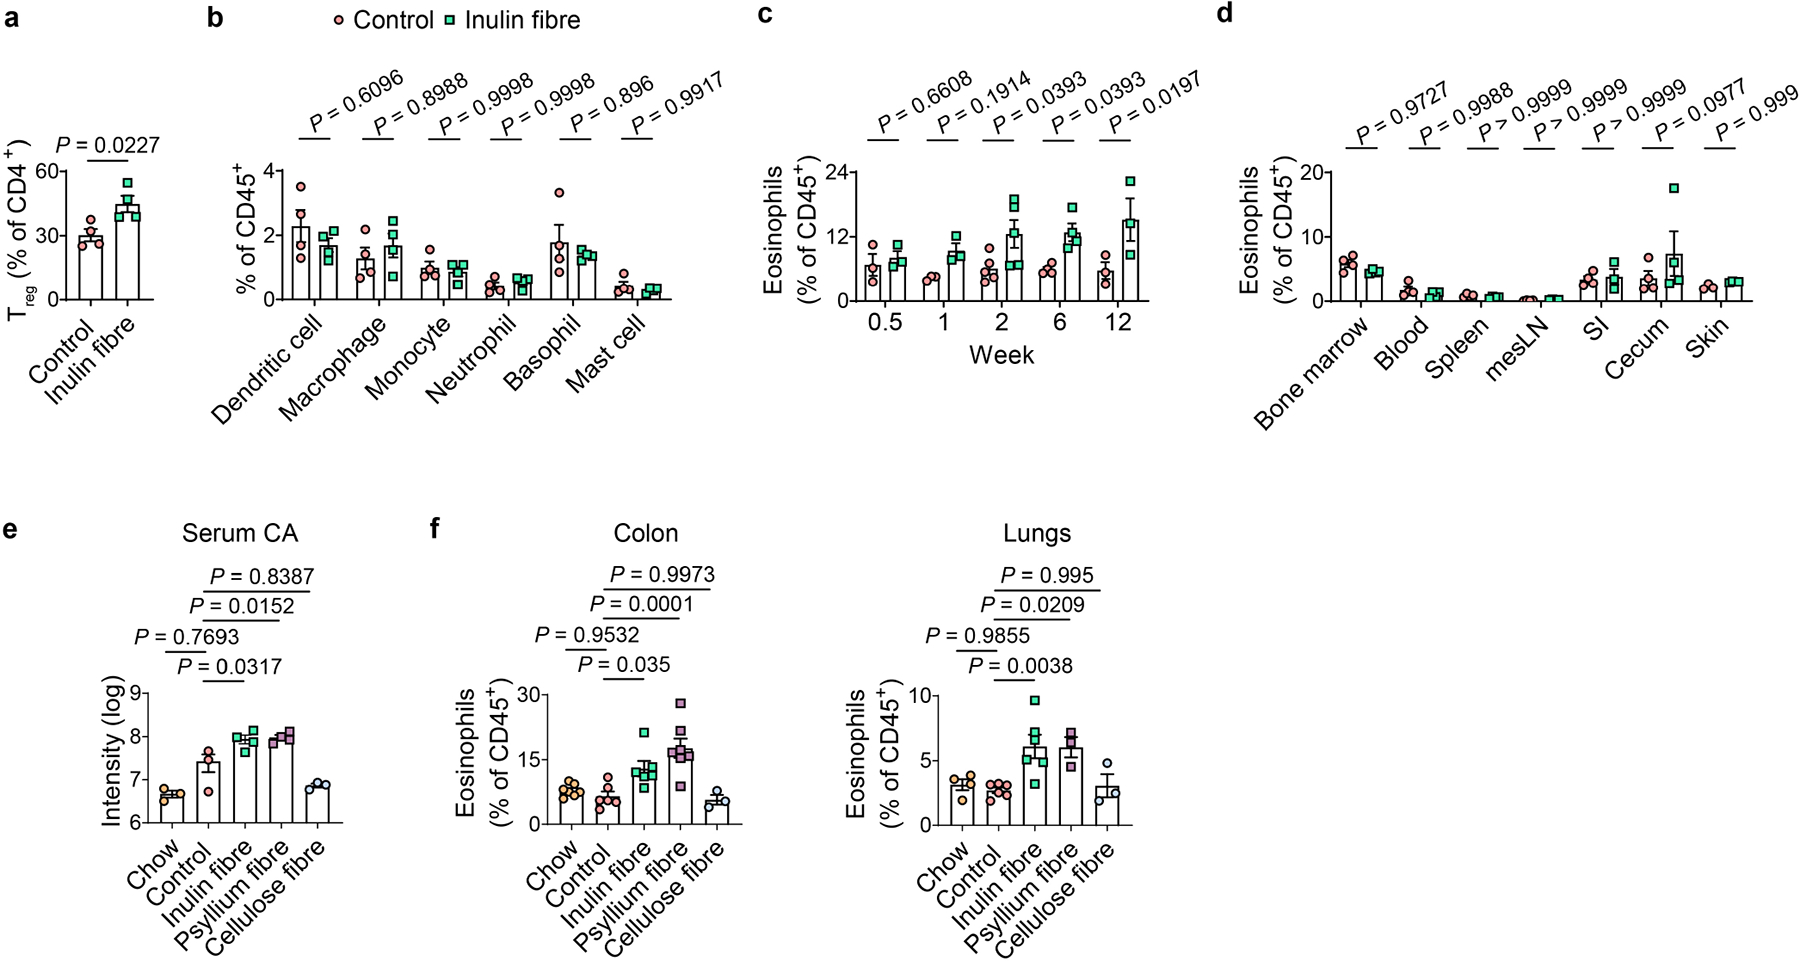
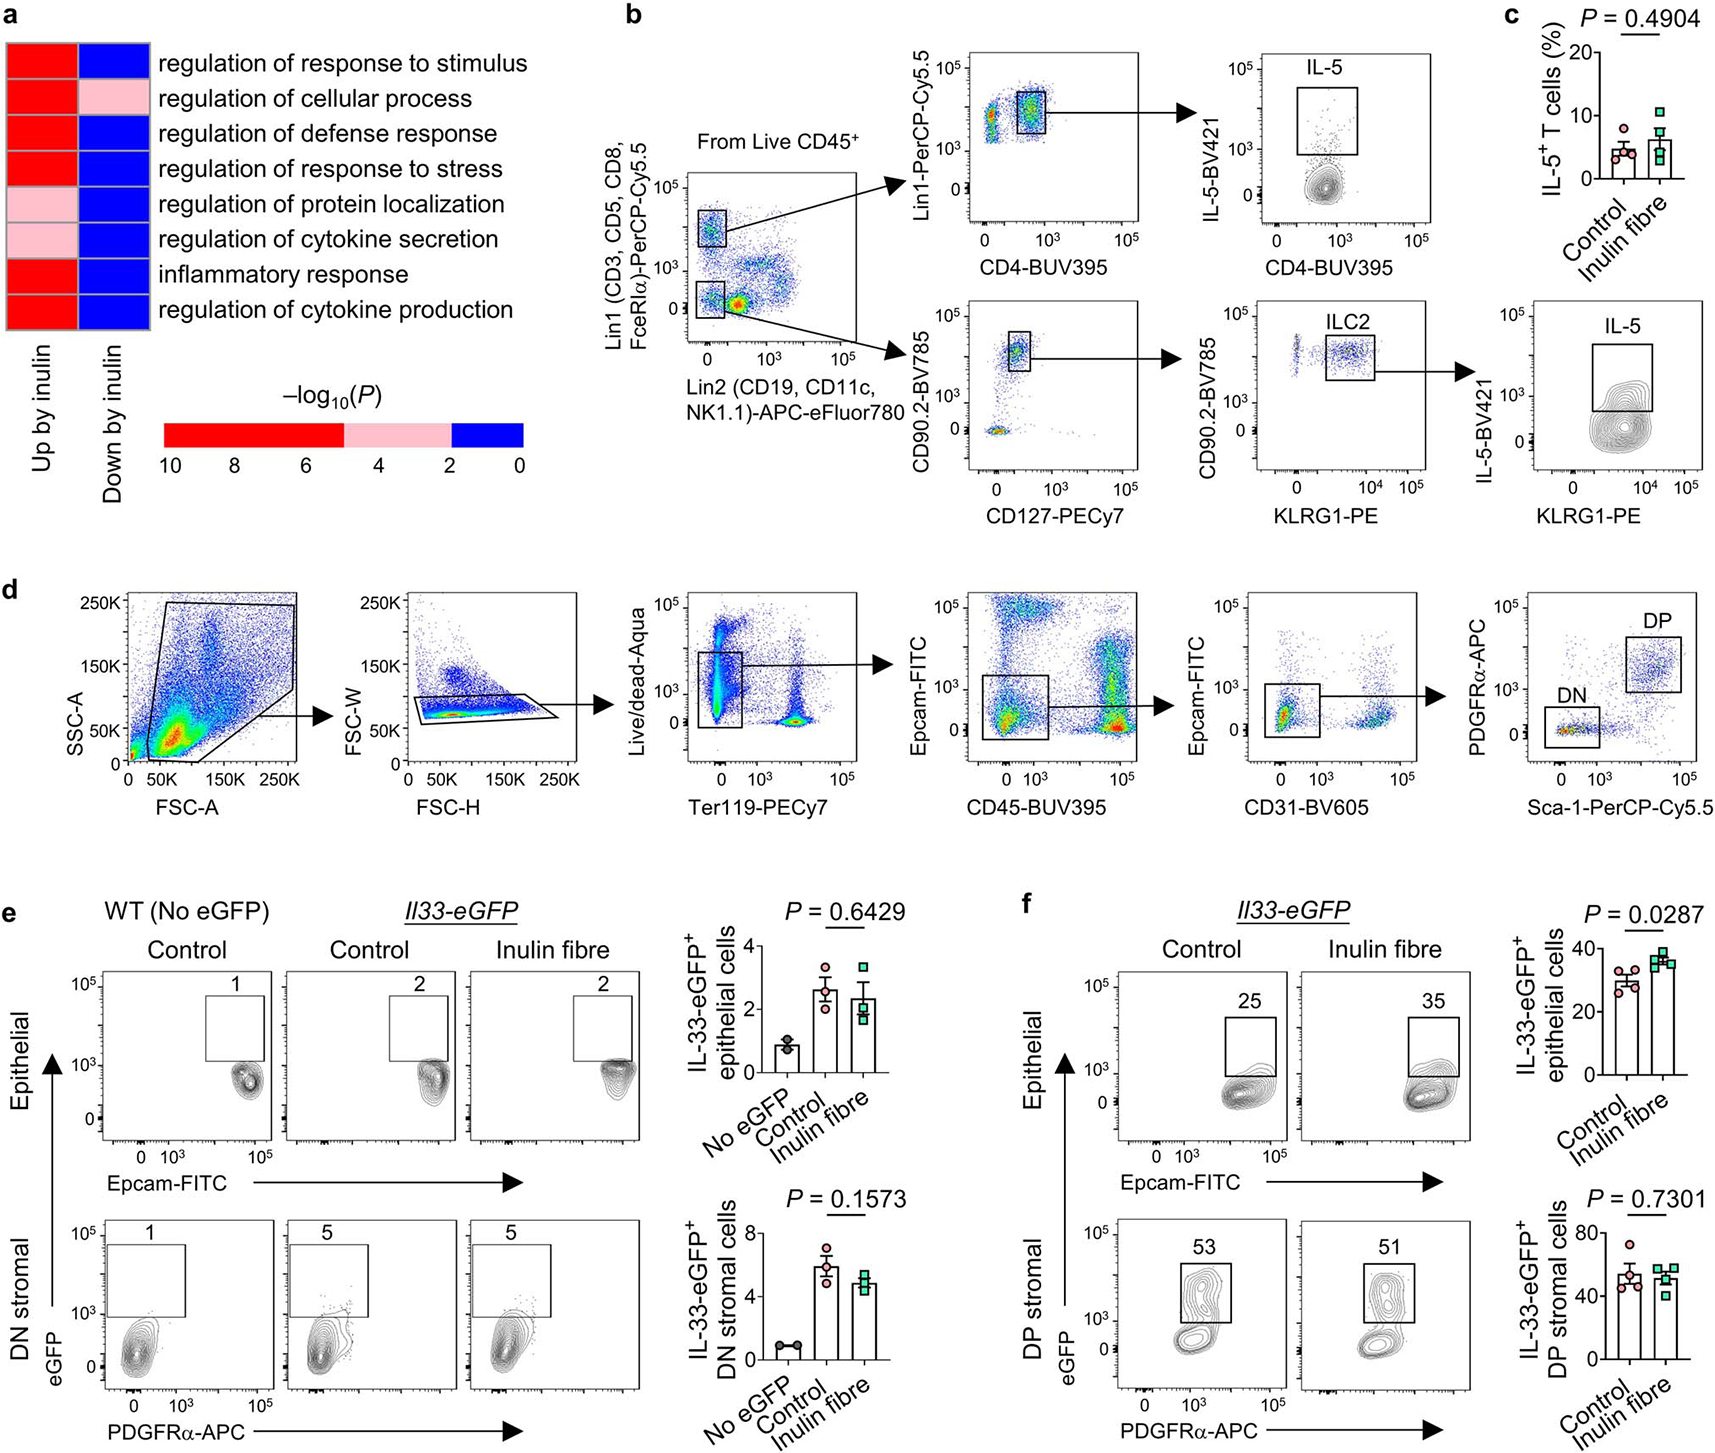
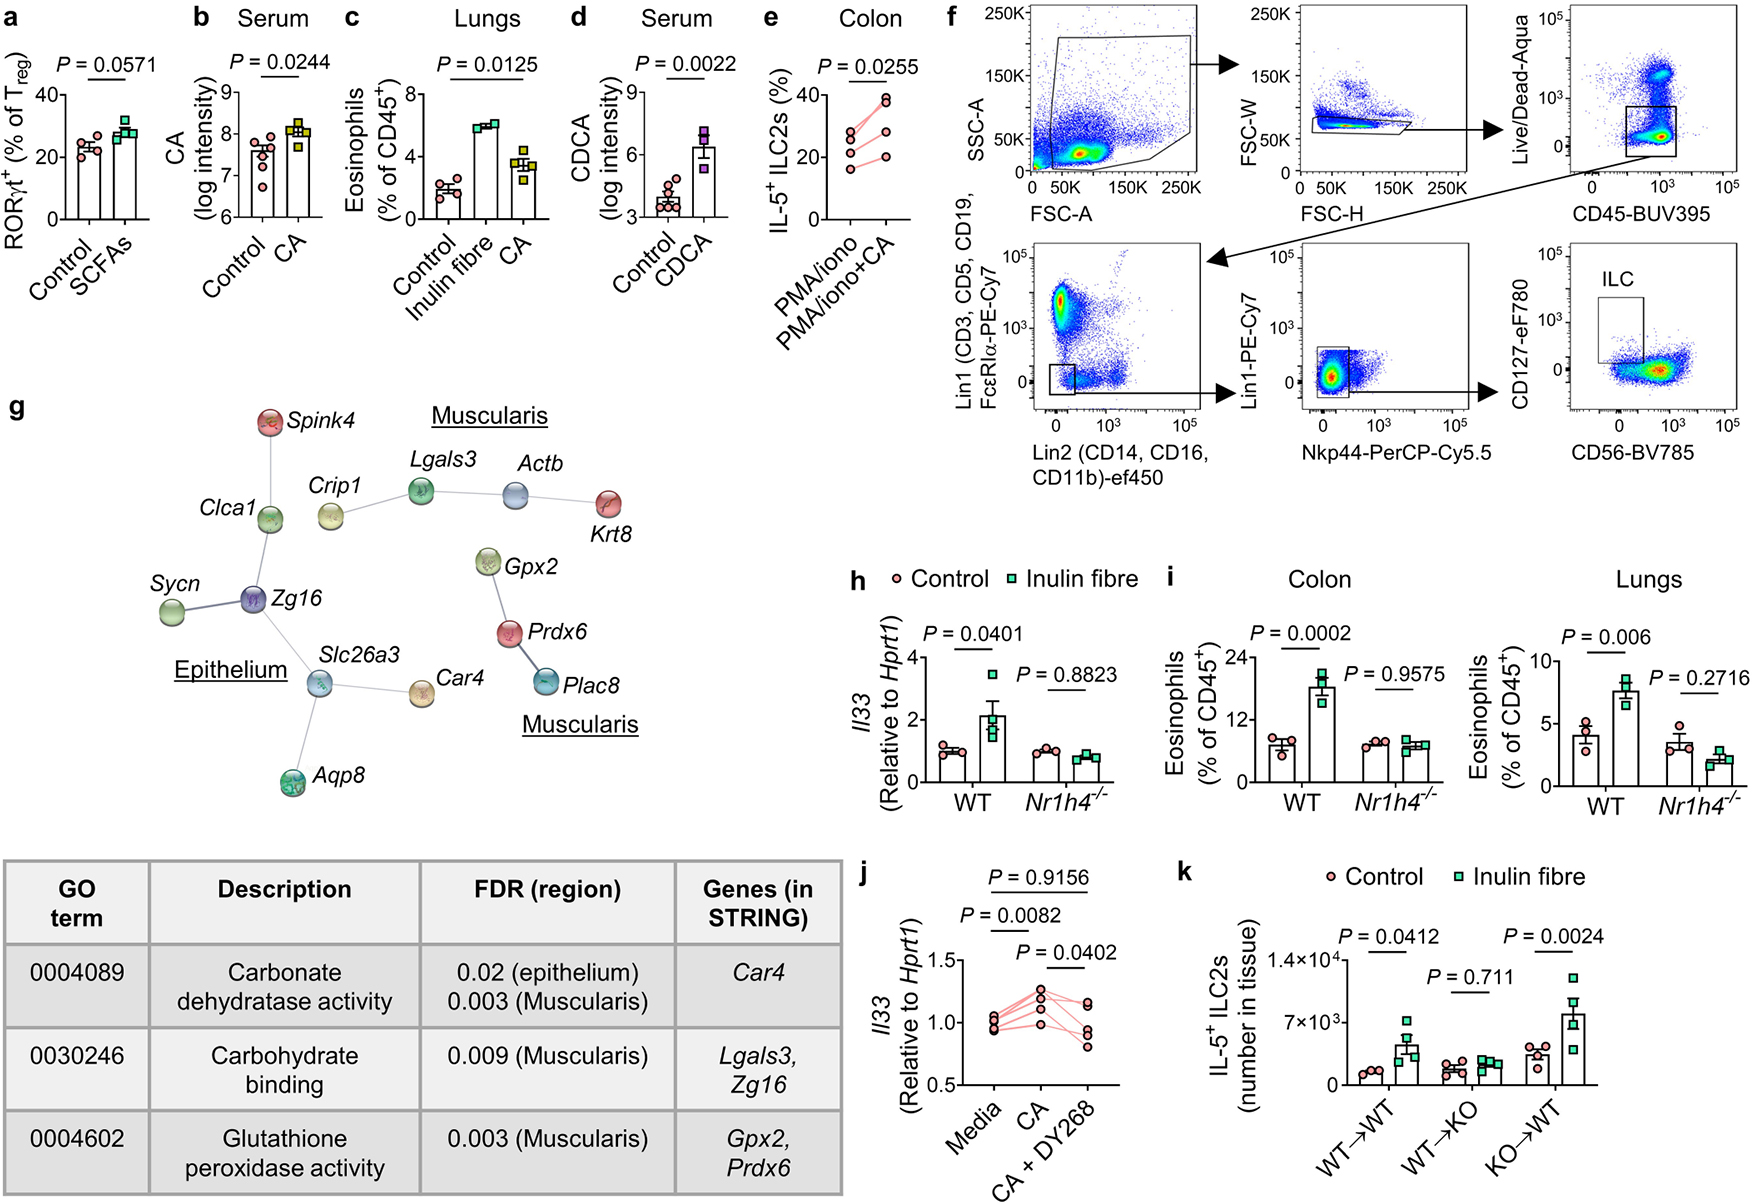
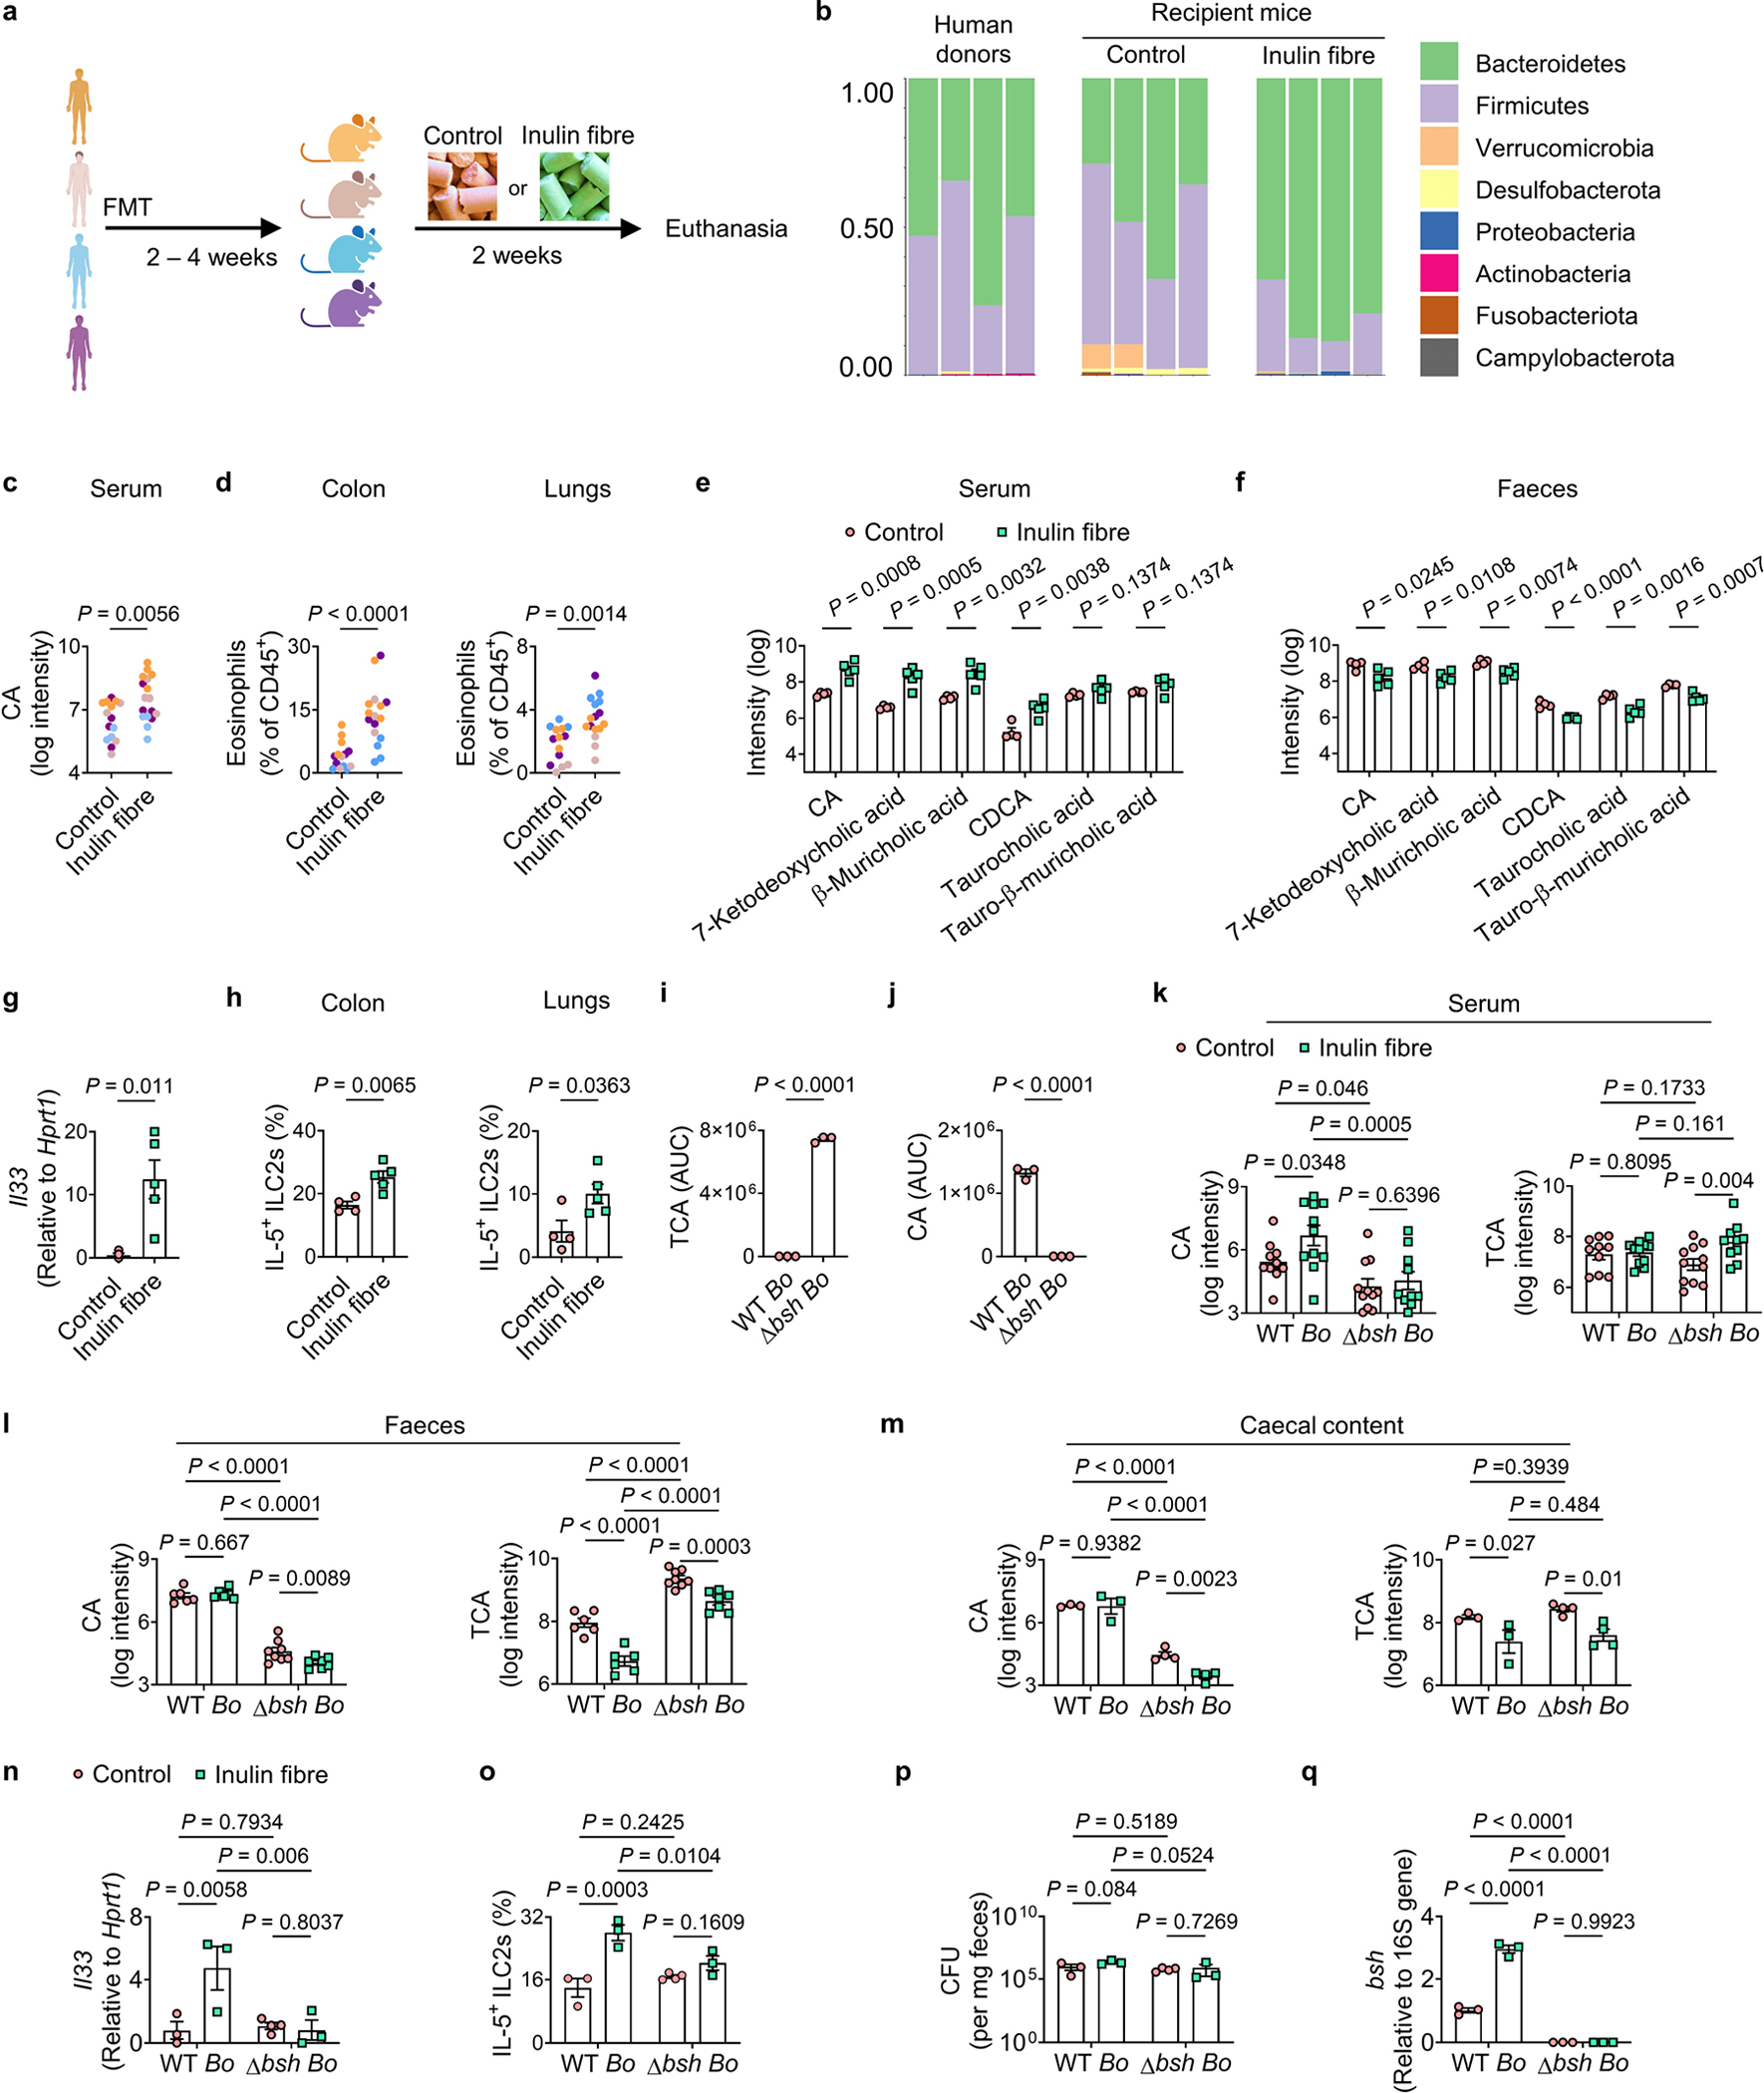
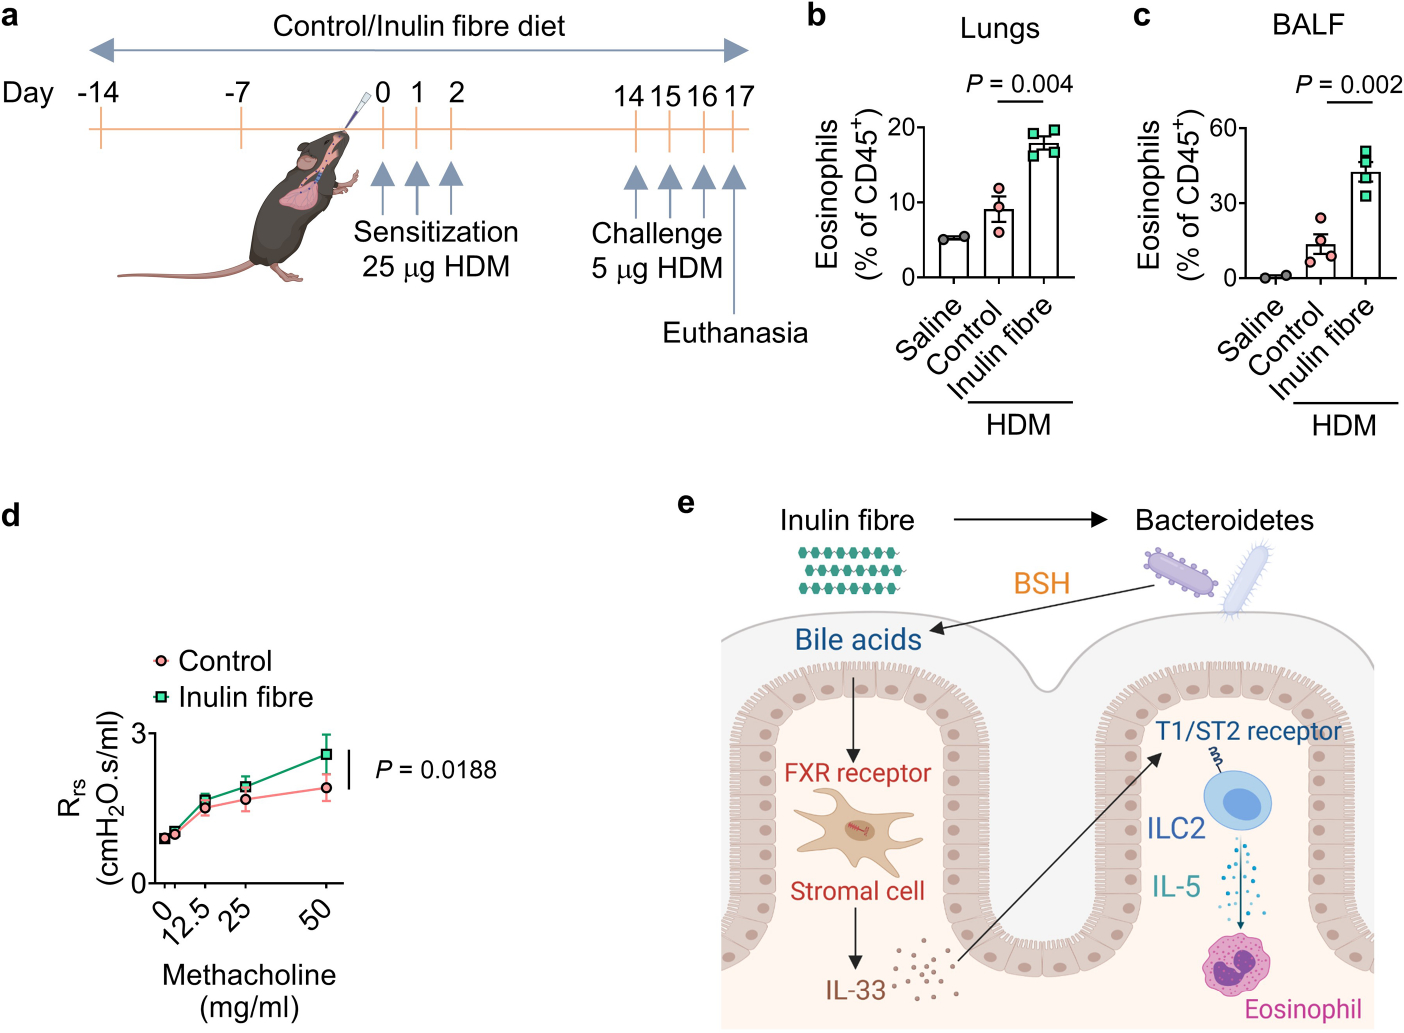
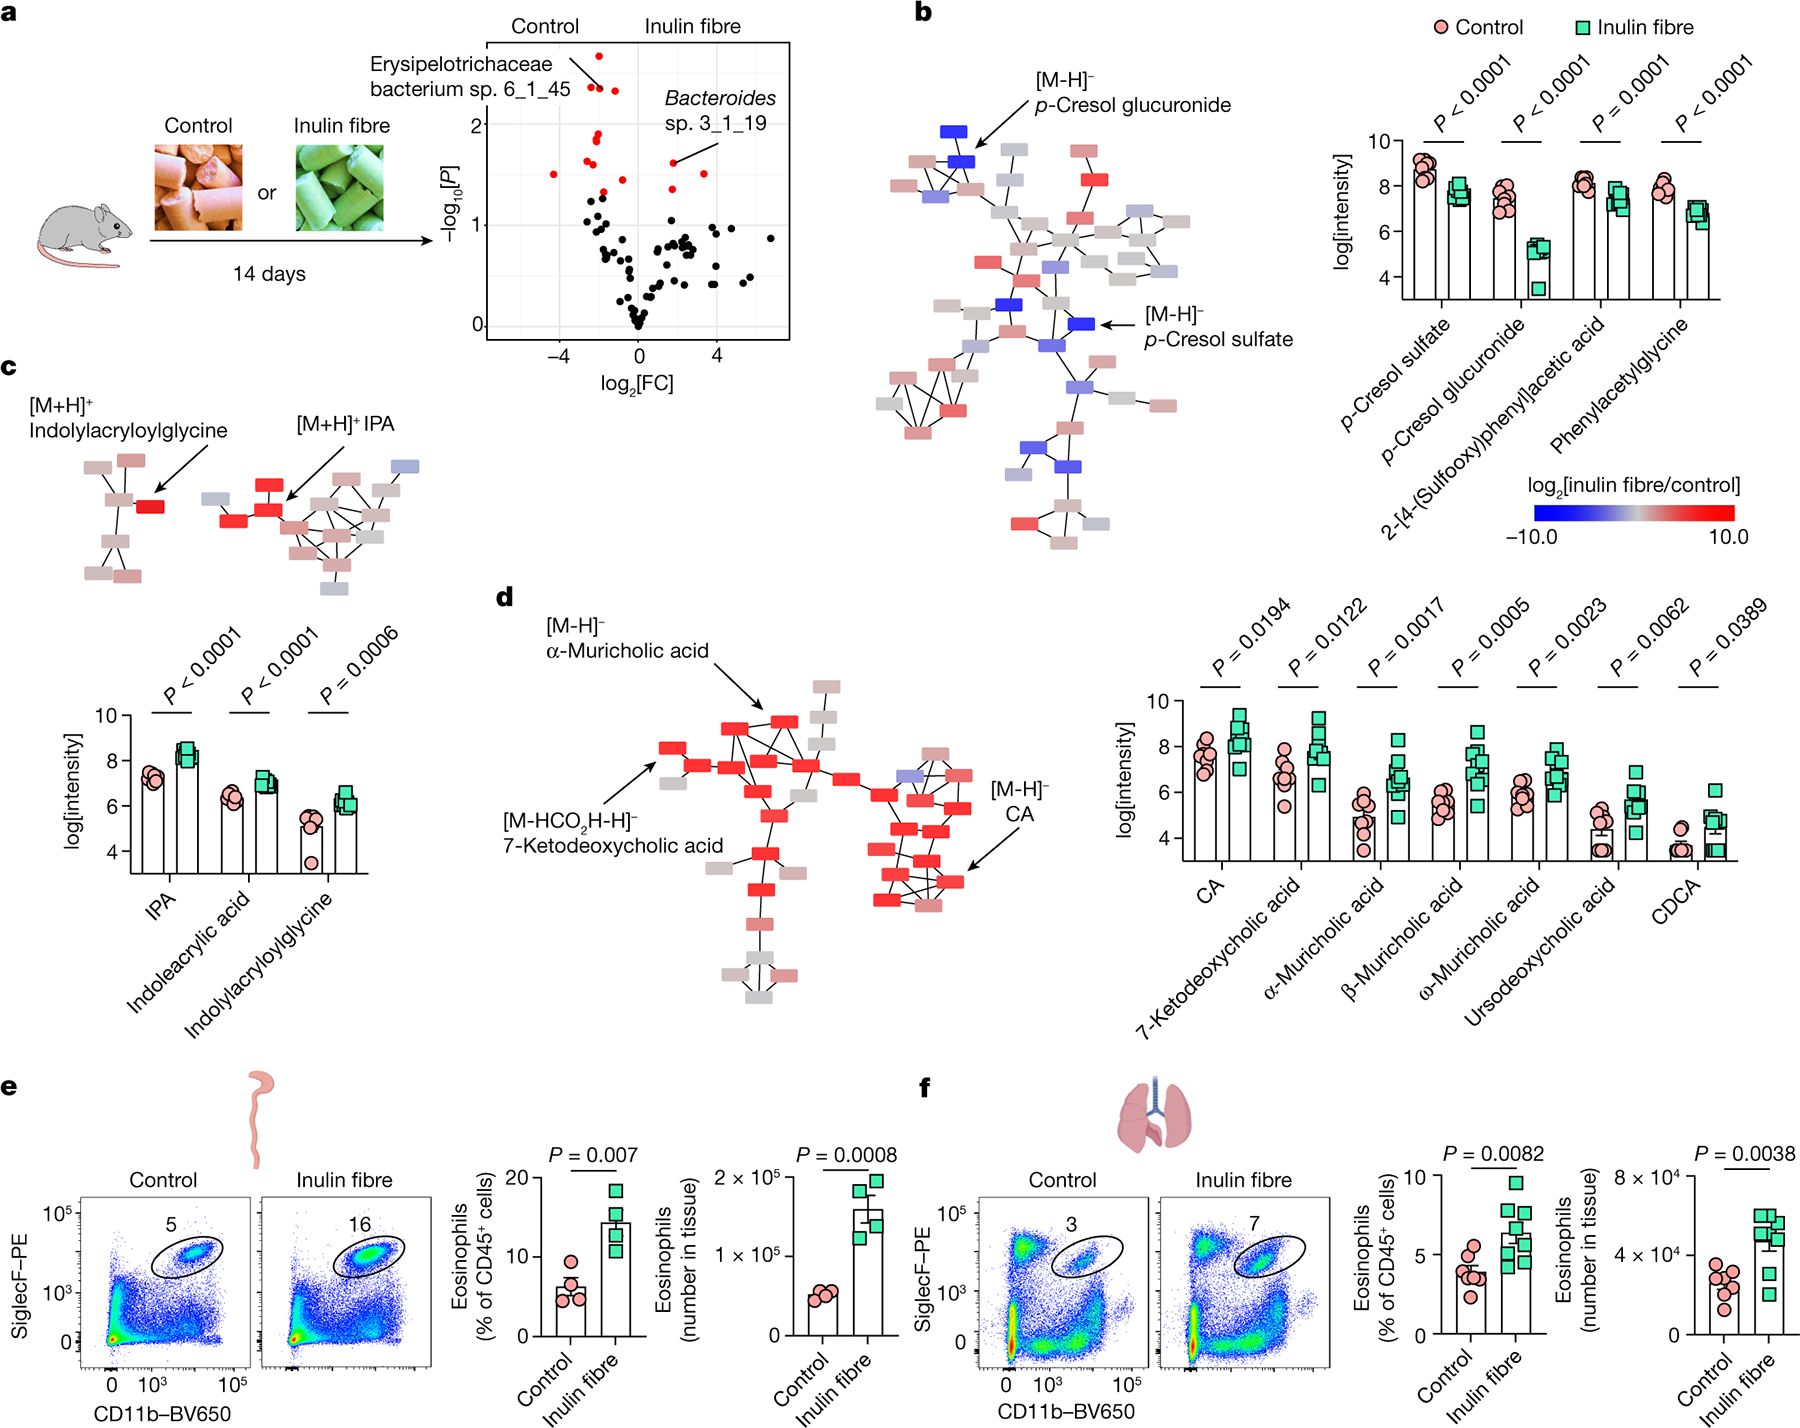
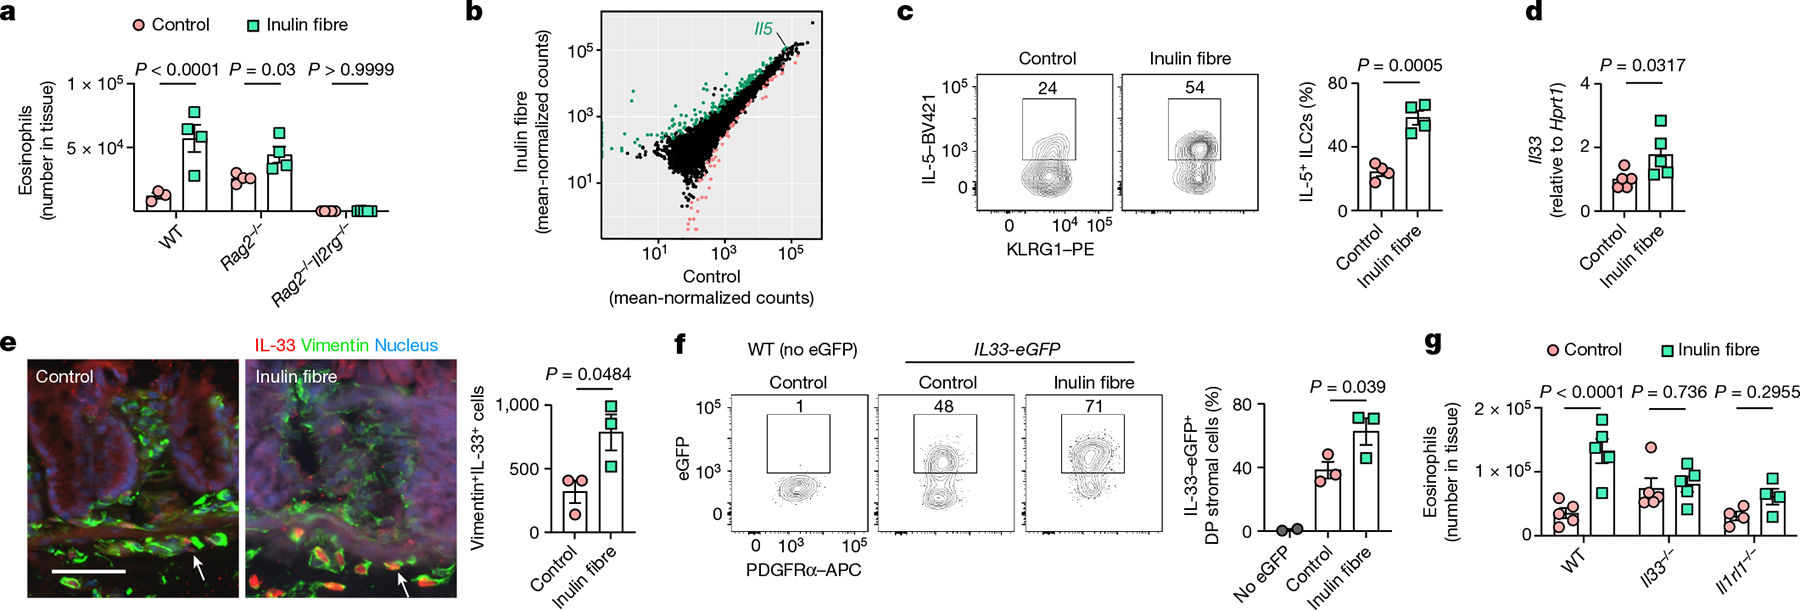
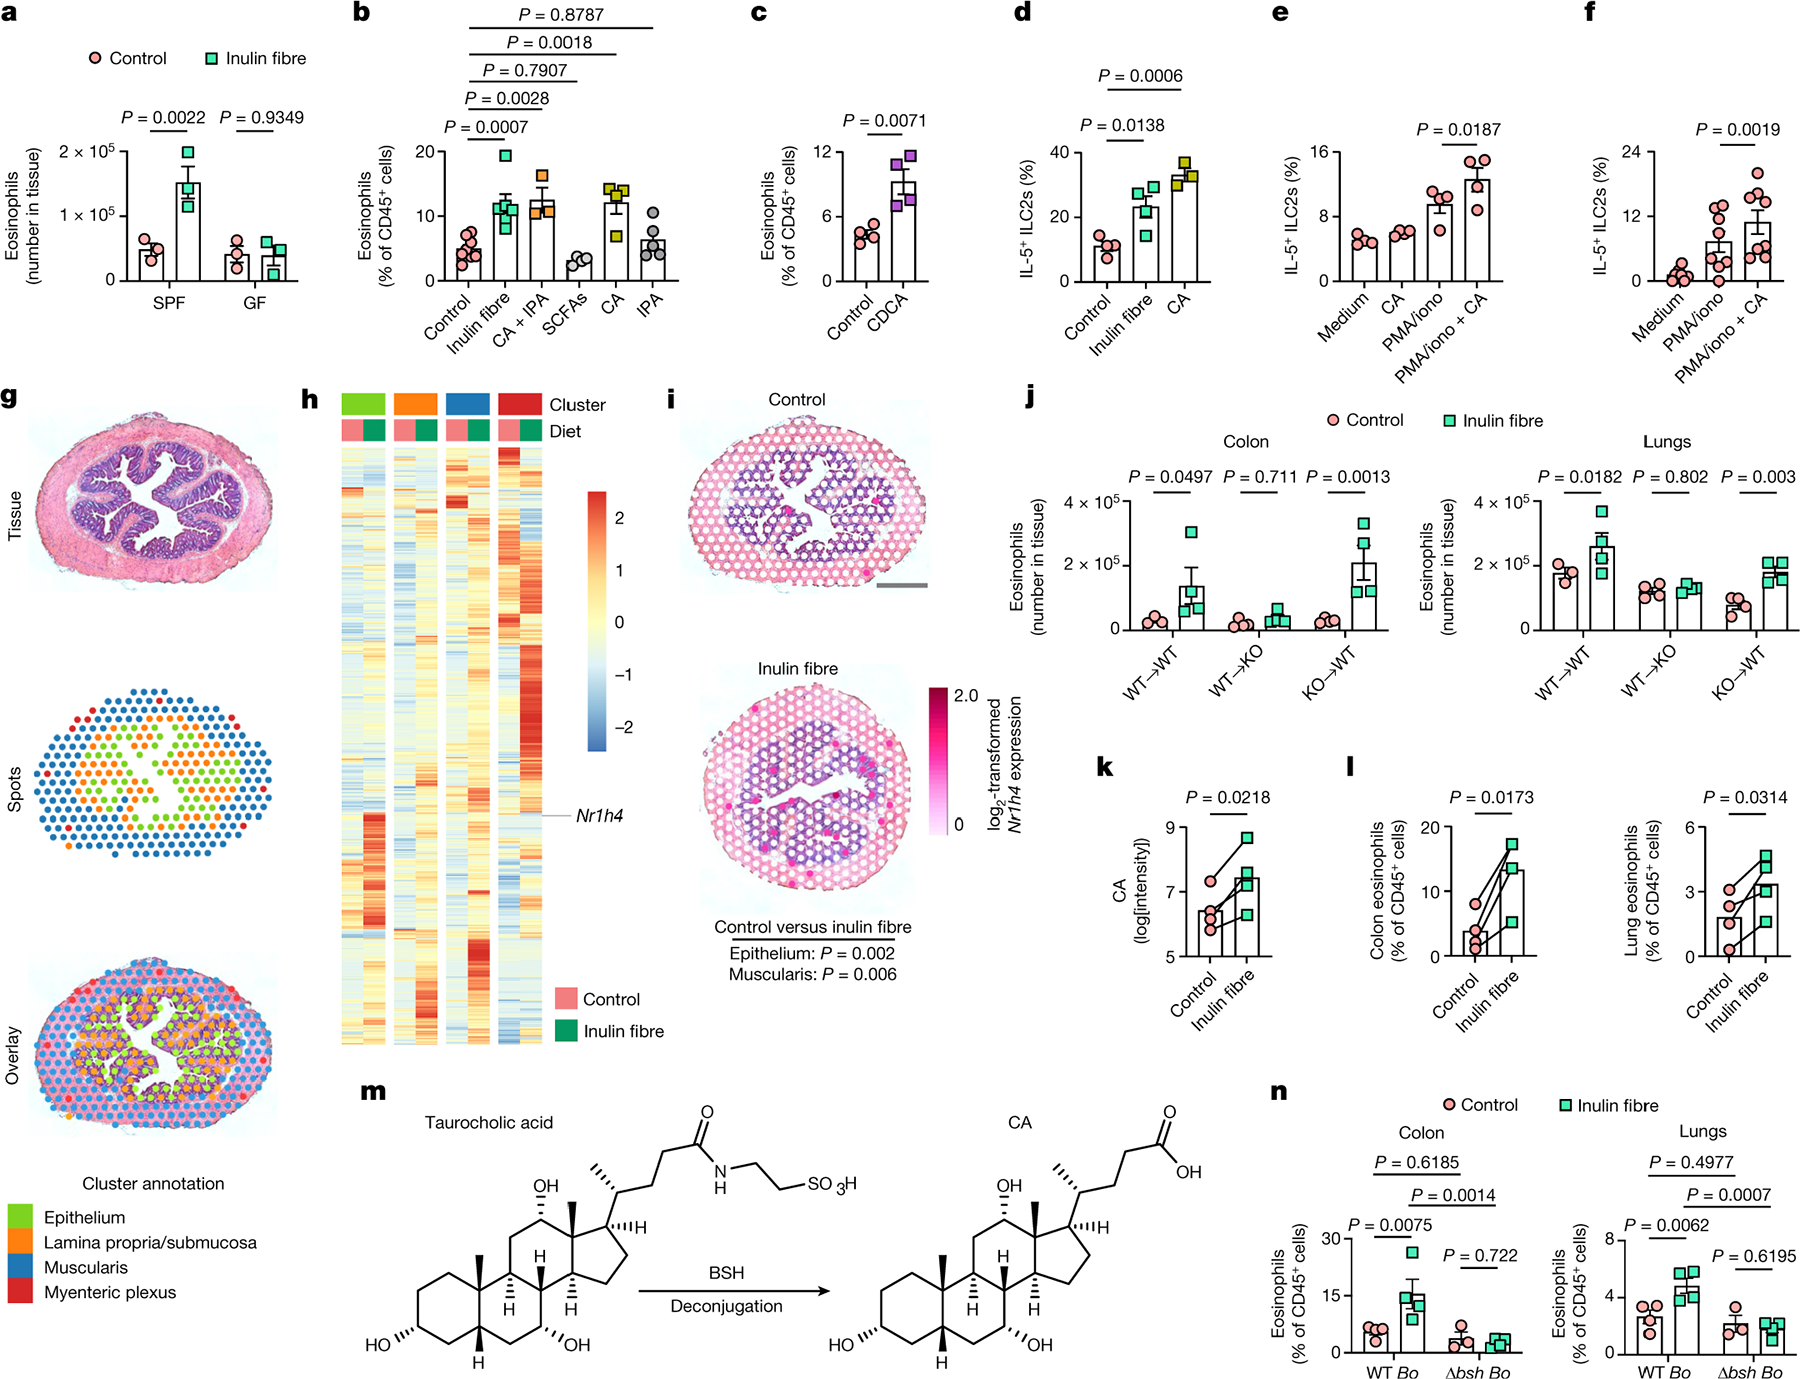
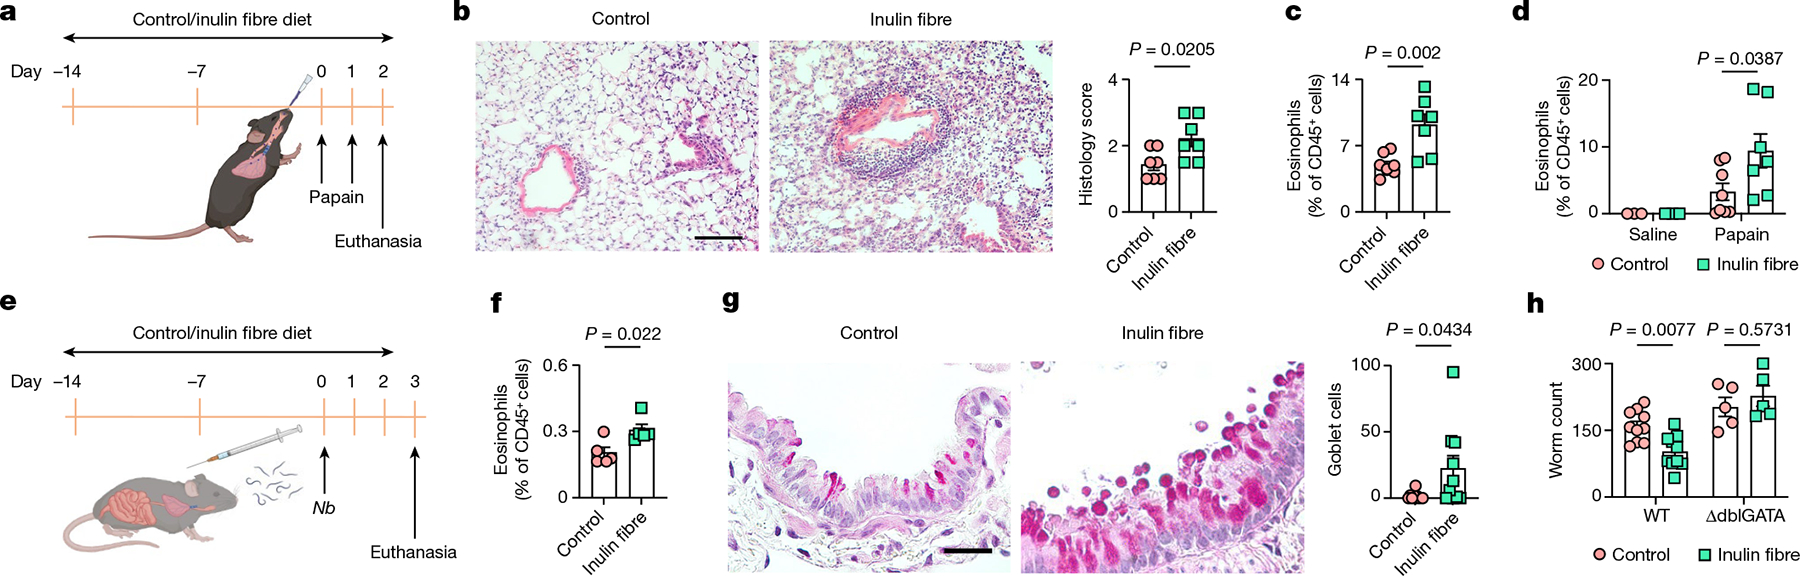
Dietary fibres can exert beneficial anti-inflammatory effects through microbially fermented short-chain fatty acid metabolites<sup>1,2</sup>, although the immunoregulatory roles of most fibre diets and their microbiota-derived metabolites remain poorly defined. Here, using microbial sequencing and untargeted metabolomics, we show that a diet of inulin fibre alters the composition of the mouse microbiota and the levels of microbiota-derived metabolites, notably bile acids. This metabolomic shift is associated with type 2 inflammation in the intestine and lungs, characterized by IL-33 production, activation of group 2 innate lymphoid cells and eosinophilia. Delivery of cholic acid mimics inulin-induced type 2 inflammation, whereas deletion of the bile acid receptor farnesoid X receptor diminishes the effects of inulin. The effects of inulin are microbiota dependent and were reproduced in mice colonized with human-derived microbiota. Furthermore, genetic deletion of a bile-acid-metabolizing enzyme in one bacterial species abolishes the ability of inulin to trigger type 2 inflammation. Finally, we demonstrate that inulin enhances allergen- and helminth-induced type 2 inflammation. Taken together, these data reveal that dietary inulin fibre triggers microbiota-derived cholic acid and type 2 inflammation at barrier surfaces with implications for understanding the pathophysiology of allergic inflammation, tissue protection and host defence.


Conflict of interest statement

Competing interests D.A. has contributed to scientific advisory boards at Pfizer, Takeda, FARE and the KRF. F.C.S. is a cofounder of Ascribe Bioscience and Holoclara. The other authors declare no competing interests.

Figures

Extended Data Fig. 1 |
Extended Data Fig. 1 |. Changes in gut microbiota by inulin fibre diet.
a–d, Mice were fed the control or inulin fibre diets for two weeks (n = 5 mice). Weighted UniFrac PCoA (a) and taxonomic classification (b) of 16S rRNA in stool pellets were shown. For PCoA plot PERMANOVA: F = 12.6, Df = 1, P = 0.008. ‘uncl_d_’ stands for ‘unclassified_domain_’. ‘uncl_d_Bacteria’ matches exactly to mitochondria or chloroplasts, probably from the food. Relative abundance of families or genera increased (c) or decreased (d) by the inulin fibre diet was shown. Data in a–d are representative of three independent experiments. Data are means ± s.e.m. Statistics were calculated by unpaired two-tailed t-test (c,d).
Extended Data Fig. 2 |
Extended Data Fig. 2 |. Changes in systemic metabolome by inulin fibre diet.
a, Chemical structures of major differentially abundant compounds identified in this study. b, Faecal concentration of SCFAs in mice from control and inulin fibre diet groups (n = 5 mice). c, Integration of serum bile acids shown in Fig. 1d (n = 6 mice for control or 7 mice for inulin fibre). Data in b,c are representative of at least two independent experiments. Data are means ± s.e.m. Statistics were calculated by two-way ANOVA with Šidák’s multiple-comparisons test (b) or unpaired two-tailed t-test (c).
Extended Data Fig. 3 |
Extended Data Fig. 3 |. MS analyses of various samples.
a, Table depicting detection level and other parameters for the metabolites analysed. b–c, Coinjection plots (b) or MS/MS spectra (c) for the metabolites analysed. d–g, Relative abundance of conjugated bile acids in serum (n = 8 mice for control or 9 mice for inulin fibre) (d), faecal unconjugated (e) and conjugated bile acids (f) (n = 9 mice for control or 12 mice for inulin fibre), and conjugated and unconjugated bile acids in caecal content (n = 3 mice) (g). Data are representative of (g) or combined (d–f) from two independent experiments. Data are means ± sem. Statistics were calculated by unpaired two-tailed t-test (d–g).
Extended Data Fig. 4 |
Extended Data Fig. 4 |. Gating strategies shown using samples from colon.
a, Gating strategy for eosinophils in bar graphs including Fig. 1e and Tregs in Extended Data Figs. 5a and 7a. CD45+CD11b+SiglecF+ cells were further verified as SSChiCD11c. b–c, Gating strategies for neutrophils (b) and various other immune cells (c) in Extended Data Fig. 5b.
Extended Data Fig. 5 |
Extended Data Fig. 5 |. Effects of inulin fibre diet on immune cells in various tissues.
a,b, Mice were fed control or inulin fibre diet for two weeks (n = 4 mice). Bar graph shows frequencies of FoxP3+ Treg cells (a) and various immunocytes (b) in the colonic lamina propria of control or inulin fibre diet-fed mice. c, Frequency of colonic eosinophils in mice fed control or inulin fibre diet for the indicated periods of time (n = 3 mice for 0.5-, 1-, or 12-week timepoints, n = 5 mice for 2-week timepoint, and n = 4 mice for 6-week timepoint). d, Percentage of eosinophils in various tissue sites from mice administered control or inulin fibre diet for two weeks. mesLN, mesenteric lymph nodes; SI, small intestine. n = 4 for bone marrow, blood, spleen, mesLN, caecum, SI control or skin inulin fibre, n = 3 for SI inulin fibre or skin control. e,f, Mice were fed chow, control diet, or various high fibre diets, and serum levels of CA (e) were measured after two weeks (n = 3 mice for chow, control, or cellulose fibre, and n = 4 mice for inulin or psyllium fibre). Frequency of eosinophils in the colon and lung (f) of mice fed the indicated diets for two weeks (n = 7 mice (colon) or 4 mice (lung) for chow, n = 6 mice for control or inulin fibre, n = 3 mice for cellulose fibre, and n = 7 mice (colon) or 3 mice (lung) for psyllium fibre). Data are representative of (a–d) or combined (e,f) from two independent experiments. Data are means ± s.e.m. Statistics were calculated by unpaired two-tailed t-test (a), two-way ANOVA with Šidák’s (b,d) or Holm–Šidák’s (c) multiple-comparisons test, or one-way ANOVA with Šidák’s multiple-comparisons test (e,f).
Extended Data Fig. 6 |
Extended Data Fig. 6 |. Inulin fibre diet-induced gene and protein expression in various immune and non-immune cells.
a, Mice were fed control or inulin fibre diet for two weeks and ILC2s (CD45+LinCD90.2+CD127+ KLRG1+) were sorted from colonic lamina propria cells. Heatmap showing level of significance of GO enrichment tests in the colonic ILC2 RNASeq data, as measured by −log10(Pcorrected). Blue, not significant (Pcorrected > 0.01), Red, significant (Pcorrected < 0.01). b,c Gating strategy for bar graphs for IL-5+ cells (including Fig. 2c) (b) and frequency of IL-5-expressing CD4+ T cells (c) in the colonic lamina propria of mice (n = 4 mice). d, Gating strategy for detecting PDGFRα+Sca-1+ (double positive, DP) mesenchymal stromal cells (for bar graphs including Fig. 2f) and double negative (DN) stromal cells in colon and lung tissues. e,f Flow cytometry plots and bar graphs showing IL-33-eGFP expression in epithelial and stromal cell subsets in the colon (e) and lung (f). n = 2 mice (No eGFP) or 3 mice (colon control or inulin fibre) or 4 mice (lung control or inulin fibre). Data in c,e,f, are representative of two independent experiments. Data are means ± s.e.m. Statistics were calculated by unpaired two-tailed t-test (c, f) or one-way ANOVA with Holm–Šidák’s multiple-comparisons test (e).
Extended Data Fig. 7 |
Extended Data Fig. 7 |. Effects of bile acid metabolites on immune and non-immune cells.
a, Frequency of RORγt+ subset of Tregs in the colons of mice administered SCFAs in drinking water, or water alone (control) (n = 4 mice). b, Serum levels of CA in mice provided with regular or CA-supplemented drinking water (control n = 6 mice, CA n = 4 mice). c, Frequency of eosinophils in the lungs of indicated groups (control n = 4 mice, inulin fibre n = 2 mice, CA n = 4 mice). d, Serum levels of CDCA in mice administered 6 mM CDCA in drinking water for two weeks (control n = 6 mice, CDCA n = 3 mice). e, Percentage of IL-5+ ILC2s in single cells from the colons of naïve WT mice in vitro stimulation with or without 50 μM CA (n = 4 mice). f, Gating strategy for detection of human ILCs (for bar graphs including Fig. 3f). g, Top, STRING network visualization of the genes upregulated by the inulin fibre diet (FDR < 10%) in the indicated layers of mouse colon determined by spatial transcriptomic analyses as shown in Fig. 3h. Lines represent protein–protein associations. Connected clusters of less than 3 nodes (genes), as well as all disconnected nodes were excluded. Bottom, a table shows selected significantly enriched KEGG pathways for the genes shown in the STRING network. h, Il33 expression in WT or Nr1h4−/− mice fed control or inulin fibre diet for two weeks (n = 4 mice for WT inulin fibre group and 3 mice for other groups). i, Frequency of eosinophils in the colons and lungs of WT and Nr1h4−/− mice on control or inulin fibre diet (n = 3 mice). j, Il33 levels determined by qRT-PCR in sorted stromal cells cultured for 7 days followed by stimulation for 24 h with media control or 50 μM CA with or without 10 μM DY268 (n = 5 mice). k, Number of IL-5-expressing ILC2s in the colon of bone marrow chimeric mice on indicated diets (For WT→WT, n = 3 mice for control or 4 mice for inulin fibre, For WT→Nr1h4−/−(KO) or KO→WT, n = 4 mice). Data in a–e, h–k are representative of two independent experiments. Data are means ± s.e.m. Statistics were calculated by Mann–Whitney U-test (a), unpaired (b,d) or paired (e, j) two-tailed t-test or one-way (c) or two-way (h,i,k) ANOVA with Fisher’s LSD test.
Extended Data Fig. 8 |
Extended Data Fig. 8 |. Metabolic and immunological parameters in gnotobiotic mice on inulin fibre diet.
a, Schematic diagram for the FMT experiment with human microbiota. b, Taxonomic classification of 16S rRNA genes in faecal suspension from individual human donors or stool pellets collected from representative recipient mice with corresponding human microbiota on control or inulin fibre diet (n = 4 human donors or recipient mice). c–d, Serum CA (c) and tissue eosinophil (d) levels in the diet-fed recipient mice. Each dot represents one animal, and each colour represents one donor. For serum CA levels, n = 15 control mice or 17 inulin fibre mice. For tissue eosinophil levels, n = 14 control mice or 16 inulin fibre mice. e–h, Representative metabolic and immunological parameters of mice colonized with faecal content from one donor two weeks post initiation of the indicated diets (n = 4 mice for control or 5 mice for inulin fibre). Levels of various unconjugated and conjugated bile acid were measured in serum (e) and faeces (f). Il33 expression was measured in the colon (g) and IL-5+ ILC2s in colon and lung (h) two weeks post initiation of the indicated diets. i–j, Single colonies of WT or Δbsh B. ovatus (Bo) strains were cultured in Mega medium with 100 μM taurocholic acid (TCA) for 72 h and then TCA (i) and CA (j) in 100 μl culture supernatants were quantified, n = 3 independent bacterial colonies. k–q, GF mice were monocolonized with WT or Δbsh Bo and fed control or inulin fibre diet. CA and TCA were measured. For serum, n = 10 mice (WT Bo control or Δbsh Bo inulin fibre) or n = 11 mice (WT Bo inulin fibre or Δbsh Bo control). For faeces, n = 6 mice (WT Bo) or n = 8 mice (Δbsh Bo control) or n = 7 mice (Δbsh Bo inulin fibre), and for caecal content, n = 3 mice (WT Bo) or 4 mice (Δbsh Bo) (k–m). Il33 expression in the colon (n), IL-5+ ILC2s in the lung (o), and faecal CFUs (p) were measured (n = 3 mice for WT Bo, n = 4 mice for Δbsh Bo control, n = 3 mice for Δbsh Bo inulin fibre). Expression levels of bsh gene BO_02350 in faecal samples were also quantified (n = 3 mice) (q). Data are representative of (b–j,m–q) or combined (c,d,k,l) from 2–4 independent experiments. Data are means ± s.e.m. Statistics were calculated by unpaired two-tailed t-test (c–j) or two-way ANOVA with Fisher’s LSD test (k–q). The diagram in a was created using BioRender.
Extended Data Fig. 9 |
Extended Data Fig. 9 |. The effects of inulin fibre diet in mice challenged with HDM.
a, Schematic diagram for HDM model of allergic airway inflammation. b–d, Frequency of eosinophils in lung (b) and BALF (c) in naïve (saline) or HDM-challenged mice fed the control or inulin fibre diet (saline n = 2 mice, HDM control diet n = 3 mice for lung or 4 mice for BALF, HDM inulin fibre n = 4 mice). d, Airway hyperresponsiveness in HDM-challenged mice measured as resistance of the respiratory system (Rrs) to increasing doses of methacholine (n = 6 mice). Data are representative of (b–c) or combined (d) from 2 independent experiments. Data are means ± s.e.m. Statistics were calculated by unpaired two-tailed t-test (b–c) or two-way ANOVA with Fisher’s LSD test (d). e,Proposed model. The diagrams in a and e were created using BioRender.
Fig. 1 |
Fig. 1 |. Inulin fibre diet upregulates systemic bile acids and tissue eosinophils.
a, Schematic of the experimental design (left). Right, the differential abundance of intestinal microbiota in control versus inulin fibre diet groups mapped to the HMP database. n = 5 mice. The red dots show differentially abundant taxa (P < 0.05, determined using DESeq2 Wald test). FC, fold change. bd, Partial representation of the MS2 network for mouse serum, highlighting three clusters for phenolics (b), indoles (c) and bile acids (d). n = 8 (control) and n = 9 (inulin fibre) mice. Each node represents a unique feature, and the connections between nodes indicate the similarity between MS2 spectra. Blue represents downregulated and red represents upregulated features in the inulin fibre group compared with the control group. The arrows indicate some of the differentially abundant compounds. The bar graphs show the relative abundance of metabolites that were significantly different between control and inulin fibre groups. Peak integration data from HPLC–MS analysis were log-transformed before statistical analysis. e,f, Representative flow cytometry plots, the frequency of CD11b+SiglecF+ eosinophils in the CD45+ population and the total number in the colonic lamina propria (n = 4 mice) (e) and the lungs (n = 7 (control) and n = 8 (inulin fibre) mice) (f). Data are representative of three independent experiments (a) or pooled from two independent experiments (bd and f). For bf, data are mean ± s.e.m. Statistical analysis was performed using unpaired two-tailed t-tests (bf). The diagrams in a, e and f were created using BioRender.
Fig. 2 |
Fig. 2 |. Inulin fibre diet-induced eosinophilia requires ILC2s and IL-33.
a, The number of eosinophils in the colons of WT, Rag2−/− and Rag2−/−Il2rg/− mice. n = 3 (WT control), n = 4 (WT inulin fibre or Rag2−/−) and n = 5 (Rag2−/−Il2rg−/−) mice. b, The differential gene expression of colonic ILC2s in mice fed the control or inulin fibre diet. Genes upregulated by inulin fibre diet are shown in green and genes downregulated by inulin fibre diet are shown in light red (DESeq2 Wald test, false-discovery rate (FDR) < 0.1). c, The frequency of IL-5-expressing KLRG1+ ILC2s in the colonic lamina propria, determined by intracellular cytokine staining. n = 4 mice. Flow cytometry plots were gated from CD45+LinCD90.2+CD127+ cells. d, Expression of Il33 in the distal colon determined by quantitative PCR with reverse transcription (RT–qPCR) analysis. n = 5 mice. e, Representative immunofluorescence staining showing IL-33 expression in vimentin+ stromal cells in the colons (n = 3 mice). The arrows indicate IL-33+ cells. Scale bar, 50 μm. The bar graph shows the quantification of IL-33+vimentin+ cells per cross-section of whole colon ‘Swiss rolls’. f, Flow cytometry plots and bar graphs showing IL-33-eGFP expression in PDGFRα+ Sca-1+ double-positive (DP) mesenchymal stromal cells in the colon. n = 2 (no eGFP) and n = 3 (control or inulin fibre) mice. g, The number of eosinophils in the colons of WT, Il33−/− and Il1rl1−/− mice fed the control or inulin fibre diet. n = 4 (Il1rl1−/−) and n = 5 mice (WT or Il33−/−) mice. Data are representative of two independent experiments (a and cg). For a and cg, data are mean ± s.e.m. Statistical analysis was performed using two-way (a and g) or one-way (f) analysis of variance (ANOVA) with Holm–Šidák’s multiple-comparisons test or unpaired two-tailed t-tests (c and e) or Mann–Whitney U-tests (d).
Fig. 3 |
Fig. 3 |. Microbiota-derived CA and host FXR mediate inulin fibre diet-triggered type 2 inflammation.
a, The number of eosinophils in the colon. n = 3 mice. b, The frequency of colon eosinophils after administration of the diets (n = 8 (control) and n = 6 (inulin fibre) mice) or metabolites (n = 3 (CA + IPA), n = 4 (SCFAs or CA) and n = 5 (IPA) mice). c, The frequency of colon eosinophils. n = 4 mice. d, The frequency of IL-5-expressing ILC2s in the lungs. n = 4 (control or inulin fibre) and n = 3 (CA) mice. e, The frequency of IL-5-expressing ILC2s in naive mouse lung cell preparations after incubation in vitro under the indicated conditions. n = 4 mice. f, The frequency of IL-5-expressing ILC2s in PBMCs from human donors (n = 8 donors) co-cultured with the human colonic stromal cell line Ccd-18Co. gi, Spatial transcriptomic analyses of distal colon tissues. g, A representative H&E-stained colon section, which was overlaid by ‘spots’ containing transcriptional information. h, Heat map showing the genes in each layer of the colon sections with uncorrected P < 0.01 (Wilcoxon rank-sum test). i, Spatial representation of the relative expression of FXR-encoding Nr1h4 in representative colon tissues. Scale bar, 500 μm. j, The frequency of colon and lung eosinophils in the bone marrow chimeric mice with indicated donor to recipient conditions. WT→WT: n = 3 (control mice) and n = 4 (inulin fibre) mice; irradiated Nr1h4−/− mice with WT bone marrow (WT→Nr1h4−/− (KO)): n = 4 mice; and irradiated WT mice with Nr1h4−/− bone marrow (KO→WT): n = 4 mice. k,l, Serum CA (k) and tissue eosinophil (l) levels in gnotobiotic mice with human microbiota. Each pair of dots represents the mean levels of all of the mice receiving microbiota from a single human donor. n = 4 donors. m, Schematic of the bile acid deconjugation pathway. n, The frequency of colon and lung eosinophils in GF mice monocolonized with WT or bsh-deleted B. ovatus (WT Bo or Δbsh Bo, respectively). n = 3 (Δbsh Bo control diet group) and n = 4 (other groups). Data are representative of (a, ce, j and n) or pooled from (b and f) two independent experiments. Data are mean (k and l) or mean ± s.e.m. (af, j and n). Statistical analysis was performed using two-way ANOVA with uncorrected Fisher’s LSD test (a, j and n); one-way ANOVA with Dunnett’s multiple-comparisons test (b and d); unpaired (c) or paired (e, f, k and l) two-tailed t-tests; or pairwise Wilcoxon test with Bonferroni correction (i).
Fig. 4 |
Fig. 4 |. Inulin-fibre-diet-induced eosinophils promote allergic inflammation and anti-helminth defence.
ad, Papain-induced lung inflammation. a, Schematic of sensitization with papain. b, Representative H&E-stained lung sections and perivascular/peribronchial inflammation as scored by histology. n = 7 mice. Scale bar, 100 μm. c,d, The frequency of eosinophils in the lungs (c) or BALF (d) 24 h after the second dose of papain. n = 8 (papain with control diet), n = 7 (papain with inulin fibre diet) and n = 3 (saline) mice. eh, N. brasiliensis (Nb) model of helminth infection. e, Schematic of the infection model. f, The frequency of eosinophils in mesenteric lymph nodes. n = 5 mice. g, Representative histology of the lung airways stained with periodic acid Schiff (PAS). Scale bar, 50 μm. Each data point in the graph represents the average number of goblet cells per bronchiole in a section of the left lung from one animal. n = 10 mice. h, Worm count in the small intestine of WT (n = 10 mice) or ΔdblGATA (n = 5 mice) mice. Data are representative of (f) or pooled from (bd, g and h) two independent experiments. Data are mean ± s.e.m. Statistical analysis was performed using unpaired two-tailed t-tests (b, c, f and g) or two-way ANOVA with Šidák’s multiple-comparisons test (d and h). The schematics in a and e were created using BioRender.

References

    1. Brestoff JR & Artis D Commensal bacteria at the interface of host metabolism and the immune system. Nat. Immunol. 14, 676–684 (2013). - PMC - PubMed
    1. Rooks MG & Garrett WS Gut microbiota, metabolites and host immunity. Nat. Rev. Immunol. 16, 341–352 (2016). - PMC - PubMed
    1. Robertson RC, Manges AR, Finlay BB & Prendergast AJ The human microbiome and child growth—first 1000 days and beyond. Trends Microbiol. 27, 131–147 (2019). - PubMed
    1. Fan Y & Pedersen O Gut microbiota in human metabolic health and disease. Nat. Rev. Microbiol. 19, 55–71 (2021). - PubMed
    1. Belkaid Y & Hand TW Role of the microbiota in immunity and inflammation. Cell 157, 121–141 (2014). - PMC - PubMed

Publication types

MeSH terms