. 2022 Nov;611(7935):405-412.
doi: 10.1038/s41586-022-05374-w. Epub 2022 Nov 2.

Nociceptor neurons affect cancer immunosurveillance

Affiliations

Nociceptor neurons affect cancer immunosurveillance

Mohammad Balood et al. Nature. 2022 Nov.

Abstract

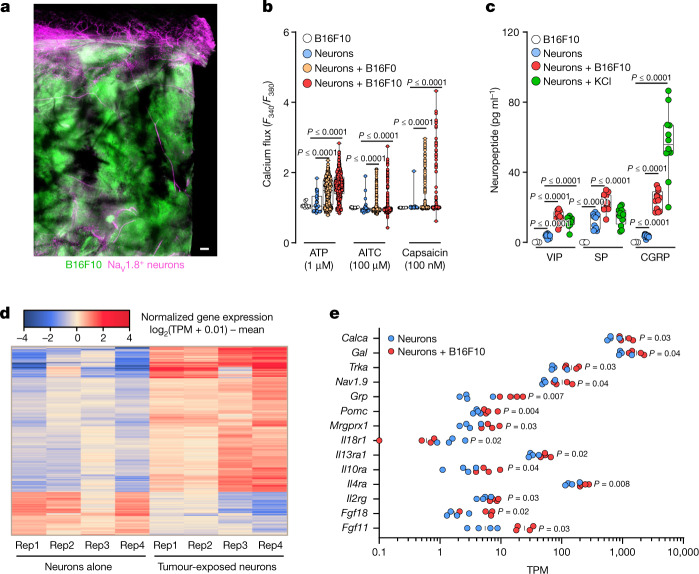
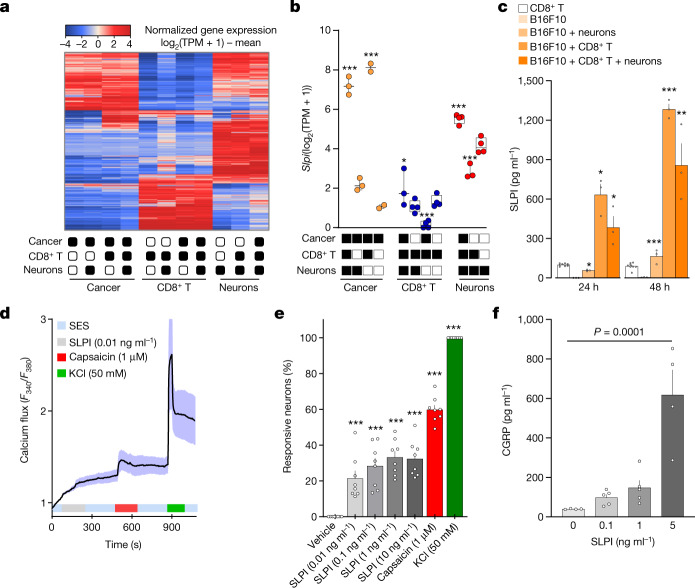
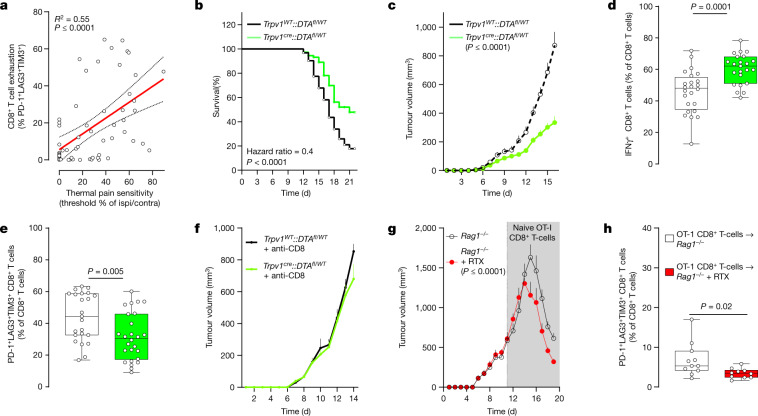
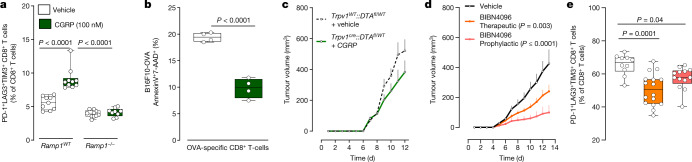
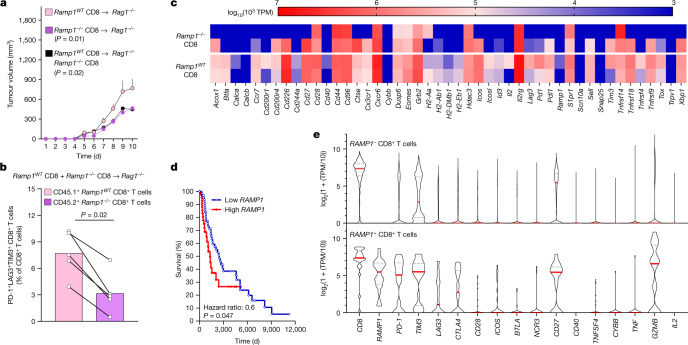
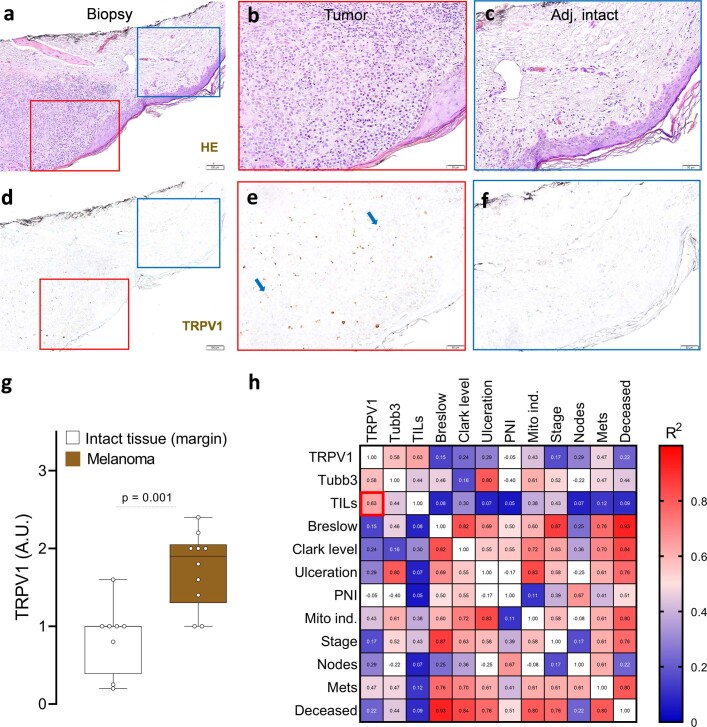
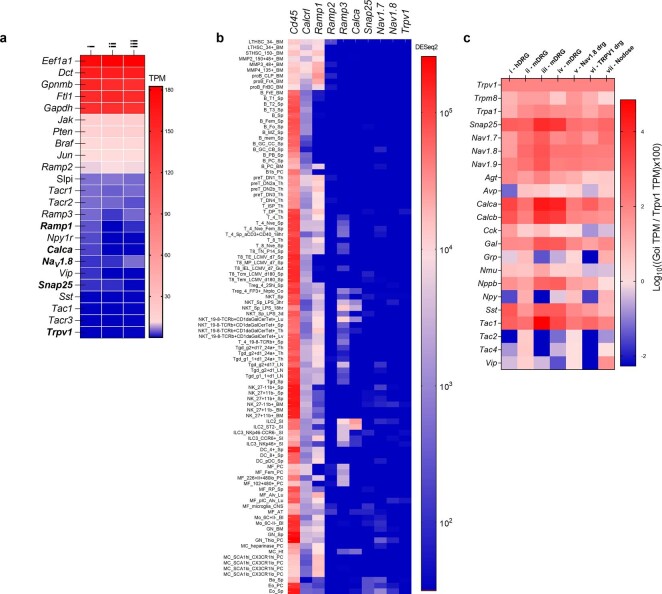
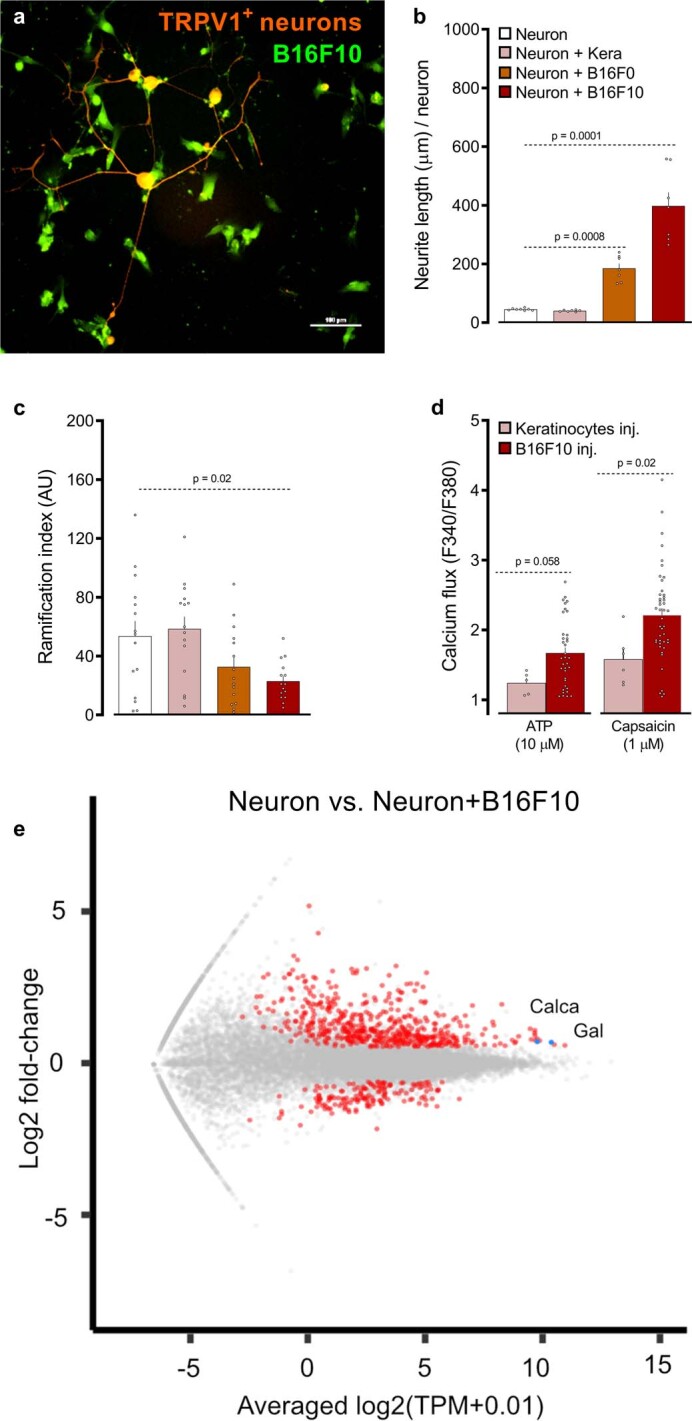
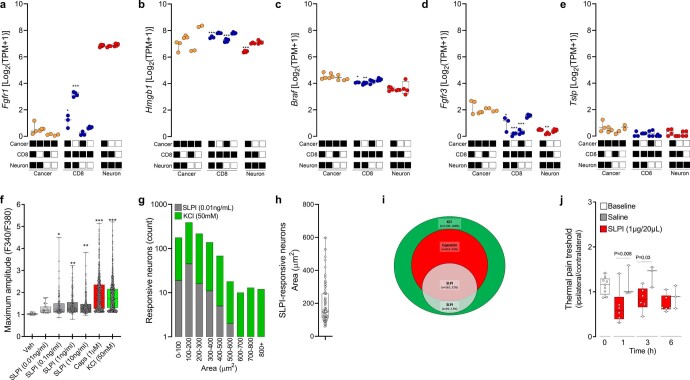
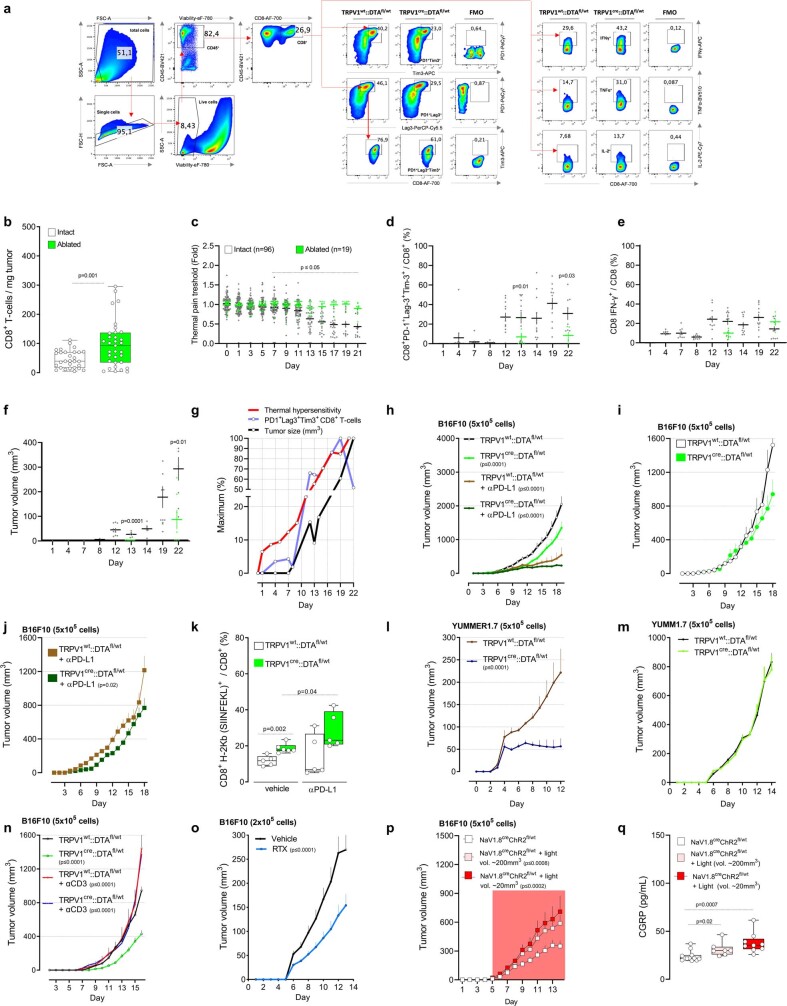
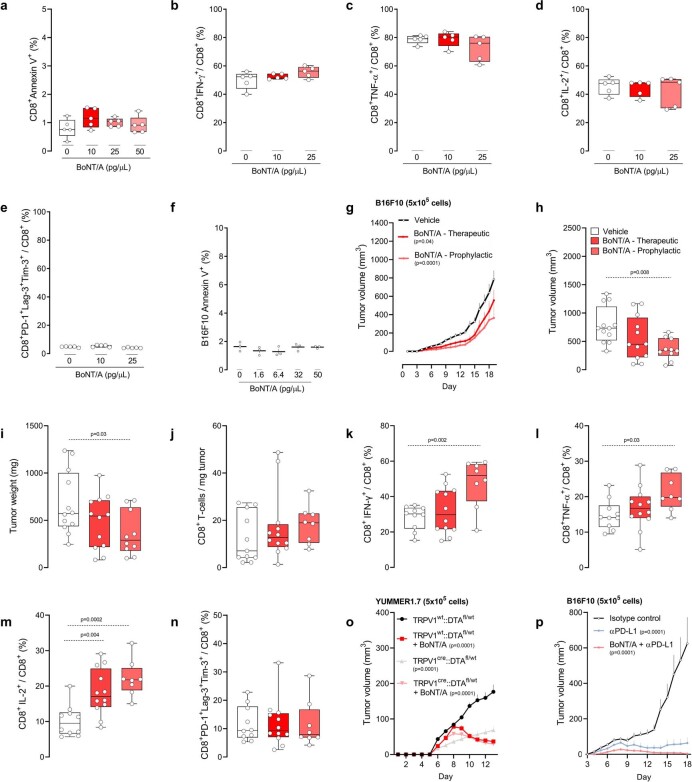
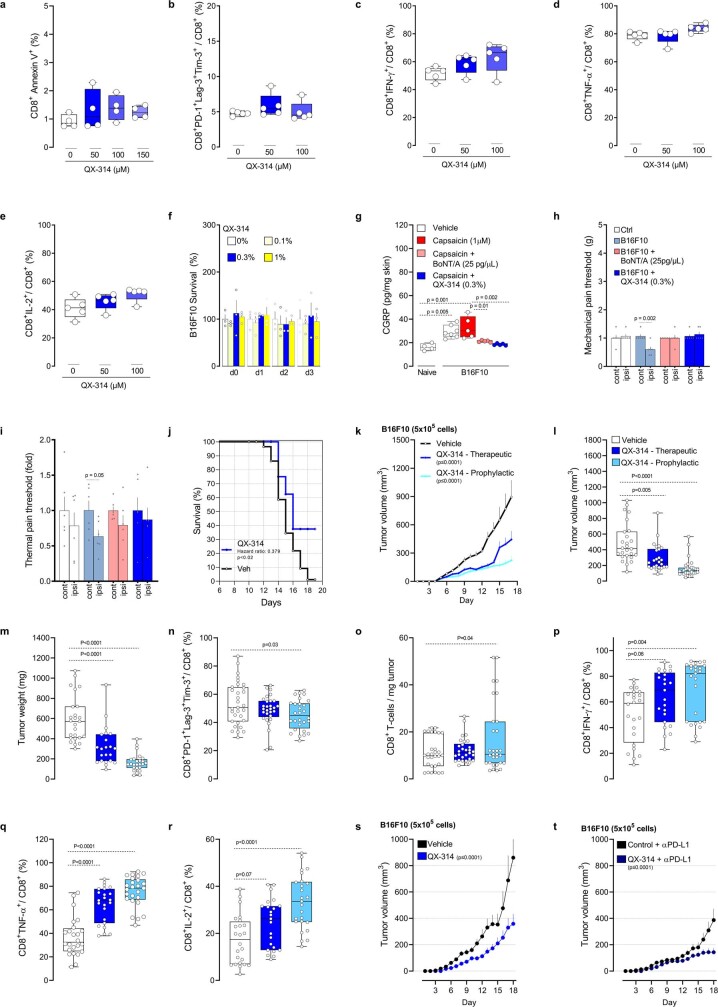
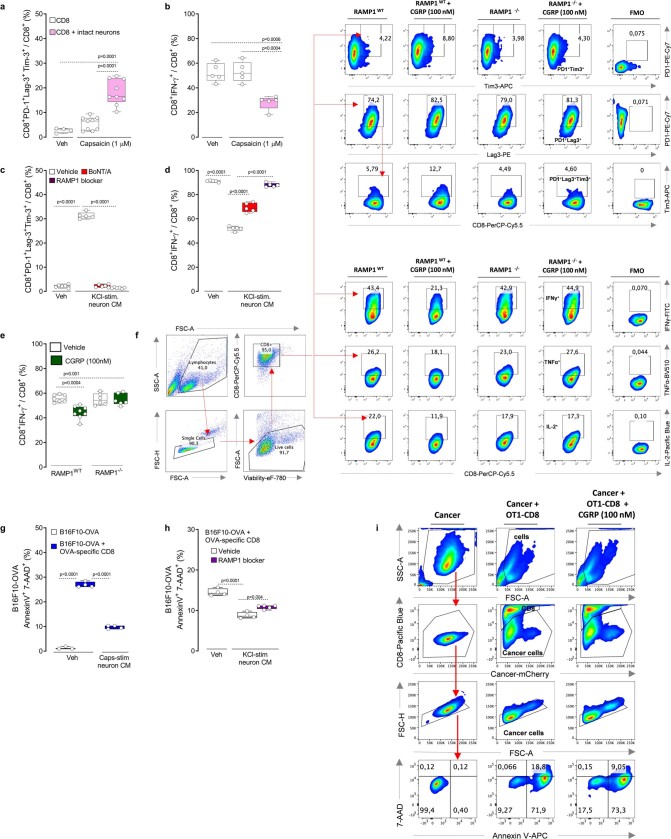
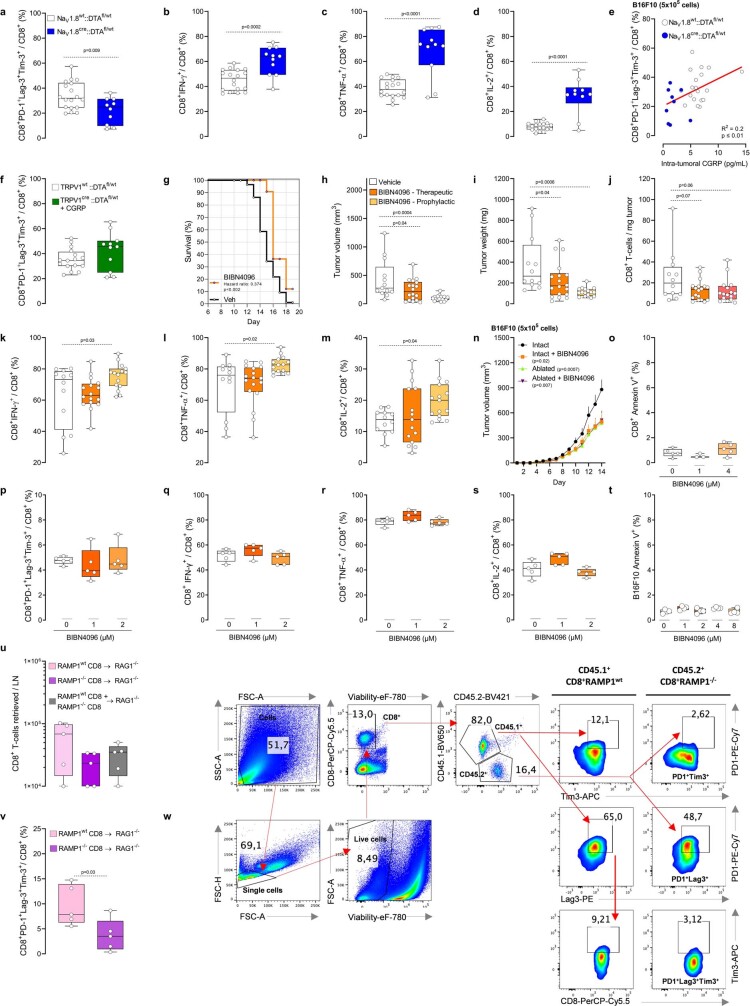
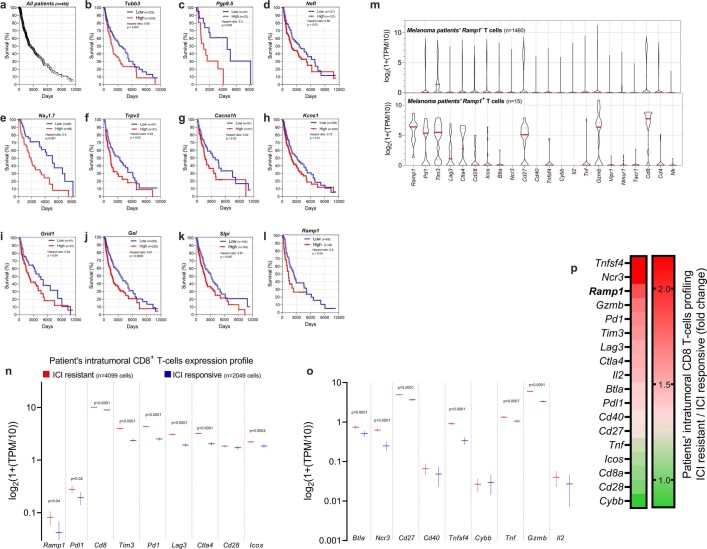
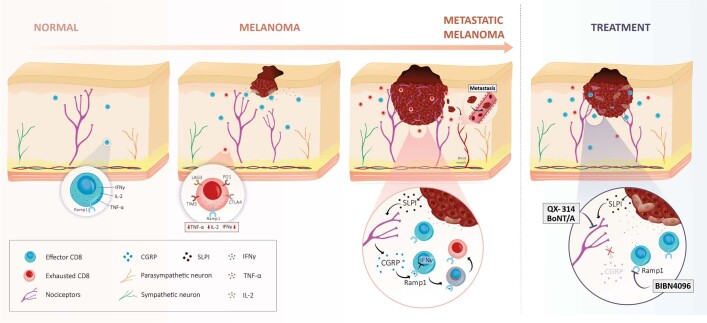
Solid tumours are innervated by nerve fibres that arise from the autonomic and sensory peripheral nervous systems1-5. Whether the neo-innervation of tumours by pain-initiating sensory neurons affects cancer immunosurveillance remains unclear. Here we show that melanoma cells interact with nociceptor neurons, leading to increases in their neurite outgrowth, responsiveness to noxious ligands and neuropeptide release. Calcitonin gene-related peptide (CGRP)-one such nociceptor-produced neuropeptide-directly increases the exhaustion of cytotoxic CD8+ T cells, which limits their capacity to eliminate melanoma. Genetic ablation of the TRPV1 lineage, local pharmacological silencing of nociceptors and antagonism of the CGRP receptor RAMP1 all reduced the exhaustion of tumour-infiltrating leukocytes and decreased the growth of tumours, nearly tripling the survival rate of mice that were inoculated with B16F10 melanoma cells. Conversely, CD8+ T cell exhaustion was rescued in sensory-neuron-depleted mice that were treated with local recombinant CGRP. As compared with wild-type CD8+ T cells, Ramp1-/- CD8+ T cells were protected against exhaustion when co-transplanted into tumour-bearing Rag1-deficient mice. Single-cell RNA sequencing of biopsies from patients with melanoma revealed that intratumoral RAMP1-expressing CD8+ T cells were more exhausted than their RAMP1-negative counterparts, whereas overexpression of RAMP1 correlated with a poorer clinical prognosis. Overall, our results suggest that reducing the release of CGRP from tumour-innervating nociceptors could be a strategy to improve anti-tumour immunity by eliminating the immunomodulatory effects of CGRP on cytotoxic CD8+ T cells.


Conflict of interest statement

S.T. and C.J.W. have an equity stake in Nocion Therapeutics. S.T. and C.J.W. have deposited a provisional patent (WO 2021/173916) on the use of charged sodium channel blockers to silence nociceptor neurons as a means to safeguard host anti-tumour immunity.

Figures

Fig. 1
Fig. 1. Melanoma cells sensitize nociceptors.
a, Nociceptor (Nav1.8cre::tdTomatofl/WT; magenta) reporter mice were inoculated in the hindpaw with B16F10-eGFP cancer cells (i.d., 2 × 105 cells; green). Representative image of NaV1.8+ nerve fibres (magenta) innervating B16F10-eGFP-inoculated mouse skin after 22 days. Scale bar, 200 μm. b, In co-culture, B16F0 or B16F10 cells sensitize the response of nociceptors to capsaicin (100 nM), allyl isothiocyanate (AITC, 100 μM) and ATP (1 μM), as measured by calcium flux. A low concentration of the ligands induces a minimal response in control neurons, whereas B16F10 cells show marginal sensitivity to ATP. c, Dorsal root ganglion (DRG) neurons co-cultured (96 h) with B16F10 cells release substance P (SP), vasoactive intestinal peptide (VIP) and CGRP. B16F10 cells alone do not release neuropeptides. Stimulation with KCl (40 mM; 30 min) induced a significant release of neuropeptides from cultured neurons. d,e, Naive DRG neurons (Trpv1cre::-CheRiff-eGFPfl/WT) were cultured alone or in combination with B16F10-mCherry-OVA cells. After 48 h, the cells were collected, FACS purified and RNA sequenced. Hierarchical clustering of DEGs from the sorted neurons shows distinct groups of transcripts enriched in cancer-exposed TRPV1+ neurons (d), including Calca (the gene encoding CGRP; e). Data are shown as a representative image (a), as box-and-whisker plots (running from minimal to maximal values; the box extends from 25th to 75th percentile and the middle line indicates the median), for which individual data points are given (b,c), as a heat map showing normalized gene expression (log2(0.01 + transcripts per million reads (TPM)) − mean (d) or as a scatter dot plot with medians (e). Experiments were independently repeated two (a) or three (b,c) times with similar results. The sequencing experiment was not repeated (d,e). n as follows: a: n = 4; b: neurons (29 neurons from 10 mice), B16F10 (16 cells from 10 dishes), neurons + B16F0 (387 neurons from 12 mice), neurons + B16F10 (409 neurons from 12 mice); c: neurons (n = 12), neurons + B16F10 (n = 12), neurons + KCl (n = 12), B16F10 (n = 3); d,e: n = 4 per group. P values were determined by one-way ANOVA with post-hoc Bonferroni (b,c) or two-sided unpaired Student’s t-test (e). Source Data
Fig. 2
Fig. 2. Cancer-secreted SLPI drives the release of CGRP by nociceptor neurons.
ac, Naive DRG neurons (Trpv1cre::-CheRiff-eGFPfl/WT), B16F10-mCherry-OVA cells and OVA-specific cytotoxic CD8+ T cells were cultured alone or in combination. After 48 h, the cells were collected, FACS purified and RNA sequenced. a, Hierarchical clustering of sorted neuron molecular profiles depicts distinct groups of transcripts enriched in each group. b, DEGs were calculated, and Slpi was found to be overexpressed in cancer cells when co-cultured with OVA-specific cytotoxic CD8+ T cells, DRG neurons or both populations. c, SLPI is secreted by B16F10-mCherry-OVA cells when co-cultured (24 h or 48 h) with naive DRG neurons and OVA-specific cytotoxic CD8+ T cells, with a maximal effect after 48 h. df, Using calcium microscopy, we found that SLPI (10 pg ml−1–10 ng ml−1) activated around 20% of cultured naive DRG neurons (d,e). Activation of cultured neurons (3 h) with SLPI also leads to significant release of CGRP (f). Data are shown as a heat map showing normalized gene expression (log2(1 + TPM) − mean (a), as box-and-whisters plots (as defined in Fig. 1b,c) (b) or as mean ± s.e.m. (cf). n as follows: a,b: n = 2–4 per groups; c: n = 3 for all groups except CD8+ T cells (n = 8); d: n = 17; e: n = 8 per group; f: 0 ng ml−1 (n = 4), 0.1 ng ml−1 (n = 5), 1 ng ml−1 (n = 5), 5 ng ml−1 (n = 4). Experiments in cf were independently repeated three times with similar results. The sequencing experiment was not repeated (a,b). P values were determined by one-way ANOVA with post-hoc Bonferroni (b,e,f) or two-sided unpaired Student’s t-test (c). *P ≤ 0.05, **P ≤ 0.01, and ***P ≤ 0.001. Source Data
Fig. 3
Fig. 3. Genetic ablation of nociceptors safeguards anti-tumour immunity.
a, Orthotopic B16F10-mCherry-OVA cells (2 × 105 cells, i.d.) were injected into the left hindpaw of wild-type mice. As measured on day 13 after tumour inoculation, intratumoral CD8+ T cell exhaustion positively correlated with thermal hypersensitivity (R2 = 0.55, P ≤ 0.0001). The thermal pain hypersensitivity represents the withdrawal latency ratio of the ipsilateral paw (tumour-inoculated) to the contralateral paw. b, Orthotopic B16F10-mCherry-OVA (5 × 105 cells, i.d.) were inoculated into the flank of eight-week-old male and female mice with sensory neurons intact (Trpv1WT::DTAfl/WT) or ablated (Trpv1cre::DTAfl/WT). The median length of survival was increased by around 250% in nociceptor-ablated mice (measured until 22 days after inoculation). cf, Sixteen days after tumour inoculation, sensory-neuron-ablated mice have reduced tumour growth (c) and increased tumour infiltration of IFNγ+ CD8+ T cells (d), and the proportion of PD-1+LAG3+TIM3+ CD8+ T cells is decreased (e). This reduction in B16F10-mCherry-OVA (5 × 105 cells, i.d.) tumour volume was absent in nociceptor-ablated mice whose CD8+ T cells were systemically depleted (f; assessed until day 14; anti-CD8, 200 μg per mouse, i.p., every 3 days). g,h, To chemically deplete their nociceptor neurons, Rag1−/ mice were injected with RTX. Twenty-eight days later, the mice were inoculated with B16F10-mCherry-OVA (5 × 105 cells, i.d.). RTX-injected mice that were adoptively transferred with naive OVA-specific CD8+ T cells (i.v., 1 × 106 cells, when tumour reached around 500 mm3) showed reduced tumour growth (g; assessed until day 19) and exhaustion (h) compared to vehicle-exposed Rag1−/ mice. Data are shown as a linear regression analysis ± s.e. (a), as a Mantel–Cox regression (b), as mean ± s.e.m. (c,f,g) or as box-and-whisker plots (as defined in Fig. 1b,c), for which individual data points are given (d,e,h). n as follows: a: n = 60; b: intact (n = 62), ablated (n = 73); c: intact (n = 20), ablated (n = 25); d: intact (n = 24), ablated (n = 23); e: intact (n = 23), ablated (n = 26); f: intact + anti-CD8 (n = 10), ablated + anti-CD8 (n = 8); g: vehicle (n = 12), RTX (n = 10); h: vehicle (n = 11), RTX (n = 10). Experiments were independently repeated two (a,fh) or six (be) times with similar results. P values were determined by simple linear regression analysis (a), Mantel–Cox regression (b), two-way ANOVA with post-hoc Bonferroni (c,f,g) or two-sided unpaired Student’s t-test (d,e,h). Source Data
Fig. 4
Fig. 4. CGRP modulates the activation of CD8+ T cells.
a,b, Splenocyte CD8+ T cells from wild-type (a), Ramp1−/ (a) or naive OT-I (b) mice were cultured under Tc1-stimulating conditions (ex-vivo-activated by CD3 and CD28, IL-12 and anti-IL4) for 48 h to generate cytotoxic CD8+ T cells. In the presence of IL-2 (10 ng ml−1), the cells were stimulated with CGRP (100 nM; challenged once every two days) for 96 h. Wild-type cytotoxic CD8+ T cells showed an increased proportion of PD-1+LAG3+TIM3+ cells; this effect was absent when treating cytotoxic CD8+ T cells that were collected from Ramp1−/ mice (a). In co-culture (48 h), CGRP (100 nM; once daily) also reduced the ability of OT-I cytotoxic CD8+ T cells (4 × 105 cells) to eliminate B16F10-mCherry-OVA cancer cells (b). c, Orthotopic B16F10-mCherry-OVA cells (5 × 105 cells, i.d.) were inoculated into eight-week-old female mice with sensory neurons intact or ablated. In nociceptor-ablated mice, peritumoral recombinant CGRP injection (100 nM, i.d., once daily) rescues B16F10 growth (assessed until day 12). d,e, Orthotopic B16F10-mCherry-OVA cells (5 × 105 cells, i.d.) were inoculated into eight-week-old male and female mice. Starting one day after inoculation (defined as prophylactic), the RAMP1 antagonist BIBN4096 (5 mg kg−1) was administered systemically (i.p.) once every two days. In another group of mice, BIBN4096 (5 mg kg−1, i.p., every two days) injections were started once the tumour reached a volume of around 200 mm3 (defined as therapeutic). Prophylactic or therapeutic BIBN4096 treatments decreased tumour growth (d) and reduced the proportion of intratumoral PD-1+LAG3+TIM3+ CD8+ T cells (e; assessed until day 13). Data are shown as box-and-whisker plots (as defined in Fig. 1b, c), for which individual data points are given (a,b,e), or as mean ± s.e.m. (c,d). n as follows: a: Ramp1WT CD8 + vehicle (n = 9), Ramp1WT CD8 + CGRP (n = 10), Ramp1−/ CD8 + vehicle (n = 10), Ramp1−/ CD8 + CGRP (n = 9); b: n = 4 per group; c: intact + vehicle (n = 15), ablated + CGRP (n = 11); d: vehicle (n = 13), BIBN prophylactic (n = 16), BIBN therapeutic (n = 18); e: vehicle (n = 10), BIBN prophylactic (n = 13), BIBN therapeutic (n = 16). Experiments were independently repeated three times with similar results. P values were determined by one-way ANOVA with post-hoc Bonferroni (a,e), two-sided unpaired Student’s t-test (b) or two-way ANOVA with post-hoc Bonferroni (c,d). Source Data
Fig. 5
Fig. 5. CGRP attenuates the anti-tumour immunity of RAMP1+ CD8+ T cells.
ac, Splenocyte CD8+ T cells were FACS purified from Ramp1WT (CD45.1+) or Ramp1−/ (CD45.2+) mice, expanded and stimulated (CD3 and CD28 + IL-2) in vitro. Eight-week-old female Rag1−/ mice were transplanted (i.v., 2.5 × 106 cells) with activated Ramp1−/ or Ramp1WT CD8+ T cells or a 1:1 mix of Ramp1−/ and Ramp1WT CD8+ T cells. One week after transplantation, the mice were inoculated with B16F10-mCherry-OVA cells (5 × 105 cells, i.d.). Ten days after B16F10 inoculation, we observed greater tumour growth (a) in Ramp1WT transplanted mice. Intratumoral Ramp1−/ (CD45.2+) and Ramp1WT (CD45.1+) CD8+ T cells were FACS purified, immunophenotyped (b) and RNA sequenced (c). Ramp1−/ CD8+ T cells showed a lower proportion of PD-1+LAG3+TIM3+ CD8+ T cells (b) as well as reduced transcript expression of exhaustion markers (c). d, In silico analysis of The Cancer Genome Atlas (TCGA) data was used to correlate the survival rate of 459 patients with melanoma with the relative RAMP1 expression (primary biopsy bulk RNA sequencing). In comparison to patients with low RAMP1 expression, higher RAMP1 levels correlate with decreased patient survival. e, In silico analysis of single-cell RNA sequencing of human melanoma reveals that intratumoral RAMP1-expressing CD8+ T cells strongly overexpress several immune checkpoint receptors (PD-1 (also known as PDCD1) TIM3, LAG3, CTLA4) in comparison to Ramp1-negative CD8+ T cells. Data are shown as mean ± s.e.m. (a), slopegraph (b), as a heat map showing normalized gene expression (log10(103 × TPM) (c), as a Mantel–Cox regression (d) or as a violin plot (e). n as follows: a–c: n = 5 per group; d: high (n = 45), low (n = 68); e: RAMP1 CD8 (n = 1,732), RAMP1+ CD8 (n = 25). Experiments were independently repeated two (a,b) times with similar results. The sequencing experiment was not repeated (c). P values were determined by two-way ANOVA with post-hoc Bonferroni (a), two-sided unpaired Student’s t-test (b) or Mantel–Cox regression (d). Source Data
Extended Data Fig. 1
Extended Data Fig. 1. TRPV1, NAV1.8, SNAP25 or RAMP1 transcripts are expressed in patient melanoma biopsies but are not detected in human immune cells or malignant cells.
(a–b) In silico analysis of single-cell RNA sequencing of human melanoma-infiltrating cells revealed that Trpv1, Nav1.8 (Scn10a), Snap25 (the molecular target of BoNT/A), Calca (gene encoding for CGRP) transcripts are not detected in malignant melanoma cells (defined as CD90CD45) from ten different patients’ biopsies (a) nor in cancer-associated fibroblasts, macrophage, endothelial, natural killer, T, and B cells (b). Individual cell data are shown as a log2 of 1 + (transcript per million / 10). Experimental details and cell clustering were defined in Jerby-Arnon et al. N are defined in the figures. (c) In silico analysis of human immune cells revealed their basal expression of Cd45. Using RNA sequencing approaches, Calca, Snap25, Trpv1 or NaV1.8 are not detected in these cells. Heat maps show the read counts normalized to transcripts per million protein-coding genes (pTPM) for each of the single-cell clusters. Experimental details and cell clustering were defined in Monaco et al. (d) Forty-five cutaneous melanomas and 18 benign melanocytic skin nevus biopsies transcriptomes were profiled using Affymetrix U133A microarrays. In silico analysis of this dataset revealed that cutaneous melanoma heightened expression levels of Calca (1.4-fold), Pouf4f1 (2-fold), Eno2 (1.4-fold), and Tubb3 (1.1-fold), as well as other neuronal-enriched genes. Heat map data are shown as log2 (median centred intensity); two-sided unpaired Student’s t-test; p-values and n are shown in the figure. Experimental details were defined in Haqq et al. Source Data
Extended Data Fig. 2
Extended Data Fig. 2. TRPV1+ neurons innervate patient melanomas.
Patients’ melanoma sections were stained with hematoxylin eosin (a–f), and the presence of TRPV1 (d–f; brown) neurons was analysed by immunohistochemistry. Increased levels of TRPV1+ neurons (g) were found in the tumour (delimited by red square; a-b, d-e) compared to adjacent healthy skin (delimited by blue square; a,c,d,f). Increased TRPV1 immunolabelling in tumour sections primarily correlated with enhanced levels of tumour-infiltrating leukocytes (h) as scored from a retrospective correlation analysis performed on the patients’ pathology reports. Data are shown as representative immunohistochemistry images (a–f), box-and-whisker plots (runs from minimal to maximal values; the box extends from 25th to 75th percentile and the middle line indicates the median), for which individual data points are given (g) or as a heat map (h) displaying Pearson’s correlation (R2). N are as follows: a–f: n=10, g: intact (n = 8), tumour (n = 10), h: n = 10. Slides were scored blindly by two experienced medical pathologists. P-values are shown in the figure and determined by two-sided unpaired Student’s t-test (g). Scale = 100 μm (a,d), 50 μm (b,c,e,f). Source Data
Extended Data Fig. 3
Extended Data Fig. 3. Trpv1, Nav1.8, Snap25 or Ramp1 transcripts are not detected in B16F10 cancer cells or mouse immune cells.
(a) In silico analysis of three different B16F10 cells cultures (labelled as i, ii, iii) revealed their basal expression of Braf and Pten. In contrast, Calca, Snap25, Trpv1 or NaV1.8 transcripts are not detected in B16F10 cells. Heat map data are shown as transcript per million (TPM) on a linear scale. Experimental details were defined in Castle et al. N=3/group. (b) ImmGen RNA sequencing of leukocyte subpopulations reveals their basal expression of Cd45 and Ramp1. In contrast, Snap25, Trpv1, or Nav1.8 transcripts are not detected in mouse immune cells. Heat map data are shown as DESeq2 on a logarithmic scale. (c) A meta-analysis of seven published nociceptor neuron expression profiling datasets revealed the basal expression of sensory neuron markers (Trpv1, Trpa1) and neuropeptides (Sp, Vip, Nmu, Calca). Expression across datasets was ratioed over Trpv1 and multiplied by 100. The log10 of these values is presented as a heat map. i) RNA sequencing of human lumbar neurons; ii) microarrays of mouse FACS-sorted NaV1.8+ neurons; iii) and iv) single-cell RNA sequencing of mouse lumbar neurons;, v) microarray profiling of mouse NaV1.8+ DRG neurons; vi) performed RNA sequencing of mouse TRPV1+ neurons; and vii) single-cell RNA sequencing of mouse vagal ganglia. Source Data
Extended Data Fig. 4
Extended Data Fig. 4. B16F10 cells interact with nociceptor neurons.
(a–c) When co-cultured with B16F10-eGFP cells (green), TRPV1+ nociceptor (Trpv1cre::tdTomatofl/WT; orange) neurons form neuro-neoplasic contacts (a), show longer neurites (b), and exhibit reduced arborization (c) than when cultured alone or with non-tumorigenic keratinocytes (b–c). (d) L3–L5 DRG neurons were collected from mice 2-weeks after they were inoculated (left hindpaw; i.d.) with B16F10- or non-tumorigenic keratinocytes, cultured and calcium flux to ligands tested (ATP (10 μM), and capsaicin (1 μM)). Compared to neurons from keratinocytes-injected mice, the one from tumour-bearing mice showed increased sensitivity to capsaicin. (e) Naive DRG neurons (Trpv1cre::CheRiff-eGFPfl/WT) were cultured alone or in combination with B16F10-mCherry-OVA. After 48h, the cells were collected, FACS purified, and RNA sequenced. Hierarchical clustering of sorted neuron DEG show distinct groups of transcripts enriched in TRPV1+ neuron vs cancer-exposed TRPV1+ neuron populations. Pairwise comparison of naive TRPV1+ neuron vs cancer-exposed TRPV1+ neuron populations showing differentially expressed transcripts as a volcano plot (p<0.05). Among others, Calca (gene encoding for CGRP) was overexpressed in TRPV1+ (FACS-purified eGFP-expressing cells) neurons when co-cultured with B16F10-mCherry-OVA. Data are shown as representative image (a), mean ± S.E.M (b–d), or volcano plot (e). N are as follows: a: n = 4, b: neuron (n=8), neuron + keratinocytes (n = 7), neuron + B16F0 (n = 7), neuron + B16F10 (n = 7), c: n = 15/groups, d: keratinocytes inj. + ATP (n=5), B16F10 inj. + ATP (n=36), Keratinocytes inj. + caps (n = 6), B16F10 inj. + caps (n = 44), e: n = 4/groups. Experiments were independently repeated two (d) or three (a–c) times with similar results. Sequencing experiment was not repeated (e). P-values are shown in the figure and determined by one-way ANOVA post-hoc Bonferroni (b–c) or two-sided unpaired Student’s t-test (d). Scale bar = 100 μm (a). Source Data
Extended Data Fig. 5
Extended Data Fig. 5. B16F10-secreted SLPI activates nociceptor neurons.
(a–e) Naive DRG neurons (Trpv1cre::CheRiff-eGFPfl/WT), B16F10-mCherry-OVA, and OVA-specific cytotoxic CD8+ T cells were cultured alone or in combination. After 48h, the cells were collected, FACS purified, and RNA sequenced. DEGs were calculated, and Fgfr1 (fibroblast growth factor receptor 1) was found to be overexpressed in OVA-specific cytotoxic CD8+ T cells when co-cultured with cancer cells and DRG neurons (a). Conversely, OVA-specific cytotoxic CD8+ T cells downregulates the expression of the pro-nociceptive factor Hmgb1 (High–mobility group box 1; b), Braf (c), as well as Fgfr3 (d) when co-cultured with B16F10-mCherry-OVA and DRG neurons. Tslp expression level was not affected in any of tested groups (e). (f–i) Using calcium microscopy, we probed whether SLPI directly activates cultured DRG neurons. We found that SLPI (0.01-10 ng/mL) induces a significant calcium influx in DRG neurons (f). SLPI-responsive neurons are mostly small-sized neurons (g-h; mean area = 151 μm2) and largely capsaicin-responsive (i; ~42%). (j) The right hindpaw of naive mice was injected with saline (20 μL) or SLPI (i.d., 1 μg/20 μL), and the mice’s noxious thermal nociceptive threshold was measured (0-6h). The ipsilateral paw injected with SLPI showed thermal hypersensitivity in contrast with the contralateral paw. Saline had no effect on the mice’s thermal sensitivity. Data are shown as box-and-whisker plots (runs from minimal to maximal values; the box extends from 25th to 75th percentile and the middle line indicates the median), for which individual data points are given (a–f, h, j), stacked bar graph on a logarithmic scale (g), and Venn Diagram (i). N are as follows: a–e: n = 2–4/groups, f: vehicle (n = 28), 10pg/ml (n = 28), 100 pg/ml (n = 132), 1,000 pg/ml (n = 191), 10 ng/ml (n = 260), capsaicin (n = 613), KCl (n = 1,139), g: 0-100 (SLPI=19; KCl=177), 100-200 (SLPI = 45; KCl = 390), 200-300 (SLPI = 16; KCl =216), 300-400 (SLPI=11; KCl = 138), 400-500 (SLPI = 5; KCl = 68), 500-600 (SLPI=2, KCl = 18), 600-700 (SLPI = 0; KCl = 10), 700-800 (SLPI=0; KCl=13), 800+ (SLPI = 0; KCl = 12), h: n = 98, i: KCl+=1139, KCl+Caps+=614, KCl+Caps+SLPI+=261, KCl+Caps-SLPI+=29, j: 0h (n = 9), SLPI at 1h (n = 6), saline at 1h (n = 3), SLPI at 3h (n = 6), saline at 3h (n=3), SLPI at 6h (n = 6), saline at 6h (n = 3). Experiments were independently repeated two (j) or three (f–i) times with similar results. Sequencing experiment was not repeated (a–e). P-values were determined by one-way ANOVA post-hoc Bonferroni (a–f); or two-sided unpaired Student’s t-test (j). P-values are shown in the figure or indicated by * for p ≤ 0.05; ** for p ≤ 0.01; *** for p ≤ 0.001. Source Data
Extended Data Fig. 6
Extended Data Fig. 6. Nociceptor ablation reduces the exhaustion of intratumoral CD8+ T cells.
(a-b) Orthotopic B16F10-mCherry-OVA (5x10⁵ cells; i.d.) cells were injected to nociceptor intact (Trpv1WT::DTAfl/WT) and ablated (Trpv1cre::DTAfl/WT) mice. Sixteen days post-B16F10-mCherry-OVA cells inoculation (5x10⁵ cells; i.d.), tumour-infiltrating CD8+ T cells were immunophenotyped (a) and were found to be more numerous in sensory neuron depleted tumours (b). (c-g) Orthotopic B16F10-mCherry-OVA (2x10⁵ cells; i.d.) cells were injected into the left hindpaw paw of nociceptor intact (n = 96; Trpv1WT::DTAfl/WT) or ablated (n = 18; Trpv1cre::DTAfl/WT) mice. When compared to their baseline threshold, littermate control mice showed significant thermal hypersensitivity on day 7, an effect that peaks on day 21 (c). In these mice, intratumoral frequency of PD-1+LAG3+TIM3+ (d) and IFNγ+ (e) CD8+ T cells increased 12 days post tumour inoculation, an effect that peaked on day 19. Finally, B16F10 tumour volume peaked on day 22 (f). When compared with littermate control mice, sensory neuron ablated mice inoculated with B16F10 cells showed no thermal pain hypersensitivity (c), reduced intratumoral frequency of PD-1+LAG3+TIM3+ CD8+ T cells (d) and tumour volume (f). In littermate control mice, thermal pain hypersensitivity (day 7) precedes the increase in intratumoral frequency of PD-1+LAG3+TIM3+ CD8+ T cells (day 12), and significant tumour growth (day 12; g). (h) Orthotopic B16F10-mCherry-OVA cells (5x10⁵ cells; i.d.) were inoculated into 8-week-old male and female sensory neuron intact or ablated mice. The mice were treated with αPD-L1 (6 mg/kg, i.p.; days 7, 10, 13, 16 post tumour inoculation) or its isotype control. On day 19, αPD-L1 potentiated the nociceptor ablation mediated reduction in B16F10-OVA tumour volume. (i–k) Orthotropic B16F10-mCherry-OVA cells (5x10⁵ cells, i.d.) were injected into a cohort of nociceptor neuron-ablated mice 3 days prior to the injection given to nociceptor intact mice. Mice from each group with similar tumour size (~85mm3) were selected and exposed to αPD-L1 (6 mg/kg, i.p.) once every 3 days for a total of 9 days. Eighteen days post tumour inoculation, we found that αPD-L1-reduced tumour growth was higher (~47%) in nociceptor-ablated mice than was observed in nociceptor-intact mice (~32%; i–j). In addition, nociceptor ablation increased the proportion of intratumoral tumour-specific (k; defined as H-2Kb+) CD8+ T cells. These differences were further enhanced by αPD-L1 treatment (i–k). (l–m) Sensory neurons ablation (Trpv1cre::DTAfl/WT) decreased growth of YUMMER1.7 cells (5×10⁵ cells; i.d.) an immunogenic version of a BrafV600ECdkn2a−/−Pten−/− melanoma cell line (l; assessed until day 12). The non-immunogenic YUMM1.7 cell line (5×10⁵ cells; i.d.; assessed until day 14) cells were injected to nociceptor intact (Trpv1WT::DTAfl/WT) and ablated mice (Trpv1cre::DTAfl/WT). Nociceptor ablation had no effect on YUMM1.7 growth (m). (n) Orthotopic B16F10-mCherry-OVA (5x10⁵ cells; i.d.) cells were injected to nociceptor intact (Trpv1WT::DTAfl/WT) and ablated mice (Trpv1cre::DTAfl/WT). The reduction in B16F10-mCherry-OVA (5×10⁵ cells; i.d.) tumour growth observed in nociceptors ablated mice was absent following systemic CD3 depletion (assessed until day 15; αCD3, 200 μg/mouse; i.p.; every 3 days). (o) To deplete their nociceptor neurons, C57BL6J mice were injected with RTX (s.c., 30, 70, 100 μg/kg) and were subsequently (28 days later) inoculated with B16F10-mCherry-OVA (2×10⁵ cells). RTX-injected mice showed reduced tumour growth when compared to vehicle-exposed mice (assessed until day 13). (p–q) Orthotopic B16F10-mCherry-OVA (5×10⁵ cells; i.d.) cells were injected to light-sensitive mice (Nav1.8cre::ChR2fl/WT). As opposed to unstimulated mice, the optogenetic activation (3.5 ms, 10Hz, 478nm, 60 mW, giving approx. 2-6 mW/mm2 with a 0.39-NA fibre placed 5–10 mm from the skin, 20 min) of tumour-innervating nociceptor neurons, when started once B16F10 tumours were visible (~20 mm3) or well established (~200 mm3), resulted in enhanced tumour growth (p, as measured until day 14) and intratumoral CGRP release (q). Data are shown as FACS plot (a; depict the gating strategy used in fig. 3d,e), as box-and-whisker plots (runs from minimal to maximal values; the box extends from 25th to 75th percentile and the middle line indicates the median) for which individual data points are given (b,k,q), scatter dot plot (c–f), percentage change from maximal thermal hypersensitivity, intratumoral frequency of PD-1+LAG3+TIM3+ CD8+ T cells and tumour volume (g), or mean ± S.E.M (h–j, l–p). N are as follows: a–b: intact (n = 29), ablated (n = 33), c: intact (n = 96), ablated (n = 19), d: intact (n = 92), ablated (n = 15), e: intact (n = 96), ablated (n = 15), f: intact (n = 96), ablated (n = 16), g: n=96, h: intact (n = 9), ablated (n = 10), intact+αPD-L1 (n = 9), ablated+αPD-L1 (n = 8), i: intact (n = 14), ablated (n = 4), j: intact+αPD-L1 (n = 12), ablated+αPD-L1 (n = 12), k: intact (n = 5), ablated (n = 6), intact+αPD-L1 (n = 5), ablated+αPD-L1 (n = 5), l: intact (n = 8), ablated (n = 11), m: intact (n = 6), ablated (n = 13), n: intact (n = 5), ablated (n = 5), intact+αCD3 (n = 6), ablated+αCD3 (n = 5), o: vehicle (n = 11), RTX (n = 10), p: Nav1.8cre::ChR2fl/WT (n = 12), Nav1.8cre::ChR2fl/WT + Light (vol. ~200 mm3) (n = 8), Nav1.8cre::ChR2fl/WT + Light (vol. ~20 mm3) (n = 8), q: Nav1.8cre::ChR2fl/WT (n = 12), Nav1.8cre::ChR2fl/WT + Light (vol. ~200 mm3) (n = 7), Nav1.8cre::ChR2fl/WT + Light (vol. ~20 mm3) (n = 9). Experiments were independently repeated two (c–g), three (h–q) or six (a,b) times with similar results. P-values are shown in the figure and determined by two-sided unpaired Student’s t-test (b–f, k,q), or two-way ANOVA post-hoc Bonferroni (h–j, l–p). Source Data
Extended Data Fig. 7
Extended Data Fig. 7. BoNT/A silencing of B16F10-innervating neurons decreases tumour growth.
(a–e) Splenocytes-isolated CD8+ T cells from naive C57BL6J mice were cultured under Tc1-stimulating conditions (ex vivo activated by CD3 and CD28, IL-12, and anti-IL4) for 48h. The cells were then exposed to BoNT/A (10–50 pg/μL) for 24h; effects on apoptosis, exhaustion, and activation were measured by flow cytometry. When compared to vehicle-exposed cells, BoNT/A did not affect the survival (a) of cultured cytotoxic CD8+ T cells, nor their relative expression of IFNγ+ (b), TNF+ (c), IL-2+ (d) and PD-1+LAG3+TIM3+ (e). (f) B16F10 (1x10⁵ cells) were cultured for 24h and subsequently exposed to BoNT/A (1.6-50 pg/μL) or its vehicle for an additional 24h. BoNT/A did not trigger B16F10 cells apoptosis, as measured by the mean fluorescence intensity of Annexin V. (g–n) One and three days prior to tumour inoculation (defined as prophylactic), the skin of 8-week-old male and female mice was injected with BoNT/A (25 pg/μL; i.d.) or its vehicle. One day after the last injection, orthotopic B16F10-mCherry-OVA (5x10⁵ cells; i.d.) were inoculated into the area pre-exposed to BoNT/A. In another group of mice, BoNT/A was administered (25 pg/μL; i.d.) one and three days after the tumour reached a volume of ~200mm3 (defined as therapeutic). The effect of neuron silencing on tumour size and tumour-infiltrating CD8+ T cell exhaustion was measured. Nineteen days post tumour inoculation, we found that the tumour volume (g,h) and weight (i) were reduced in mice treated with BoNT/A (Prophylactic group). In parallel, we found that silencing tumour-innervating neurons increased the proportion of IFNγ+ (k), TNF+ (l), and IL-2+ (m) CD8+ T cells. BoNT/A had no effect on the total number of intratumoral CD8 T cells (j) or the relative proportion of PD-1+LAG3+TIM3+ (n) CD8+ T cells. (o) One and three days prior to tumour inoculation, the skin of 8-week-old male and female sensory neuron-intact or ablated mice was injected with BoNT/A (25 pg/μL; i.d.) or its vehicle. One day following the last injection, orthotopic YUMMER1.7 cells (5×10⁵ cells; i.d.) were inoculated into the area pre-exposed to BoNT/A. The effects of nociceptor neuron ablation on tumour size and volume were measured. Thirteen days post tumour inoculation, we found that the tumour growth was lower in mice treated with BoNT/A or in sensory neuron-ablated mice. BoNT/A had no additive effects when administered to sensory neuron-ablated mice. (p) One and three days prior to tumour inoculation, the skin of 8-week-old male and female mice was injected with BoNT/A (25 pg/μL; i.d.) or its vehicle. One day following the last injection, orthotopic B16F10-mCherry-OVA cells (5×10⁵ cells; i.d.) were inoculated into the area pre-exposed to BoNT/A. On days 7, 10, 13 and 16 post tumour inoculation, the mice were exposed to αPD-L1 (6 mg/kg, i.p.) or its isotype control. Eighteen days post tumour inoculation, we found that neuron silencing using BoNT/A potentiated αPD-L1-mediated tumour reduction. Data are shown as box-and-whisker plots (runs from minimal to maximal values; the box extends from 25th to 75th percentile and the middle line indicates the median), for which individual data points are given (a–f; h–n) or as mean ± S.E.M (g,o,p). N are as follows: a-e: n = 5/groups, f: n = 3/groups, g–i: vehicle (n = 12), BoNT/A therapeutic (n = 12), BoNT/A prophylactic (n = 10), j: vehicle (n = 11), BoNT/A therapeutic (n = 12), BoNT/A prophylactic (n = 8), k–n: vehicle (n = 10), BoNT/A therapeutic (n = 12), BoNT/A prophylactic (n = 8), o: intact + vehicle (n = 9), ablated + vehicle (n = 8), intact + BoNT/A (n = 10), ablated + BoNT/A (n = 8), p: vehicle (n = 7), αPD-L1 (n = 8), αPD-L1 + BoNT/A (n = 7). Experiments were independently repeated two (a–f, o–p) or four (g–n) times with similar results. P-values are shown in the figure and determined by one-way ANOVA posthoc Bonferonni (a–f, h–n) or two-way ANOVA post-hoc Bonferroni (g,o,p). Source Data
Extended Data Fig. 8
Extended Data Fig. 8. QX-314 silencing of B16F10-innervating neurons reduces tumour growth.
(a–e) Splenocytes-isolated CD8+ T cells from naive C57BL6J mice were cultured under Tc1-stimulating conditions (ex vivo activated by CD3 and CD28, IL-12, and anti-IL4) for 48h. The cells were then exposed to QX-314 (50–150 μM) for 24h, effects on apoptosis, exhaustion and activation were measured by flow cytometry. When compared to vehicle-exposed cells, QX-314 did not affect the survival of cultured cytotoxic CD8+ T cells (a), nor their relative expression of PD-1+LAG3+TIM3+ (b), IFNγ+ (c), TNF+ (d) and IL-2+ (e). (f) B16F10 (1x10⁵ cells) were cultured for 24h. The cells were then exposed or not to QX-314 (0.1-1%) for an additional 24-72h, and cell count was analysed by bright-field microscopy. QX-314 did not affect B16F10 cells’ survival, as measured by relative cell count changes (at each time point) in comparison to vehicle-exposed cells. (g–i) One and three days prior to tumour inoculation, 8-week-old male and female wild-type mice’s right hindpaws or flanks were injected with BoNT/A (25 pg/μL; i.d.) or its vehicle. On the following day, orthotopic B16F10 cells (g: 5x10⁵ cells; i.d.; h–i: 2x10⁵ cells; i.d.) were inoculated into the area pre-exposed to BoNT/A. Starting one day post inoculation, QX-314 (0.3%) or its vehicle was administered (i.d.) once daily in another group of mice. The effects of sensory neuron silencing were tested on neuropeptide release (g), as well as mechanical (h) and thermal pain hypersensitivity (i). First, CGRP levels were increased in B16F10 tumour surrounding skin explant (assessed on day 15) in comparison to control skin; an effect further enhanced by capsaicin (1 μM; 3h) but was absent in skin pre-treated with BoNT/A (25 pg/μL) or QX-314 (0.3%; g). We also found that B16F10 injection induced mechanical (h) and thermal pain hypersensitivities (i) fourteen days post tumour inoculation. These effects were stopped by sensory neuron silencing with QX-314 or BoNT/A (h–i). (j) Orthotopic B16F10-mCherry-OVA cells (5x10⁵ cells; i.d.) were inoculated into 8-week-old male and female mice. Starting one day post inoculation, QX-314 (0.3%; i.d.; 5 sites) was injected once daily around the tumour. The effect of nociceptor neuron silencing on tumour size and tumour-infiltrating CD8+ T cell exhaustion was measured. We found that silencing tumour-innervating neurons increased the mice’s median length of survival (~270% Mantel–Haenszel hazard ratio; measured on day 19). (k–r) Orthotopic B16F10-mCherry-OVA cells (5x10⁵ cells; i.d.) were inoculated into 8-week-old male and female mice. Starting one day post inoculation (defined as prophylactic), In other groups of mice, QX-314 daily injection started once the tumour reached a volume of ~200mm3 (defined as therapeutic). As measured seventeen days post tumour inoculation, silencing tumour innervation also decreased tumour volume (k,l) and weight (m), as well as the relative proportion of PD-1+LAG3+TIM3+ (n) CD8+ T cells. QX-314 treatment also increased the total number of intratumoral CD8+ T cells (o), as well as relative proportion of IFNγ+ (p), TNF+ (q), and IL-2+ (r) CD8+ T cells. (s–t) Orthotropic B16F10-mCherry-OVA cells (5x10⁵ cells, i.d.) were injected into mice treated with QX-314 (0.3%; i.d.) 2-3 days prior to being injected into vehicle-exposed mice. Mice from each group with similar tumour size (~100mm3) were selected and exposed to αPD-L1 (6 mg/kg, i.p.) once every 3 days for a total of 9 days. Eighteen days post tumour inoculation, we found that αPD-L1-reduced tumour growth was higher (~61%) in nociceptor silenced mice than was observed in isotype vehicle-exposed mice (~49%; s-t). Data are shown as box-and-whisker plots (runs from minimal to maximal values; the box extends from 25th to 75th percentile and the middle line indicates the median), for which individual data points are given (a–e, g, l–r), as mean ± S.E.M (f,h,i,k,s,t), or as Mantel–Cox regression analysis (j). N are as follows: a: n = 4/groups, b–e: n = 5/groups, f: n = 3/groups, g: naïve (n = 4), vehicle (n = 7), B16F10+vehicle (n = 5), B16F10+BoNT/A (n = 5), B16F10+QX-314 (n = 5), h–i: n = 6/groups, j: vehicle (n = 89), QX-314 (n = 12), k: vehicle (n = 21), QX-314 prophylactic (n = 21), QX-314 therapeutic (n = 17), l: vehicle (n = 26), QX-314 therapeutic (n = 26), QX-314 prophylactic (n = 28), m: vehicle (n = 25), QX-314 therapeutic (n = 22), QX-314 prophylactic (n = 25), n: vehicle (n = 31), QX-314 therapeutic (n = 29), QX-314 prophylactic (n = 28), o: n = 30/groups, p–r: vehicle (n = 24), QX-314 therapeutic (n = 23), QX-314 prophylactic (n = 25), s: vehicle (n = 9), QX-314 (n = 13), t: vehicle + αPD-L1 (n = 18), QX-314 + αPLD1 (n = 13). Experiments were independently repeated two (a–i, s–t) or four (j–r) times with similar results. P-values are shown in the figure and determined by one-way ANOVA posthoc Bonferonni (a–g, l–r), two-sided unpaired Student’s t-test (h–i), Mantel–Cox regression (j), or two-way ANOVA posthoc Bonferroni (k, s–t). Source Data
Extended Data Fig. 9
Extended Data Fig. 9. Nociceptor-released CGRP increases cytotoxic CD8+ T cell exhaustion.
(a–b) Splenocytes-isolated CD8+ T cells were cultured under Tc1-stimulating condition (ex vivo activated by CD3 and CD28, IL-12, and anti-IL4) for 48h. The cells were then cultured or not with wild-type DRG neurons and exposed to capsaicin (1 μM, challenged once every two days) or its vehicle. As measured after 4 days stimulation, capsaicin-stimulated intact neuron increased the proportion of PD-1+LAG3+TIM3+ (a) cytotoxic CD8+ T cells, while it decreased the one of IFNγ+ (b). (c–d) Splenocytes-isolated CD8+ T cells were cultured under Tc1-stimulating conditions (ex vivo activated by CD3 and CD28, IL-12, and anti-IL4) for 48h. In the presence of peptidase inhibitors (1 μL/mL), naive DRG neurons were cultured in the presence of BoNT/A (50 pg/mL) or its vehicle for 24h. The cells were then washed, stimulated (30 min) with KCl (50mM), and the conditioned medium collected. On alternate days for 4 days, the cytotoxic CD8+ T cells were exposed or not to a RAMP1 blocker (CGRP8–37; 2  μg/mL) and challenge (1:2 dilution) with fresh KCl-induced conditioned medium from naive, or BoNT/A-silenced neurons. As measured after 4 days stimulation, KCl-stimulated neuron-conditioned medium increased the proportion of PD-1+LAG3+TIM3+ (c) cytotoxic CD8+ T cells, while it decreased the one of IFNγ+ (d). Such effect was absent when cytotoxic CD8+ T cells were co-exposed to the RAMP1 blocker CGRP8–37 or challenged with the neuron conditioned medium collected from BoNT/A-silenced neurons (c–d). (e–f) Splenocytes-isolated CD8+ T cells from wild-type and Ramp1−/ mice were cultured under Tc1-stimulating conditions (ex vivo activated by CD3 and CD28, IL-12, and anti-IL4) for 48h. On alternate days for 4 days, the cytotoxic CD8+ T cells were exposed to CGRP (0.1 μM) or its vehicle. As measured after 4 days stimulation, representative flow cytometry plots (f) show that CGRP decrease RampWT cytotoxic CD8+ T cells expression of IFNγ+ (e,f), TNF+ (f), and IL-2+ (f) when exposed to CGRP. Inversely, CGRP increase the proportion of PD-1+LAG3+TIM3+ in Ramp1WT cytotoxic CD8+ T cells (f). Ramp1−/ cytotoxic CD8+ T cells were protected from the effect of CGRP (e–f). (g–i) Splenocytes-isolated CD8+ T cells from naive OT-I mice were cultured under Tc1-stimulating conditions (ex vivo activated by CD3 and CD28, IL-12, and anti-IL4) for 48h. B16F10-mCherry-OVA cells (1×10⁵ cells) were then cultured with or without OT-I cytotoxic CD8+ T cells (4×10⁵ cells). Tc1-stimulated OT-I-CD8+ T cells lead to B16F10-OVA cell apoptosis (AnnexinV+7AAD+; g, measured after 48h; h–i, measured after 24h). B16F10-mCherry-OVA cells elimination by cytotoxic CD8+ T cells was reduced when the co-cultures were challenged (1:2 dilution; once daily for two consecutive days) with fresh conditioned medium collected from capsaicin (1 μM)-stimulated naive DRG neurons (g; measured after 48h). Similarly, KCl (50mM)-stimulated naive DRG neurons conditioned medium (1:2 dilution) reduced B16F10-mCherry-OVA apoptosis (h; measured after 24h). This effect was blunted when the cells were co-exposed to the RAMP1 blocker CGRP8-37 (h; 2 μg/mL; measured after 24h). CGRP (0.1 μM) challenges also reduced OT-I cytotoxic CD8+ T cells elimination of B16F10-OVA cell (i; measured after 24h). Data are shown as box-and-whisker plots (runs from minimal to maximal values; the box extends from 25th to 75th percentile and the middle line indicates the median), for which individual data points are given (a–e, g–h), or representative FACS plot (f, i). N are as follows: a: CD8 + vehicle (n = 4), CD8 + capsaicin (n = 9), CD8 + neuron + capsaicin (n = 9), b: n = 5/groups, c: CD8 (n = 6), CD8 + KCl-induced neurons CM (n = 5), CD8 + KCl-induced neurons CM + CGRP8-37 (n = 6), CD8 + KCl-induced neurons CM + BoNT/A (n = 6), d: n = 5/groups, e: Ramp1WT CD8 + vehicle (n = 7), Ramp1WT CD8 + CGRP (n = 8), Ramp1−/ CD8 + vehicle (n = 6), Ramp1−/ CD8 + CGRP (n = 6), g: B16F10 (n = 3), B16F10 + OT-I CD8 (n = 4), B16F10 + OT-I CD8 + KCl-induced neuron CM (n = 4), h: B16F10 + OT-I CD8 (n = 4), B16F10 + OT-I CD8 + KCl-induced neuron CM (n = 4), B16F10 + OT-I CD8 + KCl-induced neuron CM + CGRP8–37 (n = 5). Experiments were repeated a minimum of three independent times with similar results. P-values are shown in the figure and determined by one-way ANOVA posthoc Bonferroni (a–e, g–h). Source Data
Extended Data Fig. 10
Extended Data Fig. 10. The CGRP–RAMP1 axis promotes intratumoral CD8+ T cell exhaustion.
(a–e) Orthotopic B16F10-mCherry-OVA (5x10⁵ cells; i.d.) cells were injected to nociceptor intact (Nav1.8WT::DTAfl/WT) and ablated mice (Nav1.8cre::DTAfl/WT). As measured fifteen days post inoculation, NaV1.8+ nociceptor-ablated mice had lower proportion of PD-1+LAG3+TIM3+ (a) CD8+ T cells, but increased levels of IFNγ+ (b), TNF+ (c), IL-2+ (d) CD8+ T cells. B16F10-mCherry-OVA (5x10⁵ cells; i.d.)-tumour surrounding skin was also collected and capsaicin-induced CGRP release assessed by ELISA. Intratumoral CGRP levels positively correlate with the proportion of PD-1+LAG3+TIM3+ CD8+ T cells (e). (f) Orthotopic B16F10-mCherry-OVA cells (5x10⁵ cells; i.d.) were inoculated into 8-week-old female sensory neuron intact or ablated mice. In nociceptor-ablated mice, recombinant CGRP injection (100nM, i.d., once daily) rescues intratumoral CD8+ T cells exhaustion (PD-1+LAG3+TIM3+). (g) Orthotopic B16F10-mCherry-OVA cells (5x10⁵ cells; i.d.) were inoculated into 8-week-old male and female mice. Starting one day post inoculation, the RAMP1 antagonist BIBN4096 (5 mg/kg, i.p., every other day) was administered systemically. We found that blocking the action of CGRP on RAMP1-expressing cells, increased the mice’s median length of survival (~270% Mantel–Haenszel hazard ratio; measured on day 19). (h–m) Orthotopic B16F10-mCherry-OVA cells (5x10⁵ cells; i.d.) were inoculated into 8-week-old male and female mice. Starting one day post inoculation (defined as prophylactic), the RAMP1 antagonist BIBN4096 (5 mg/kg, i.p., every other day) was administered systemically. In another group of mice, BIBN4096 (5 mg/kg, i.p., every other day) injections were started once the tumour reached a volume of ~200mm3 (defined as therapeutic). The effect of nociceptor neuron-silencing on tumour size and tumour-infiltrating CD8+ T cell exhaustion was measured. As assessed thirteen days post tumour inoculation, BIBN4096 decreased tumour volume (h) and weight (i) but increased the relative proportion of IFNγ+ (k), TNF+ (l), and IL-2+ (m) CD8+ T cells. BIBN4096 had no effect on the number of intratumoral CD8+ T cells (j). When administered as therapeutic, BIBN4096 reduced tumour volume (h) and weight (i) but had limited effect on CD8+ T cells’ cytotoxicity (j–m). (n) Orthotopic B16F10-mCherry-OVA cells (5x10⁵ cells; i.d.) were inoculated into 8-week-old male and female sensory neuron-intact (Trpv1WT::DTAfl/WT) and ablated (Trpv1cre::DTAfl/WT) mice. Starting one day post inoculation, BIBN4096 (5 mg/kg) or its vehicle was administered (i.p.) on alternate days; effects on tumour volume were measured. Fourteen days post tumour inoculation, we found that tumour growth was reduced in sensory neuron-ablated mice and in BIBN4096-treated mice. BIBN4096 had no additive effect when given to sensory neuron-ablated mice. (o–s) Splenocytes-isolated CD8+ T cells from naïve C57BL6J mice were cultured under Tc1-stimulating conditions (ex vivo activated by CD3 and CD28, IL-12, and anti-IL4) for 48h. The cells were then exposed to BIBN4096 (1–4 μM) for 24h; effects on apoptosis, exhaustion and activation were measured by flow cytometry. When compared to vehicle-exposed cells, BIBN4096 did not affect the survival (o) of cultured cytotoxic CD8+ T cells, nor their relative expression of PD-1+LAG3+TIM3+ (p), IFNγ+ (q), TNF+ (r), and IL-2+ (s). (t) B16F10 cells (1x10⁵ cells) were cultured for 24h. The cells were then exposed (or not) to BIBN4096 (1-8 μM) for an additional 24h; effects on apoptosis were measured by flow cytometry. BIBN4096 did not trigger B16F10 cells apoptosis, as measured by the mean fluorescence intensity of Annexin V. (u-w) Naive splenocyte CD8+ T cells were FACS purified from Ramp1WT (CD45.1+) or Ramp1−/ (CD45.2+) mice, expanded and stimulated (CD3 and CD28 + IL-2) in vitro. 8-week-old female Rag1−/ mice were transplanted (i.v., 2.5x10⁶ cells) with either Ramp1−/ or Ramp1WT CD8+ T cells or 1:1 mix of Ramp1−/ and Ramp1WT CD8+ T cells. One week post transplantation, the mice were inoculated with B16F10-mCherry-OVA cells (5x10⁵ cells; i.d.). Ten days post tumour inoculation, we retrieved a similar number of tumours draining lymph node CD8+ T cells across the three tested groups (u). The relative proportion of intra-tumour PD-1+LAG3+TIM3+ CD8+ T cells was lower in Ramp1−/ transplanted mice (v). Within the same tumour, intratumoral CD8+ T cell exhaustion was immunophenotyped by flow cytometry (representative panel shown inw) and showed that the relative proportion of PD-1+LAG3+TIM3+ CD8+ T cells was ~3-fold lower in Ramp1−/ CD8+ T cells than in Ramp1WT CD8+ T cells (w). Data are shown as box-and-whisker plots (runs from minimal to maximal values; the box extends from 25th to 75th percentile and the middle line indicates the median), for which individual data points are given (a–d, f, h–m, o–v), linear regression (e), Mantel–Cox regression (g), mean ± S.E.M (n), or as FACS plot (w). N are as follows a–e: Nav1.8WT::DTAfl/WT (n = 18), Nav1.8cre::DTAfl/WT (n = 10), f: Trpv1WT::DTAfl/WT (n = 16), Trpv1cre::DTAfl/WT +CGRP (n = 11), g: vehicle (n = 89), BIBN4096 (n = 16), h–m: Vehicle (n = 13), BIBN4096 therapeutic (n = 18), BIBN4096 prophylactic (n = 16), n: Trpv1WT::DTAfl/WT + vehicle (n = 8), Trpv1WT::DTAfl/WT + BIBN4096 (n = 9), Trpv1cre::DTAfl/WT + vehicle (n = 7), Trpv1cre::DTAfl/WT + BIBN4096 (n = 7), o: vehicle (n = 5), 1µM BIBN4096 (n = 3), 4 µM BIBN4096 (n = 5), p–s: n = 5/groups, t: n = 4/groups, u–w: n = 5/groups. Experiments were independently repeated twice (a–f, n–w) or four (g–m) times with similar results. P-values are shown in the figure and determined by two-sided unpaired Student’s t-test (a–d, f,v), simple linear regression analysis (e), Mantel–Cox regression (g), by one-way ANOVA posthoc Bonferroni (h–m; o–u), or two-way ANOVA post-hoc Bonferroni (n). Source Data
Extended Data Fig. 11
Extended Data Fig. 11. RAMP1 expression in patient melanoma-infiltrating T cells correlates with worsened survival and poor responsiveness to ICIs.
(a–l) In silico analysis of Cancer Genome Atlas (TCGA) data linked the survival rate among 459 patients with melanoma with their relative expression levels of various genes of interest (determined by bulk RNA sequencing of tumour biopsy). Kaplan–Meier curves show the patients’ survival after segregation in two groups defined by their low or high expression of a gene of interest. Increased gene expression (labelled as high; red curve) of TUBB3 (b), PGP9.5 (c), Nav1.7 (E), SLPI (k) and RAMP1 (l) in biopsy correlate with decreased patient survival (p≤0.05). The mantel–Haenszel hazard ratio and number of patients included in each analysis are shown in the figure (a–l). Experimental details were defined in Cancer Genome Atlas (TCGA). (m) In silico analysis of single-cell RNA sequencing of human melanoma-infiltrating T cells revealed that RAMP1+ T cells downregulated Il-2 expression and strongly overexpressed several immune checkpoint receptors (PD-1, TIM3, LAG3, CTLA4, CD28, ICOS, BTLA, CD27) in comparison to RAMP1- T cells. Individual cell data are shown as a log2 of 1 + (transcript per million / 10). Experimental details and cell clustering were defined in Tirosh et al. N are defined in each panel. (n–p) On the basis of the clinical response of patients with melanoma to immune checkpoint blocker, patients were clustered into two groups defined as ICI-responsive or ICI-resistant. In silico analysis of single-cell RNA sequencing of patients’ biopsies revealed that tumour-infiltrating CD8+ T cells from patients who were resistant to ICIs significantly overexpressed RAMP1 (2.0-fold), PD-1 (1.7-fold), LAG3 (1.6-fold), CTLA4 (1.6-fold), and TIM3 (1.7-fold; n–p). Individual cell data are shown as a log2(1+(transcript per million/10). Experimental details and cell clustering were defined in Jerby-Arnon et al. P-values are shown in the figure and determined by two-sided unpaired Student’s t-test. N are defined in each panel (n–o). Source Data
Extended Data Fig. 12
Extended Data Fig. 12. Melanoma-innervating nociceptors attenuate cancer immunosurveillance.
Melanoma growth sets off anti-tumour immune responses, including the infiltration of effector CD8 T cells and their subsequent release of cytotoxic cytokines (i.e., IFNγ, TNF, Granzyme B). By acting on tissue-resident nociceptor neurons, melanoma-produced SLPI promotes pain hypersensitivity, tweaks the neurons’ transcriptome, and drives neurite outgrowth. These effects culminate in dense melanoma innervation by nociceptors and abundant release of immunomodulatory neuropeptides. CGRP, one such peptide, acts on tumour-infiltrating effector CD8+ T cells that express the CGRP receptor RAMP1, increasing their expression of immune checkpoint receptors (i.e., PD-1, LAG3, TIM3). Therefore, along with the immunosuppressive environment present in the tumour, nociceptor-produced CGRP leads to the functional exhaustion of tumour-infiltrating CD8+ T cells, which opens the door to unchecked proliferation of melanoma cells. Genetically ablating (i.e., TRPV1 lineage) or pharmacologically silencing (i.e., QX-314, BoNT/A) nociceptor neurons as well as blocking the action of CGRP on RAMP1 using a selective antagonist (i.e., BIBN4096) prevents effector CD8+ T cells from undergoing exhaustion. Therefore, targeting melanoma-innervating nociceptor neurons constitutes a novel strategy to safeguard host anti-tumour immunity and stop tumour growth.

References

    1. Amit M, et al. Loss of p53 drives neuron reprogramming in head and neck cancer. Nature. 2020;578:449–454. - PMC - PubMed
    1. Magnon C, et al. Autonomic nerve development contributes to prostate cancer progression. Science. 2013;341:1236361. - PubMed
    1. Mauffrey P, et al. Progenitors from the central nervous system drive neurogenesis in cancer. Nature. 2019;569:672–678. - PubMed
    1. Zahalka AH, et al. Adrenergic nerves activate an angio-metabolic switch in prostate cancer. Science. 2017;358:321–326. - PMC - PubMed
    1. Zahalka AH, Frenette PS. Nerves in cancer. Nat. Rev. Cancer. 2020;20:143–157. - PMC - PubMed

Publication types

MeSH terms