. 2022 Nov;611(7935):365-373.
doi: 10.1038/s41586-022-05394-6. Epub 2022 Nov 2.

Extracellular fluid viscosity enhances cell migration and cancer dissemination

Affiliations

Extracellular fluid viscosity enhances cell migration and cancer dissemination

Kaustav Bera et al. Nature. 2022 Nov.

Abstract

Cells respond to physical stimuli, such as stiffness1, fluid shear stress2 and hydraulic pressure3,4. Extracellular fluid viscosity is a key physical cue that varies under physiological and pathological conditions, such as cancer5. However, its influence on cancer biology and the mechanism by which cells sense and respond to changes in viscosity are unknown. Here we demonstrate that elevated viscosity counterintuitively increases the motility of various cell types on two-dimensional surfaces and in confinement, and increases cell dissemination from three-dimensional tumour spheroids. Increased mechanical loading imposed by elevated viscosity induces an actin-related protein 2/3 (ARP2/3)-complex-dependent dense actin network, which enhances Na+/H+ exchanger 1 (NHE1) polarization through its actin-binding partner ezrin. NHE1 promotes cell swelling and increased membrane tension, which, in turn, activates transient receptor potential cation vanilloid 4 (TRPV4) and mediates calcium influx, leading to increased RHOA-dependent cell contractility. The coordinated action of actin remodelling/dynamics, NHE1-mediated swelling and RHOA-based contractility facilitates enhanced motility at elevated viscosities. Breast cancer cells pre-exposed to elevated viscosity acquire TRPV4-dependent mechanical memory through transcriptional control of the Hippo pathway, leading to increased migration in zebrafish, extravasation in chick embryos and lung colonization in mice. Cumulatively, extracellular viscosity is a physical cue that regulates both short- and long-term cellular processes with pathophysiological relevance to cancer biology.


Conflict of interest statement

The authors declare no competing interests.

Figures

Fig. 1
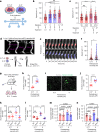
Fig. 1. Viscosity enhances cell migration and promotes an ARP2/3-mediated dense actin network at the leading edge.
a,b, Speeds of MDA-MB-231 cells (a) and other indicated cell types (b) inside confining channels at prescribed viscosities. The red lines represent the median of ≥69 cells from ≥3 experiments. c, Cell trajectories on 2D collagen-coated surfaces after 10 h. d, Cells disseminating from 3D spheroids. e, The time required for the first cell dissociation from each spheroid (n ≥ 53) from 3 experiments. f, Airyscan images of phalloidin stained cells on collagen-coated substrates. The red arrow indicates high F-actin staining along the cell edge. g, The fraction of cell-projected area with a Lifeact–GFP-rich lamella for n ≥ 28 cells from 3 experiments. h, The leading edge of Lifeact–GFP-expressing cells on collagen-coated surfaces at t = 0 min (red) and t = 2 min (cyan) (left). Right, leading-edge lamella growth in n ≥ 19 cells from 3 experiments. Data are the moving average ± s.e.m. P < 0.05 for all points t ≥ 50 s. Time is shown as min:s. i,j, STORM reconstruction (i) and density quantification (j) of F-actin for cells (n ≥ 13) on substrates from 2 experiments. k, The average actin density over time from 20 stochastic simulations. Viscous forces were applied at t = 6 s (red arrow) and maintained until the end of the simulation. l, Confocal images of cells expressing Lifeact–GFP and ARP3–mCherry in confinement. The red arrow indicates high ARP3 intensity at leading-edge protrusions at 8 cP. m, The relative ARP3–mCherry intensity along normalized cell length in confined cells. Data are the moving average ± s.e.m. for n = 21 cells from 4 experiments. ***P < 0.001 for all comparisons at normalized cell length > 0.96. The x axis is discontinued between 0.25 and 0.75 to highlight differences at the cell edges. n, Confined migration speeds of SC versus ARP3/ARPC4 double-knockdown cells (n = 90) from 3 experiments. For e, g, j and n, data are mean ± s.d. Unless otherwise indicated, statistical comparison was performed with respect to 0.77 cP. Statistical analysis was performed using Kruskal–Wallis tests followed by Dunn’s test (a and n), Mann–Whitney U-tests (BrM2 only) or unpaired t-tests after log-transformation (other cells) (b), unpaired t-tests (e, g and j) and two-way analysis of variance (ANOVA) followed by Šidák’s test (h and m). Scale bars, 250 μm (c), 50 μm (d), 25 µm (f, white), 3 µm (f, red), 10 µm (h), 2 µm (i), 20 µm (l). The cell model was MDA-MB-231 unless otherwise indicated. *P< 0.05, **P< 0.01, ***P< 0.001, ****P < 0.0001. Source data
Fig. 2
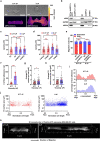
Fig. 2. Viscosity promotes NHE1-dependent cell swelling, which activates TRPV4 leading to calcium influx.
a, The volume of Lifeact–GFP-labelled MDA-MB-231 cells (n ≥ 28) at the indicated viscosities from 3 experiments. b, Confocal images of confined MDA-MB-231 cells stained for NHE1 and phalloidin. c, Front-to-rear NHE1 intensity ratio in NHE1-immunostained cells (n ≥ 16) from 3 experiments. d, The rate of pH recovery in pHRed-expressing MDA-MB-231 cells (n ≥ 29) from 5 experiments. e, The volume of SC and shNHE1 Lifeact–GFP-tagged MDA-MB-231 cells (n ≥ 36) from 3 experiments. f, Confined migration speeds of SC and shNHE1 MDA-MB-231 cells (n ≥ 113) from 3 experiments compared with the two-phase model predictions. g, The elevated Flipper-TR lifetimes in MDA-MB-231 cells on 2D surfaces indicate high membrane tension. h, The membrane tension in wild-type MDA-MB-231 cells after treatment with vehicle (veh.), CK666 or EIPA, and in SC or shTRPV4 cells (n ≥ 58) from 3 experiments. i, The number of calcium flashes in SC, shTRPV4 or shNHE1 MDA-MB-231 cells (n ≥ 52) on 2D surfaces from 3 experiments. j,l, TRPV4 currents (I) in SC- and shTRPV4 (j) or shNHE1 (l) MDA-MB-231 cells (n ≥ 3) with or without the TRPV4 inhibitor HC-067047 from ≥3 experiments. k, Confined migration speeds of SC and shTRPV4 MDA-MB-231 cells (n ≥ 129) from 3 experiments. m, The time required for the first cell dissociation from each spheroid (n ≥ 57) after treatment with vehicle control or the TRPV4 inhibitor GSK 2193874 (GSK2) from 3 experiments. n, The number of calcium flashes in MDA-MB-231 cells (n ≥ 29) treated with the ARP2/3 inhibitor CK666 from 2 experiments. o, Confocal images of confined MDA-MB-231 cells stained for NHE1, ezrin and phalloidin. p, Front-to-rear NHE1 or ezrin intensity ratio from immunostained cells (n ≥ 24) from 2 experiments. Data are mean ± s.d. (a, cf, h, i, k, m, n and p) and mean ± s.e.m. (j and l). Statistical analysis was performed using unpaired t-tests after log-transformation (a, c and d), one-way ANOVA followed by Tukey’s test after log-transformation (e and m), Kruskal–Wallis tests followed by Dunn’s test (f, h, i, k and n), one-way ANOVA followed by Holm–Šidák’s test (j and l) and Mann–Whitney U-tests (p). Scale bars, 20 µm (b and o) and 10 µm (g). Source data
Fig. 3
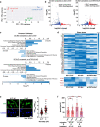
Fig. 3. TRPV4-mediated activation of RHOA–ROCK–myosin II contractility.
a, The lifetimes of the RHOA activity biosensor in MDA-MB-231 cells on a 2D surface at the indicated viscosities. b, The subcellular distribution of RHOA activity in n ≥ 30 cells on a 2D surface from 4 experiments. c, RHOA activity in SC and shTRPV4 MDA-MB-231 cells (n ≥ 21) on a 2D surface from 3 experiments. d, Confocal images of GFP–AHD-expressing MDA-MB-231 cells in confinement. The red arrowheads indicate regions of active RHOA. e, GFP–AHD intensity in different segments of confined MDA-MB-231 cells (n ≥ 33) at 8 cP in the presence of vehicle control or NHE1 inhibitor from ≥3 experiments. f, GFP–AHD intensity in different segments of confined MDA-MB-231 cells (n ≥ 33) after treatment with vehicle control or the TRPV4 inhibitor GSK 2193874 (GSK2) from 3 experiments. The intensity in each segment was normalized to the mean intensity of the entire cell in e and f. g, Confocal images of MIIA–GFP-expressing and Lifeact–Ruby-expressing MDA-MB-231 cells migrating in confinement. The red arrowheads indicate regions of intense MIIA localization. h, The confined migration speeds of SC and MIIA and MIIB single- or double-knockdown MDA-MB-231 cells (n ≥ 38) from 2 experiments. Data are mean ± s.d. i, Schematic of the proposed viscosity-sensing pathway. OEM, osmotic engine model. The schematic in i was created using Servier Medical Art. Statistical analysis was performed using unpaired t-tests (b), Kruskal–Wallis tests followed by Dunn’s test (c and h) and two-way ANOVA followed by Tukey’s test (e and f). Scale bars, 20 µm (a, d and g). Source data
Fig. 4
Fig. 4. MDA-MB-231 cells preconditioned to elevated viscosity exhibit enhanced migration, extravasation and lung colonization.
a, Illustration of cell preconditioning at the indicated viscosities. b, Confined migration speeds of preconditioned cells (0.77 or 8 cP for 6 days) resuspended at the indicated migration viscosity. Data are mean ± s.d. for n ≥ 140 cells from 3 experiments. c, The confined migration speeds of preconditioned SC or shTRPV4 cells allowed to migrate at 0.77 cP. Data are mean ± s.d. for n ≥ 146 cells from 3 experiments. d, Confocal image of 3 day post-fertilization (d.p.f.) zebrafish ISVs with measurements of vessel width (top). Bottom, experimental design of migration studies in zebrafish. e,f, Time-lapse confocal images (e) and average speeds (f) of preconditioned cells (n ≥ 77) inside ISVs from 3 experiments. The red lines indicate the median (thick) and quartiles (thin). g, The experimental design of mouse tail-vein experiments. h, The number of human vimentin-positive colonies in the lungs 48 h after injection. Data are mean ± s.e.m. for 8 mice per group from 2 experiments. i,j, Confocal images of lung sections (i) and quantification of human vimentin-positive metastatic colonies (j) 3 weeks after injection. Data are mean ± s.e.m. for a total of ≥7 mice per group from 2 experiments. k,l, The number of human vimentin-positive metastatic colonies in the lungs 48 h (k) and 3 weeks (l) after injection. Data are mean ± s.e.m. for ≥9 mice per group from 2 experiments. The squares represent experiments with PVP as the medium additive. m,n, qPCR detection of human DNA in the lungs of mice 48 h (m) or 3 weeks (n) after injection. Data are mean ± s.d. for ≥9 mice per group. Squares are from experiments with PVP. Statistical analysis was performed using Kruskal–Wallis tests followed by Dunn’s test (b and c), Mann–Whitney U-tests (f), unpaired t-tests (h and j), one-way ANOVA followed by Tukey’s test (ln) and one-way ANOVA followed by Tukey’s test on log-transformed data (k). Scale bars, 20 µm (d), 30 µm (e) and 200 µm (i). The schematics in a, d and g were created using Servier Medical Art. Source data
Extended Data Fig. 1
Extended Data Fig. 1. Measurement of extracellular fluid viscosity and its effects on cell migration and proliferation.
a, Dependence of medium viscosity on addition of prescribed concentrations of methylcellulose stock solution. b, Osmolarity measurements at different concentrations of methylcellulose. Data represent mean ± s.d for 0% methylcellulose or mean ± range for 0.015% and 0.03% methylcellulose. c, Schematic of microfluidic device used to assess confined cell migration. d, Dependence of medium viscosity on addition of prescribed concentrations of Polyvinylpyrrolidone K 90 (PVP). Data represent mean ± s.d. from ≥3 independent measurements with best fit line in (a) and (d). s.d. bars are smaller than the size of the symbols in some cases. e,f,g, Confined migration speed of MDA-MB-231 cells in media prepared using different macromolecules. Data represent the mean ± s.d. for n≥101 cells from ≥2 experiments. h, Migration speed of MDA-MB-231 cells on 2D collagen-I-coated surfaces. Data represent the mean ± s.d. for n≥112 cells from 5 experiments. i, Wound healing time of indicated cell lines at 0.77 cP and 8 cP or 9.5 cP. Data represent the mean ± s.d. from 4 experiments. j, Total number of MDA-MB-231 cells and k, percentage of cells with Ki67 positive nuclei on 2D collagen-I-coated surfaces after addition of media of prescribed viscosities. Data represent the mean ± s.d. for n > 200 cells per ROI imaged, for ≥6 ROIs from 2 experiments. l, Cell entry time in confining channels at the indicated viscosities. Data represent the mean ± s.d. for n = 52 cells from 3 experiments. Tests performed: Kruskal-Wallis followed by Dunn’s multiple comparisons (eg), unpaired t-test (i), and after log transformation of data (h,l), and two-way ANOVA followed by Šidák’s multiple comparisons (j,k). Source data
Extended Data Fig. 2
Extended Data Fig. 2. Effects of extracellular viscosity on cell phenotype, migration velocity and actin retrograde flow.
a, Representative confocal images of Lifeact-GFP-tagged MDA-MB-231 cells inside confining channels displaying a predominantly blebbing or protrusive phenotype at 0.77 cP versus 8 cP, respectively. Blebs are indicated by white arrow, while yellow arrowheads point to leading edge protrusions. Scale bar: 5 µm. b, Percentage of MDA-MB-231 cells and c, SUM159 cells migrating in confining channels with blebbing versus protrusive phenotypes at 0.77 cP and 8 cP. Data represent mean ± s.e.m. for n≥20 cells per experiment from 4 (b) or 6 (c) experiments. d,e, Confined migration velocity of MDA-MB-231 (d) and SUM159 (e) cells in the presence of vehicle control or LatA (2 µM). Data represent the mean ± s.d. for n≥57 cells from 3 experiments. f, Schematic of image processing strategy used to calculate instantaneous edge growth of Lifeact-GFP-expressing cells on 2D. g, Heatmap summarizing relative occurrences of instantaneous leading-edge lamella growth of Lifeact-GFP-expressing MDA-MB-231 cells on 2D substrate. Blue to red colour scale indicates low to high number of fractional occurrences. Negative growth indicates reduction of cell area or retraction, while positive growth indicates forward protrusion. Data summarized from > 450 events in 20 cells per condition imaged over 3 experiments. h, (Top) Snapshots of confocal micrographs of Lifeact-GFP-expressing MDA-MB-231 cells on 2D at 0.77 cP and 8 cP. The dashed yellow lines are used for kymographs at the bottom. At 0.77 cP, the leading edge extends and contracts rapidly as indicated by the “spikes” in the kymograph (red arrowheads). At 8 cP, the leading edge has slow yet persistent growth (yellow arrowhead) with occasional retraction events (red arrowhead). White bars: 10 µm; for kymographs, black horizontal bar: 5 µm and vertical bar: 30 s. i, Representative time-lapse confocal image sequence of PA-GFP fused actin dynamics after it is activated at the interior of cells on 2D. Red “X” symbols indicate points of UV excitation. Scale bar: 25 µm. j,k, Uninterrupted protrusion growth rate (j) and retrograde actin flow rate (k) in β-actin-mRFP-PAGFP-expressing MDA-MB-231 cells on 2D at 0.77 and 8 cP. Data are mean ± s.d. for n≥ 36 cells from 3 experiments. Tests performed: Two-way ANOVA followed by Šidák’s multiple comparisons (b,c), Kruskal-Wallis followed by Dunn’s multiple comparisons (d,e), Mann Whitney test (j), and unpaired t-test (k). Images are representative of 3 (a,h,i) experiments. Source data
Extended Data Fig. 3
Extended Data Fig. 3. Stochastic model predictions on actin network architecture.
a, Representative visualization of stochastic model results with actin filaments shown in green, barbed ends as red dots, and pointed ends as blue dots. To reach steady state, the simulation was allowed to run for 6 s during which the network grew only against membrane tension from 0 to ~1250 nm as indicated by the red arrowheads. Subsequently, the network grew against the membrane tension plus the indicated viscous forces (0.8 or 8 cP). b, Actin network density over time of individual simulation runs. c, Growth velocity of the actin network front over time. Each line (b,c) represents individual simulation runs. d, Growth velocity of the actin network front over time, averaged from 20 individual simulation runs per condition in (c). e, Time-averaged actin network front growth velocity over 4 s following the application of viscous forces. f, Temporal variation in density of filaments in three different angle bins. Zero degrees represent filaments perpendicular to network edge while 90 degrees are parallel to the edge. Red arrowhead indicates time instant of viscous force application. The filament density at each angle bins is flat at 0.8 cP after turning on the viscous forces. At 8 cP, there is an increase in filament density across all the bins indicating a denser actin network at the cell edge facing the viscous resistance. g, Actin filament, capped barbed end, and pointed end density quantified at two different viscous forces. After application of the 8 cP viscous force, there is a sharp rise of pointed ends and increase in filament density, presumably resulting from increased ARP2/3-mediated nucleation. In e, f and g, data are mean ± s.d. from 20 runs per condition. Unpaired t-test was used in e. Source data
Extended Data Fig. 4
Extended Data Fig. 4. The spatial localization and role of ARP2/3 in cell phenotype and migration as well as the distribution of focal adhesions in confinement at 0.77 and 8 cP.
a, Confocal images of ARP3-mCherry-tagged cells on 2D. Lower panel shows ARP3 intensity as a heatmap. Scale bar: 20 µm. b, Representative western blot from cells transduced with shRNA sequences to ARP3 and/or ARPC4 or a noncoding scramble control sequence. For gel source data, see Supplementary Fig. 1. c,d, Confined migration speeds of SC, shARPC4 or shARP3 cells (c) or wild-type cells under CK666 or vehicle control treatment (d). Data are mean ± s.d. for n = 62 cells (c) or n = 88 cells (d) from 2 experiments. e, Percentage of SC, dual ARP3/ARPC4-KD cells with blebbing versus protrusive phenotypes inside confining channels. Data are mean ± s.e.m. for n≥20 cells per experiment from 3 experiments. f, Number of focal adhesions per cell migrating in confinement, as quantified from cells expressing paxillin-GFP. Data are mean ± s.d. g,h, Average focal adhesion volume (g) or surface area (h) per cell migrating in confinement at different viscosities. Data are mean ± s.e.m. i, Percentage of focal adhesions spatially distributed along normalized cell length for cells migrating in confinement at prescribed viscosities. Data in (fi) are for n≥44 cells per condition from 3 experiments. j, Spatial distribution of focal adhesion areas in cells migrating in confinement at 0.77 cP and 8 cP for 50 and 44 cells, respectively. k, 3D reconstructed confocal images of paxillin-GFP in cells migrating in confinement at 0.77 or 8 cP. Tests performed: One-way ANOVA followed by Tukey’s multiple comparisons (c), Kruskal-Wallis followed by Dunn’s multiple comparisons (d), two-way ANOVA followed by Tukey’s multiple comparisons (e), Mann Whitney test (f), and unpaired t-test on log transformed data (g,h). Images are representative of 2 (a) or 3 (k) biological replicas. Cell model: MDA-MB-231. Source data
Extended Data Fig. 5
Extended Data Fig. 5. The roles of NHE1, AQP5 and MOSICs in cell mechanotransduction in response to extracellular fluid viscosity.
a, Representative western blot of SC and shNHE1 cells. Image is representative of 3 independent protein isolations. b, Normalized changes in pHrodo fluorescence in response to EIPA in shControl and shNHE1 cells. EIPA causes acidification in SC cells (increased pHrodo fluorescence) but not in shNHE1 cells, consistent with an already reduced proton extrusion capacity of the shNHE1 cells. Data are mean ± s.e.m. for n≥3 cells from 3 experiments. c, Intracellular pH values (mean ± s.e.m.) measured in cells loaded with pHrodo and calibrated using solutions with different pH, verifying diminished proton extrusion in shNHE1 cells. Data represent n≥5 cells from 3 experiments. d, Cell volume of Lifeact-GFP-tagged SC and shNHE1 cells on 2D at 0.77 cP and 8 cP from n≥48 cells from 5 experiments. e, Spatial distribution of focal adhesions as an input to the two-phase model. At 8 cP, the distribution is higher at the leading than the trailing edge, as observed experimentally. f, Two-phase model predictions on the spatial distribution of F-actin. The total F-actin redistributes at 8 cP with higher network density at the cell leading edge. g, (Left) Representative western blot of SC and two distinct shRNA sequences (sh1 and sh2) against NHE1. Image is representative of 3 independent protein isolations. (Right) Confined migration speed of cells expressing SC, sh(1) or sh(2)NHE1 at the prescribed viscosities. Data are mean ± s.d. for n≥85 cells from 2 experiments. h, Confined migration speed of SUM159 and BrM2 cells following vehicle or EIPA treatment at prescribed viscosities. Data are mean ± s.d. for n≥98 cells from 2 experiments. i, (Left) Relative AQP5 mRNA levels in SC and shAQP5 cells. Data are normalized to the levels of SC cells. Data are mean ± s.d. from 3 experiments. (Right) Confined migration speeds of SC and shAQP5 cells at prescribed extracellular viscosities. Data are mean ± s.d. for n≥89 cells from 2 independent experiments. j, Quantification of membrane tension in wild-type cells in response to isotonic (1X) or hypotonic (2X) media at 0.77 cP. Data are mean ± s.d. for n≥35 cells from 2 experiments. k, GCaMP6s activity after exposure to 0.77 or 8 cP. l,m, Confined migration speeds at prescribed viscosities in response to chelation of extracellular calcium via BAPTA (l) or the cell permeant calcium chelator BAPTA-AM (m). n,o, Confined migration speeds of SC and shPiezo1 (n) or shPiezo2 (o) brain metastatic MDA-MB-231 cells (BrM2) at prescribed viscosities. p,q, Confined migration speeds of control and TRPM7-KO cells (p) or wild-type cells under 2-APB or vehicle control treatment (q) at 0.77 and 8 cP. Data in l-q are mean ± s.d. for n≥60 cells from 2 experiments. Tests performed: unpaired t-test (c,j), one-way ANOVA followed by Tukey’s multiple comparisons (d) and after log transformation of data (i,lo,q), Kruskal-Wallis followed by Dunn’s multiple comparison (g,h,p). For gel source data, see Supplementary Fig. 1. Cell model: MDA-MB-231 unless otherwise indicated. Source data
Extended Data Fig. 6
Extended Data Fig. 6. The role of TRPV4 in cell mechanotransduction in response to extracellular fluid viscosity.
a, (Left) Representative western blot of SC and shTRPV4 cells using two shRNA sequences. Image is representative of 2 independent biological replicas. (Right) Relative TRPV4 mRNA levels of SC and shTRPV4 cells. Data are normalized to the levels of SC cells, and represent the mean ± range from 2 experiments. b, Representative whole-cell TRPV4 current traces in SC (left) and shTRPV4 (right) cells exposed to 0.77 cP (pink) or 8 cP in the absence (blue) or presence (grey) of the TRPV4 inhibitor HC-067047 (HC). c, GCaMP6s activity in SC, shTRPV4 or shNHE1 cells at 0.77 or 8 cP. d,e, Confined migration speeds of SC and shTRPV4 (sequence 1) cells (d), or wild-type cells under GSK 2193874 (GSK2) or vehicle control treatment (e) at prescribed extracellular viscosities. Data are mean ± s.d. for n≥140 cells from 3 experiments. f, Effect of TRPV4 inhibition via GSK 2193874 (GSK2) in SUM159, HOS and U87 cells or TRPV4 knockdown (sequence 1) in brain metastatic MDA-MB-231 cells (BrM2) on confined migration speeds at the prescribed viscosities. Data are mean ± s.d. for n≥83 cells from ≥2 experiments. g, Representative whole-cell TRPV4 current traces in SC (left) and shNHE1 (right) cells exposed to 0.77 cP (pink) or 8 cP in the absence (blue) or presence (grey) of the TRPV4 inhibitor HC-067047 (HC). h, GCaMP6s activity in SC or shRNA β1-integrin (shITGB1) cells at the prescribed viscosities. Data are mean ± s.d. for n≥32 cells from 2 experiments. Tests performed: one-way ANOVA followed by Tukey’s multiple comparisons (f (only HOS)) and after log transformation of data (d,e), Kruskal-Wallis followed by Dunn’s multiple comparison (f (except HOS), h). For gel source data, see Supplementary Fig. 1. Cell model: MDA-MB-231 unless otherwise indicated. Source data
Extended Data Fig. 7
Extended Data Fig. 7. The roles of TRPV4 and ezrin in cell migration and calcium influx at elevated viscosities under isotonic and hypotonic conditions.
a, b, Confined migration speeds of SC and shNHE1 cells at 8 cP in the presence of vehicle control or indicated doses of the TRPV4 agonist GSK1016790A (GSK1). c, GCaMP6s activity in SC and shNHE1 cells on 2D at 0.77 cP in the presence of vehicle control or indicated doses of the TRPV4 agonist GSK1016790A (GSK1). d, The effect of the TRPV4 antagonist GSK 2193874 (GSK2) on the confined migration speeds of SC and shNHE1 cells at 8 cP. Data in (ad) are mean ± s.d. for n≥32 cells from 3 experiments. e, Cell volume of Lifeact-GFP-expressing SC or shTRPV4 cells on 2D at 0.77 cP and 8 cP in the presence of vehicle control or EIPA. Data are mean ± s.d. for n≥32 cells from 2 independent experiments. f, Time-dependent volumes of Lifeact-GFP-tagged cells at 0.77 cP after addition of 2X hypotonic medium, which occurred between t = −5 min and t = 0 min. Data represent individual cells (grey) or the population average (red) at each time point. Volume of each cell is normalized to its corresponding value just before addition of hypotonic medium. Data were obtained from n = 12 cells from 2 experiments. g,h, GCaMP6s activity in wild-type cells (g) or SC and shTRPV4 cells (h) on 2D at 0.77 cP in response to isotonic (1X) or hypotonic (2X) media. Data are mean ± s.d. for n≥38 cells from 3 experiments. i, Cell volume of Lifeact-GFP-expressing SC or dual ARP3/ARPC4 knockdown cells on 2D at 0.77 cP and 8 cP. Data are mean ± s.d. for n≥29 cells from 2 experiments. j, STORM reconstruction and density quantification of F-actin for n≥15 cells on substrates from 2 experiments. Scale bar: 2 µm. k, GCaMP6s activity in wild-type cells at 8 cP under ezrin inhibitor NSC668394 (NSC6) or vehicle control treatment. Data are mean ± s.d. for n≥50 cells from 3 experiments. l, m, The effect of ezrin inhibitor NSC668394 (NSC6) on confined migration speeds of wild-type cells (l) or SC and shNHE1 cells (m) at 8 cP. Data are mean ± s.d. for n≥107 cells from 2 (l) or 3 (m) experiments. Tests performed: Kruskal-Wallis followed by Dunn’s multiple comparisons (a,b,c (for the 4 groups left of the dashed line), d,e,h,i,m), Mann Whitney (c (pair to the right of the dashed line), g,k), unpaired t-test (j), and one-way ANOVA followed by Tukey’s multiple comparisons on log transformed data (l). Cell model: MDA-MB-231. Source data
Extended Data Fig. 8
Extended Data Fig. 8. The effects of extracellular fluid viscosity on RHOA activity, and its contribution to myosin II-, ARP2/3- and TRPV4-regulated actin dynamics.
a-c, Lifetimes (a) or epi-fluorescent FRET ratios (b,c) of the RHOA activity biosensor in cells on 2D in serum-free (a,b) or serum-containing (10% FBS; a-c) media at the indicated viscosities. Data are mean ± s.d. for n≥16 cells from ≥2 experiments. d, Segmentation strategy of cells on 2D for confocal FLIM-FRET analysis. The entire cell without the nucleus is defined as “whole”, while the “lamella” at cell edge is identified from DIC images. The “body” of the cell comprises of the remainder of the cell without the lamella and the nucleus. Scale bars: 20 µm. e, f, RHOA activity in wild-type cells in the presence of vehicle control or BAPTA (e) or in SC and shNHE1 cells (f) on 2D at prescribed viscosities. Data are mean ± s.d. for n≥27 cells from 3 experiments. g, RHOA lifetimes in confined MDA-MB-231 cells. Yellow arrowheads indicate regions of high activity. h, Spatial distribution of RHOA activity in different segments of confined MDA-MB-231 cells (n≥38) from 5 experiments. Data are mean ± s.d. i, Confocal images of cells inside confining channels immunostained for pMLC with intensity shown as a heatmap. Scale bar: 5 µm. j, Line-scan of pMLC intensity along normalized length of each cell migrating in confinement. Intensity is normalized to the lowest intensity along the scan. Data are moving average ± s.e.m. of n = 14 or 16 cells at 0.77 or 8 cP, respectively, pooled from 2 experiments. k, Confined migration speeds at prescribed viscosities in the presence of vehicle control, blebbistatin or Y27632. Data are mean ± s.d. for n≥139 cells from ≥3 experiments. l, Relative MIIA, MIIB and MIIC mRNA levels in wild-type cells. Data are normalized to the average levels of MIIA, and represent the mean ± s.d. from 3 experiments. m,n, Leading-edge lamella growth of Lifeact-GFP-tagged cells following dual MIIA/MIIB knockdown (m) or Y27632 treatment (n) on 2D relative to appropriate controls. Data are moving averages ± s.e.m. at each time point of n≥20 cells per condition from 3 experiments. *P < 0.05 for t ≥ 45 s between 0.77 versus 8 cP for SC (m) or vehicle control (n) samples. P > 0.05 for all time points between 0.77 and 8 cP for SC versus dual shMIIA/MIIB (m) and vehicle versus Y27632 (n). o,p, (Left) Confocal images showing the spatial localization of MIIA-GFP in cells migrating on 2D at 0.77 and 8 cP (o) or 8 cP only in the presence of vehicle control or Y27632 (p). (Right) Intensity profile along dashed red line in corresponding images. Intensity was normalized to the highest intensity along the scan. Scale bars: 10 µm. qt, Retrograde actin flow rate (q) and uninterrupted protrusion growth rate (s) in wild-type cells expressing β-actin-mRFP-PAGFP on 2D at 8 cP in the presence of vehicle control, Y27632, GSK 2193874 (GSK2) or CK666. Similar measurements were made for SC and shMIIA cells (r,t). Data are mean ± s.d. for n≥21 cells from ≥2 experiments. Tests performed: Mann Whitney test (a,b,r), unpaired t-test (c) and after log transformation (t), Kruskal-Wallis followed by Dunn’s multiple comparisons (e,k,q,s), one-way ANOVA followed by Tukey’s multiple comparisons (f), one-way ANOVA followed by Tukey’s between segments in each group (h), and two-way ANOVA followed by Tukey’s multiple comparisons (m,n). Images in i,o,p are representative of 2 and in g of 5 biological replicas. Cell model: MDA-MB-231. Source data
Extended Data Fig. 9
Extended Data Fig. 9. The role of β1-integrin in cell phenotype and migration at elevated viscosities as well as the effects of LatA on the spatial distribution of NHE1 and ezrin.
a, Representative western blot image of SC and shITGB1 (β1-integrin) cells (left) and their quantification (right) from 3 independent biological replicas. For gel source data, see Supplementary Fig. 1. b, Percentage of SC and shITGB1 cells migrating with blebbing versus protrusive phenotypes at 0.77 cP and 8 cP. Data are mean ± s.e.m. for n≥20 cells per experiment from 3 independent experiments. c, Confined migration speeds of SC and shITGB1 cells at prescribed extracellular viscosities. Data are mean ± s.d. for n≥89 cells from 3 experiments. d, e, Front to rear NHE1 (d) or ezrin (e) intensity ratio in confined cells migrating at 8 cP in the presence of vehicle control or LatA (2 µM). Data are mean ± s.d. for n≥25 cells from 2 experiments. f, Rate of pH recovery after intracellular acidosis due to NH4Cl pulse treatment of cells expressing pHRed. Data are mean ± s.d. from n≥19 cells in each condition pooled from 3 experiments. g, Confined migration velocity of wild-type or NHE1-GFP-overexpressing (NHE1+) MDA-MB-231 cells (n≥35) at 8 cP in the presence of vehicle control or Lat A from ≥3 experiments. The y axis is discontinued from 17–25 µm/h to highlight differences in velocity. Data are mean ± s.d. Tests performed: two-way ANOVA followed by Tukey’s multiple comparisons (b), Kruskal-Wallis followed by Dunn’s (c,g), unpaired t-test on log transformed data (d,e), and one-way ANOVA followed by Tukey’s (f). Cell model: MDA-MB-231. Source data
Extended Data Fig. 10
Extended Data Fig. 10. The effect of pre-conditioning at different viscosities on cell migration in vitro and in vivo.
a, Confined migration speeds of cells, pre-treated at 0.77 cP or 2 cP for 6 days, and resuspended in the prescribed “migration” viscosity in which motility was tracked. Data are mean ± s.d. for n = 131 cells from 3 experiments. b, Persistence values of cells moving through zebrafish ISVs. Red lines indicate median (thick) and quartiles (thin). c, Histogram of average cell speeds through zebrafish ISVs. Values were calculated for n = 77 and n = 81 cells pre-treated at 0.77 cP and 8 cP, respectively, from 3 experiments. d, Average speeds on a per larvae basis of cells moving through zebrafish ISVs. Values were calculated across 14 or 13 larvae injected with cells pre-conditioned at 0.77 or 8 cP, respectively, pooled from 3 experiments. Red lines indicate median (thick) and quartiles (thin). e, (Left) Representative maximum intensity projections of confocal images showing CAM vasculature with extravasating cells. Cells were cultured for 6 days either at 0.77 or 3 cP, re-suspended in ice-cold PBS, and injected into the CAM vasculature. Red arrows indicate extravasated cells. Scale bar: 50 μm. (Right) Quantification of cell extravasation. Red lines indicate median (thick) and quartiles (thin) for ≥16 animals from 3 experiments. f, Confocal images of mouse lung sections 48 h post-injection showing human vimentin-positive metastatic colonies (red arrows). Scale bars: 100 µm. Tests performed: Kruskal-Wallis followed by Dunn’s multiple comparisons (a), Mann Whitney (b), unpaired t-test (e), and unpaired t-test with Welch’s correction (d). Images are representative of 3 (e) or 2 (f) independent biological replicas. Cell model: MDA-MB-231. Source data
Extended Data Fig. 11
Extended Data Fig. 11. TRPV4 mediates mechanical response to fluid viscosity via transcriptional control of the Hippo pathway.
a, PCA plot of SC cells exposed to 0.77 cP (SC-0.77cP) or 8 cP (SC-8cP) and shTRPV4 cells subjected to 8 cP (shTRPV4-8cP) from 3 independent biological replicates. b, Volcano plots displaying DEGs with P≤0.05 in SC cells at 0.77 versus 8 cP, and between SC and shTRPV4 cells at 8 cP. Downregulated genes are in blue and upregulated in red. c, Ingenuity pathway analyses of paired samples shown in (b). Top 5 commonly upregulated and downregulated pathways are shown. d, Heatmap showing the relative expression levels of Hippo pathway genes identified in (c). e, (Left) Confocal images of cells on collagen-I-coated glass bottom dishes after 4 h of exposure to medium of prescribed viscosities and immunostained for YAP1 and Hoechst. Scale bars: 20 µm. (Right) Quantification of nuclear-to-cytosolic YAP1 ratio. Data are mean ± s.d. for n≥46 cells from 2 experiments. f, Confined migration speeds of cells, pre-conditioned at 0.77 or 8 cP in the presence of verteporfin or vehicle control for 6 days, and resuspended in the indicated “migration” viscosity without verteporfin in which their motility was tracked. Data are mean ± s.d. for n≥107 cells from 2 experiments. Tests performed: Mann Whitney (e) and Kruskal-Wallis followed by Dunn’s multiple comparisons (f). Images are representative of 2 independent biological replicas (e). Cell model: MDA-MB-231. Source data

Comment in

  • The memory of viscosity.
    Strzyz P. Strzyz P. Nat Rev Mol Cell Biol. 2023 Jan;24(1):3. doi: 10.1038/s41580-022-00563-x. Nat Rev Mol Cell Biol. 2023. PMID: 36380159 No abstract available.

References

    1. Discher DE, Janmey P, Wang YL. Tissue cells feel and respond to the stiffness of their substrate. Science. 2005;310:1139–1143. - PubMed
    1. Yankaskas CL, et al. The fluid shear stress sensor TRPM7 regulates tumor cell intravasation. Sci. Adv. 2021;7:eabh3457. - PMC - PubMed
    1. Zhao R, et al. Cell sensing and decision-making in confinement: The role of TRPM7 in a tug of war between hydraulic pressure and cross-sectional area. Sci. Adv. 2019;5:eaaw7243. - PMC - PubMed
    1. Renkawitz J, et al. Nuclear positioning facilitates amoeboid migration along the path of least resistance. Nature. 2019;568:546–550. - PMC - PubMed
    1. Park S, Jung WH, Pittman M, Chen J, Chen Y. The effects of stiffness, fluid viscosity, and geometry of microenvironment in homeostasis, aging, and diseases: a brief review. J. Biomech. Eng. 2020;142:100804. - PMC - PubMed

Publication types

MeSH terms