. 2022 Nov;611(7936):532-539.
doi: 10.1038/s41586-022-05377-7. Epub 2022 Nov 2.

Broad transcriptomic dysregulation occurs across the cerebral cortex in ASD

Affiliations

Broad transcriptomic dysregulation occurs across the cerebral cortex in ASD

Michael J Gandal et al. Nature. 2022 Nov.

Abstract

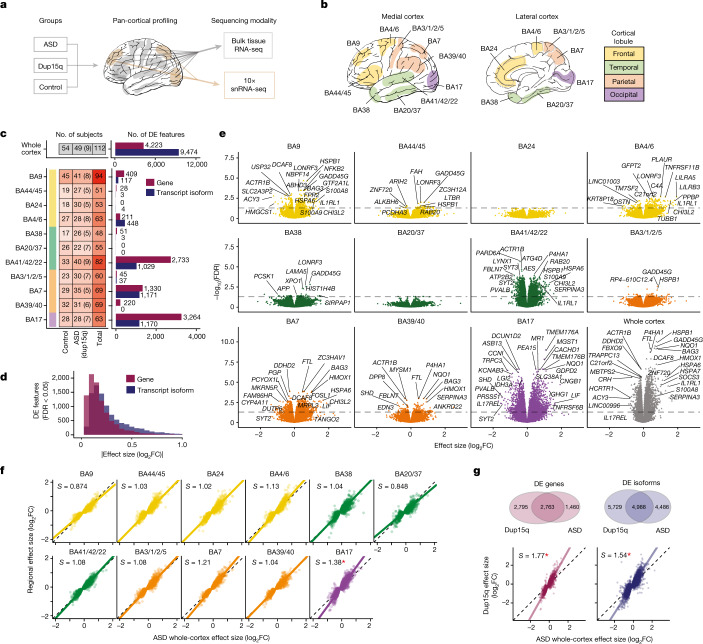
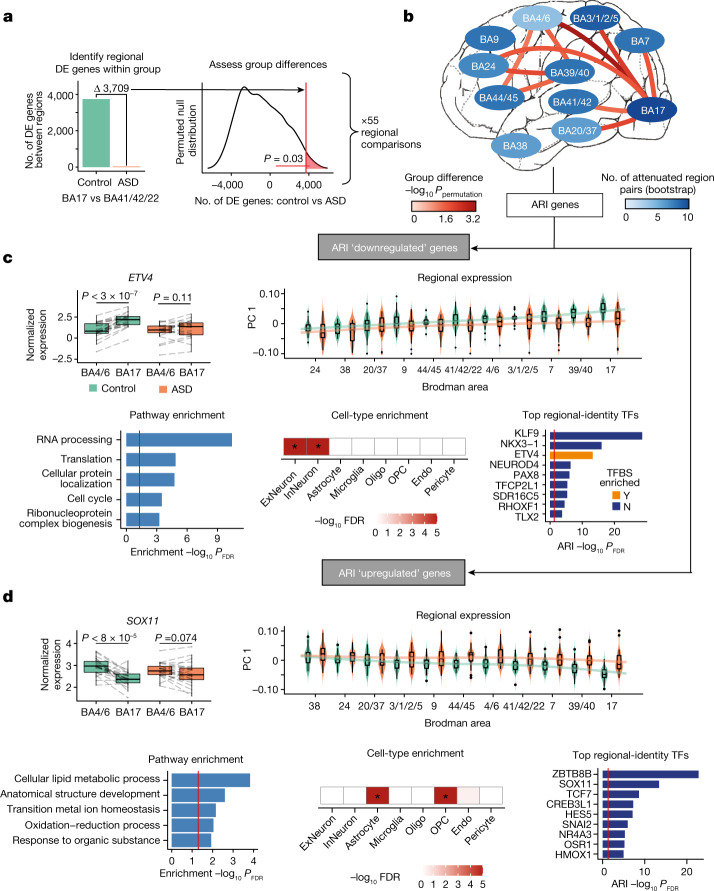
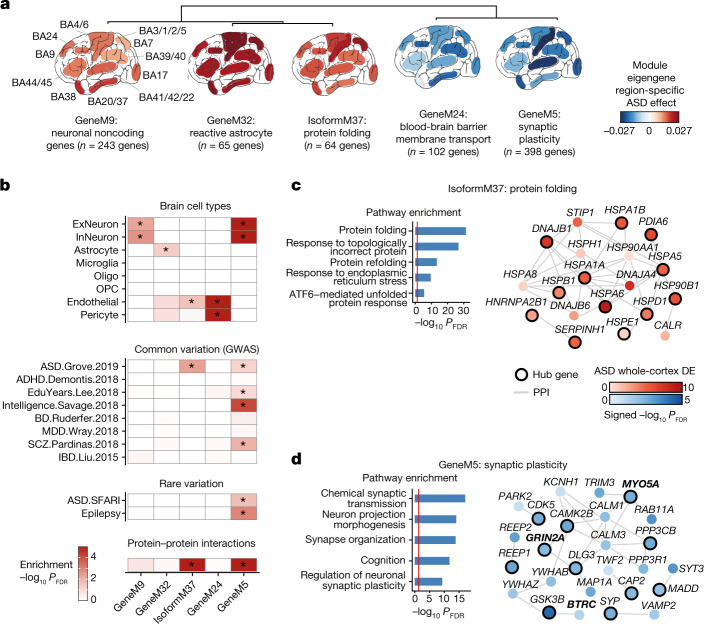
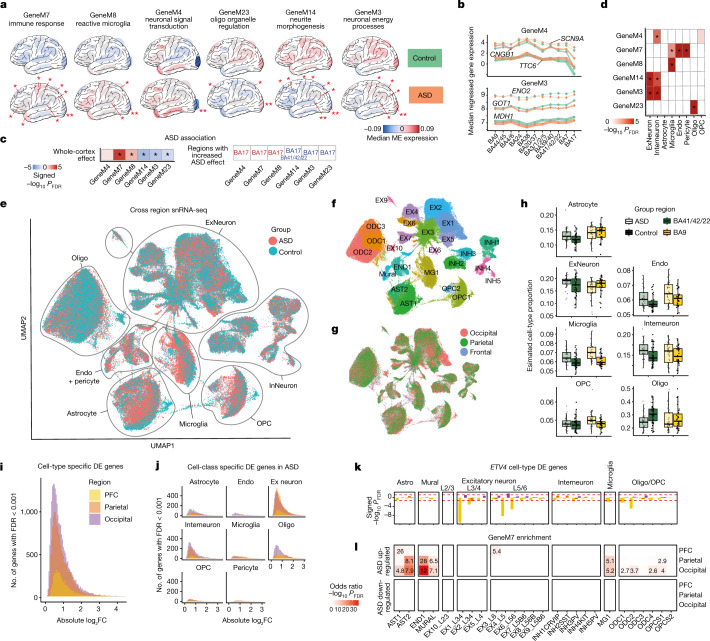
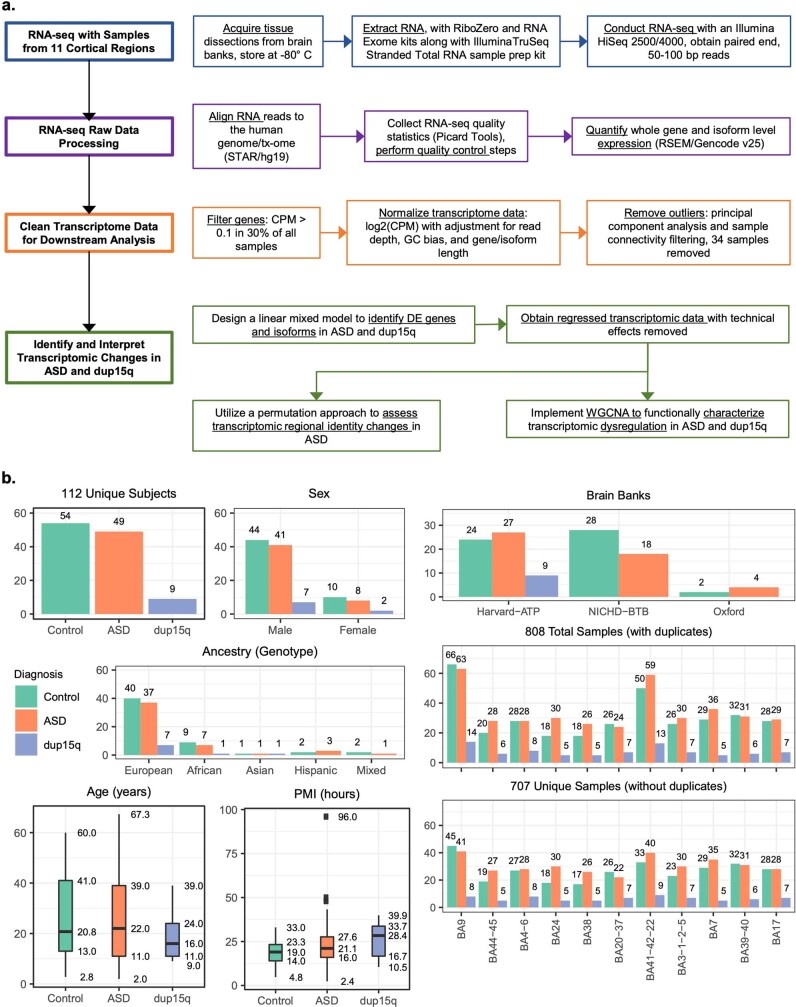
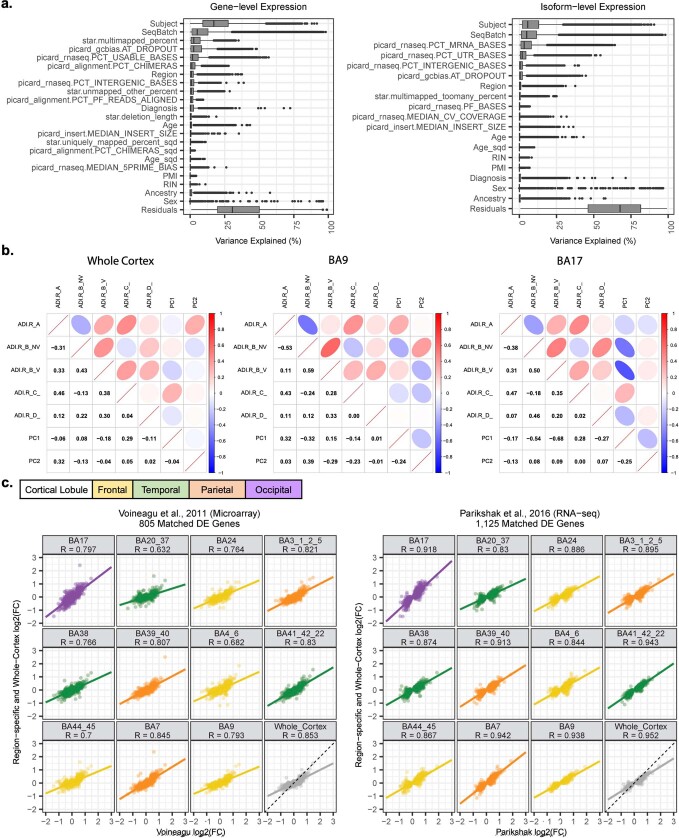
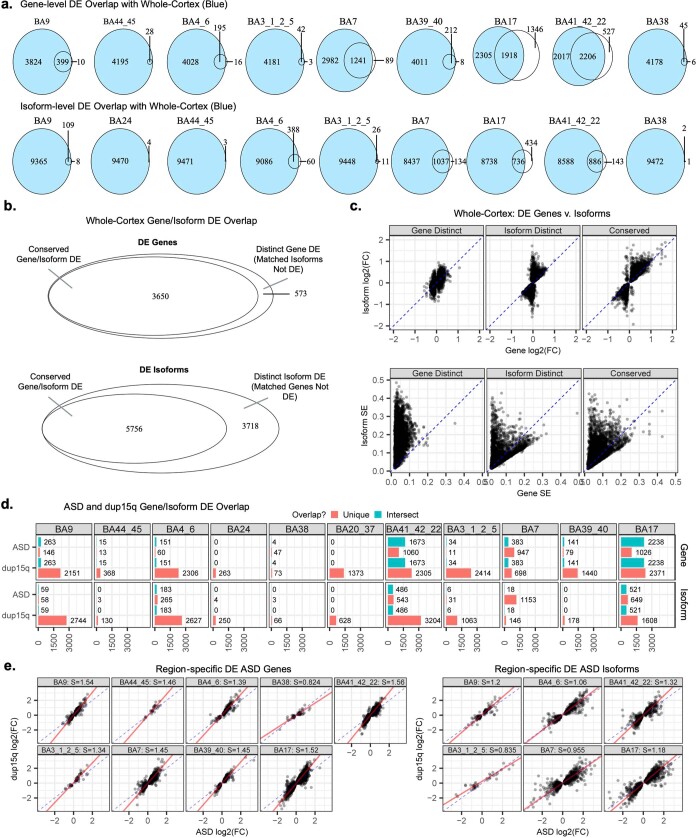
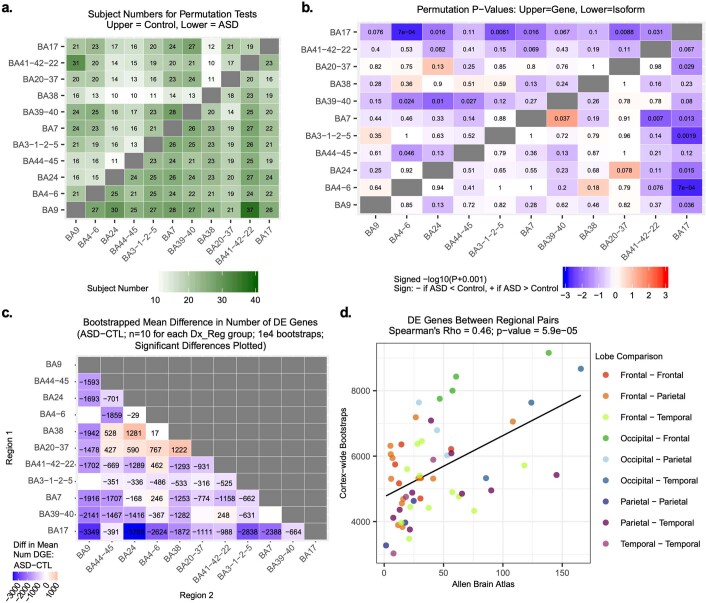
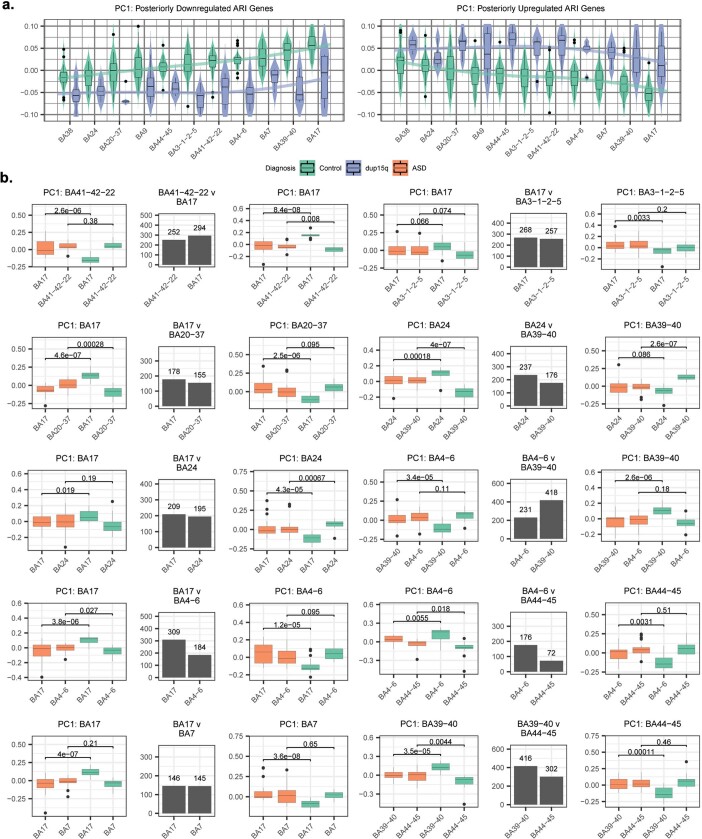
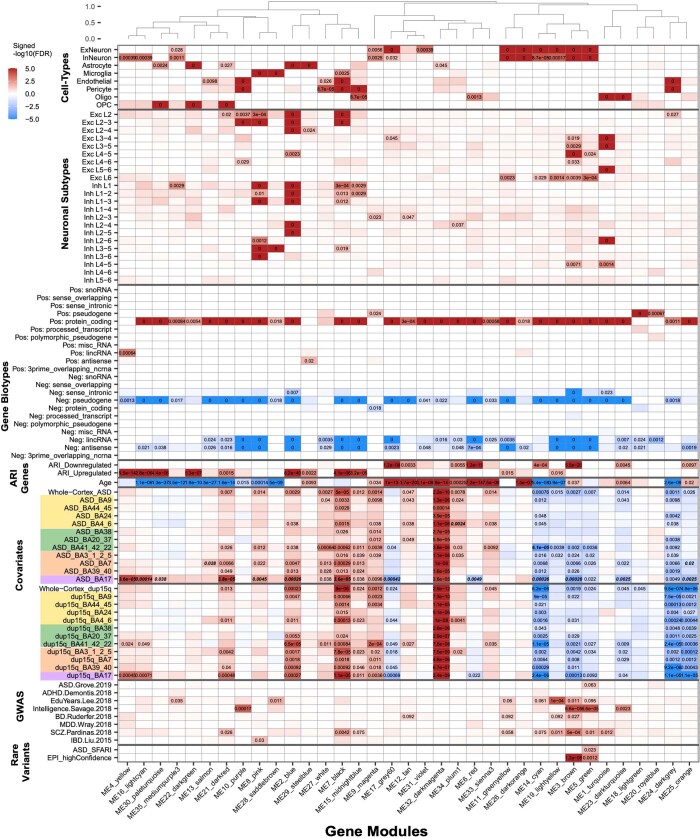
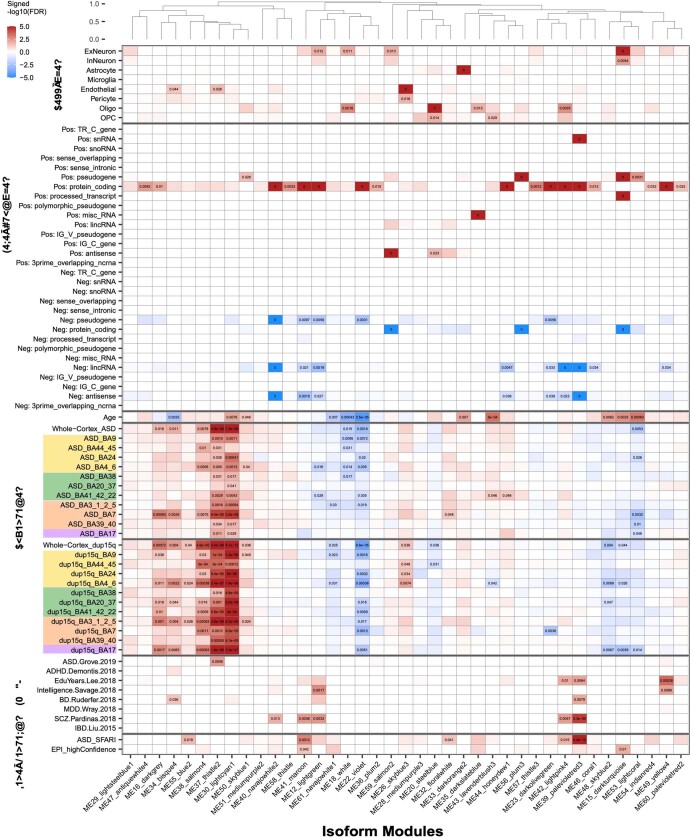
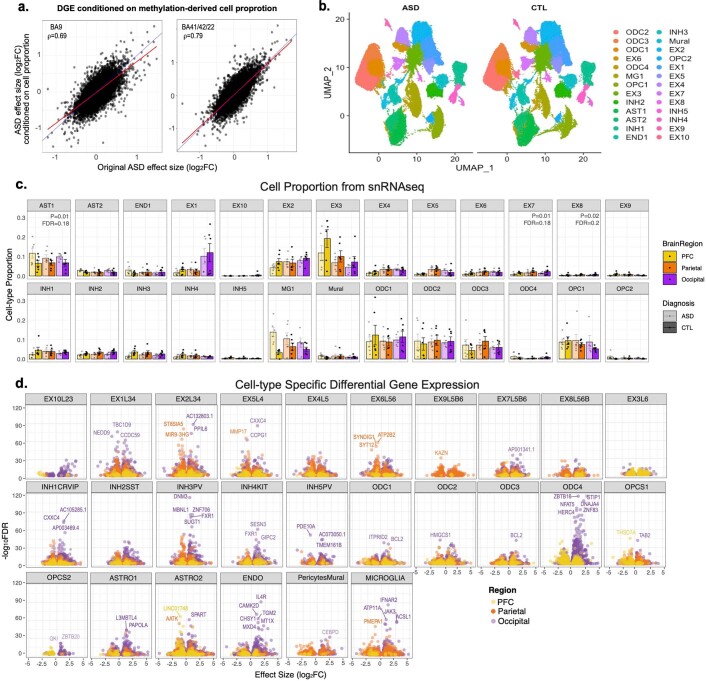
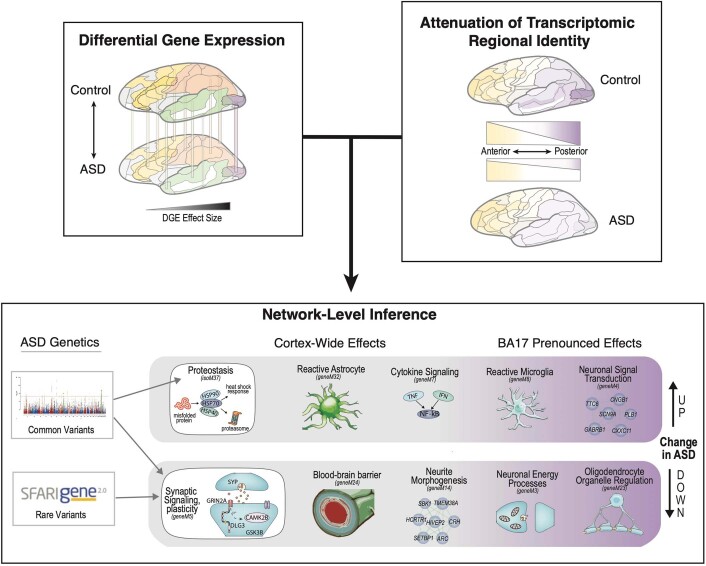
Neuropsychiatric disorders classically lack defining brain pathologies, but recent work has demonstrated dysregulation at the molecular level, characterized by transcriptomic and epigenetic alterations1-3. In autism spectrum disorder (ASD), this molecular pathology involves the upregulation of microglial, astrocyte and neural-immune genes, the downregulation of synaptic genes, and attenuation of gene-expression gradients in cortex1,2,4-6. However, whether these changes are limited to cortical association regions or are more widespread remains unknown. To address this issue, we performed RNA-sequencing analysis of 725 brain samples spanning 11 cortical areas from 112 post-mortem samples from individuals with ASD and neurotypical controls. We find widespread transcriptomic changes across the cortex in ASD, exhibiting an anterior-to-posterior gradient, with the greatest differences in primary visual cortex, coincident with an attenuation of the typical transcriptomic differences between cortical regions. Single-nucleus RNA-sequencing and methylation profiling demonstrate that this robust molecular signature reflects changes in cell-type-specific gene expression, particularly affecting excitatory neurons and glia. Both rare and common ASD-associated genetic variation converge within a downregulated co-expression module involving synaptic signalling, and common variation alone is enriched within a module of upregulated protein chaperone genes. These results highlight widespread molecular changes across the cerebral cortex in ASD, extending beyond association cortex to broadly involve primary sensory regions.


Conflict of interest statement

The authors declare no competing interests.

Figures

Fig. 1
Fig. 1. ASD-associated transcriptomic differences across 11 cortical regions.
a, Study experimental design. Eleven regions were profiled by bulk RNA-seq, and three regions were also profiled by single-nucleus RNA sequencing (snRNA-seq) (Fig. 4). b, Human cortical Brodmann areas (BA) sequenced, with cortical lobules coloured consistently throughout this figure. c, The number of unique individuals by region and diagnosis (left), with the number of additional individuals with dup15q syndrome included in parentheses. Right, the number of differentially expressed (DE) (linear mixed model FDR < 0.05) features (genes and transcript isoforms) across the whole cortex (top) or within individual regions (below). d, Absolute value of effect-size changes are shown for differentially expressed genes and isoforms for whole-cortex analyses. Larger effect-size changes are observed at the transcript isoform level. e, Volcano plots show the top differentially expressed genes within regions and across the whole cortex. f, Differential expression effect size (log2FC) of individual regions compared with whole-cortex changes for the 4,223 cortex-wide differentially expressed genes. Slope (S) is calculated using principal components regression, with *P < 0.05 for S significantly different from unity by bootstrap (Methods). g, Top, Venn diagrams depicting the number of genes and isoforms that were differentially expressed across the whole cortex in dup15q samples compared with idiopathic ASD. Bottom, idiopathic ASD whole-cortex log2FC compared to the dup15q whole-cortex log2FC for the ASD whole-cortex differentially expressed genes (left) and isoforms (right). Slope is calculated using principal components regression.
Fig. 2
Fig. 2. Cortex-wide transcriptomic regional-identity attenuation in ASD.
a, Overview of methods for identifying statistically significant differences in transcriptomic regional identity in ASD. The regional comparison of BA17 versus BA41/42/22 is used here as an example. Left, the number of differentially expressed genes between regions is calculated in controls and ASD samples. Right, a permuted null distribution is then used to determine the significance of the difference in differentially expressed genes between controls and ASD samples. b, Regional comparisons of ARI in ASD, with those comparisons reaching a permutation P < 0.05 connected with a line (red scale). Cortex-wide attenuation identified with a bootstrap approach (Methods) is summarized by region colour (blue scale; 0, no pairs exhibiting attenuation in ASD; 10, all pairs exhibit attenuation in ASD). For region colour, a regional pair is considered attenuated if it contains less differential expression in ASD compared with controls. ARI genes are extracted from regional comparisons with permutation P < 0.05 (Methods). c,d, Overview of downregulated (c) and upregulated (d) ARI genes. Top left, attenuated transcription factors (TFs) in BA17 and BA4/6. Lines link paired samples from the same individual, and the paired Wilcoxon signed-rank test P-value is plotted above the box plots. Top right, principal component 1 (PC 1) of ARI genes across all regions; regions are ordered by the control median. Bottom left and bottom centre, gene ontology and cell-type enrichment (*FDR < 0.05), respectively. Bottom right, top 10 attenuated transcription factors; FDR is representative of how well these transcription factors distinguish BA17 and BA39/40 from the remaining nine other cortical regions in controls (Methods). Enrichment for transcription factor binding sites is also depicted (Bonferroni-corrected P-value < 0.05 is required for enrichment). ExNeuron, excitatory neuron; InNeuron, inhibitory neuron; oligo, oligodendrocyte; OPC, oligodendrocyte precursor cell; endo, endothelial cell.
Fig. 3
Fig. 3. Co-expression network analysis characterizes cortex-wide dysregulation of ASD risk genes.
a, Hierarchical clustering of the top 5 most dysregulated gene and isoform co-expression module eigengenes (first principal component of the module) with regionally consistent patterns of ASD dysregulation. The module eigengene ASD effect is indicated for each cortical region examined (Methods). n indicates the number of genes or isoforms in each module. b, −log10(FDR) for cell-type, genome-wide association study (GWAS), rare-variant and protein–protein interaction enrichment for the modules depicted in a. GWAS references (left margin): ASD.Grove.2019, ref. ;ADHD.Demontis.2018, ref. ; EduYears.Lee.2018, ref. ; Intelligence.Savage.2018, ref. ; BD.Ruderfer.2018, ref. ; MDD.Wray.2018, ref. ; SCZ.Pardinas.2018, ref. ; IBD.Liu.2015, ref. . *Significant enrichment (FDR < 0.05 for cell-type, rare-variant and protein–protein interaction enrichment, and FDR < 0.1 for GWAS enrichment). c,d, For ASD GWAS-enriched modules, IsoformM37 (c) and GeneM5 (d), top gene ontology terms (left) and hub genes (module genes within the top 20 genes with the highest correlation with the module’s eigengene) whose gene products participate in a protein–protein interaction with those of any other module gene are depicted along with their PPI partners (right). Node colour is the signed –log10(FDR) of the whole-cortex ASD effect, edges denote direct PPIs, and hub genes are indicated with a black outline. SFARI database gene symbols are in bold.
Fig. 4
Fig. 4. Functional characterization of regionally variable transcriptomic dysregulation in ASD.
a, The top 6 most dysregulated modules with regionally variable patterns of dysregulation. The median of the module eigengene (ME), stratified by diagnosis, is depicted for each cortical region examined. *Significant region-specific dysregulation in ASD; **regions with a significantly increased magnitude of effect compared to the whole-cortex effect (Methods). b, Median regressed gene expression for the top three hub genes for GeneM4 (top) and GeneM3 (bottom). c, The whole-cortex ASD effect for modules depicted in a (*FDR < 0.05). Bottom, regions with a significantly increased magnitude of effect compared to the whole-cortex effect in a are listed. d, Cell-type enrichment for regionally variable modules. e, Uniform manifold approximation and projection for dimension reduction (UMAP) plots of snRNA-seq data from around 250,000 cells containing matched ASD and neurotypical control samples across frontal, parietal and occipital cortices, coloured by diagnosis. f,g, UMAP plots coloured by specific cell type (f) and cortical region of origin (g). h, Broad neural cell-type proportions deconvolved from matching bulk methylation array data. No FDR-significant cell proportion shifts were observed in ASD. i, Region-specific effect-size changes for cell-type-specific differentially expressed genes (FDR < 0.001), with BA17 again showing the greatest transcriptomic changes. j, Differentially expressed genes are shown for broad cell classes. k, ETV4 shows posterior-predominant downregulation across multiple cell types in ASD. l, The immune module GeneM7 shows posterior-predominant enrichment among cell-type-specific differentially expressed genes in ASD.
Extended Data Fig. 1
Extended Data Fig. 1. Experiment Workflow and Sample Overview.
a. Overview of experiment workflow. b. Summary of sample composition (biological data, brain bank source, and PMI).
Extended Data Fig. 2
Extended Data Fig. 2. Quality Control Measures.
a. Sequencing batches. b. Brain region and case-control sample sizes across batches. c. Top 15 expression PCs (gene and transcript, with % of variance explained denoted) association with meta data (top) and sequencing statistics (bottom). d. Boxplots show median and interquartile range (25th/75th percentile; bounds of box) +/− 1.5 times the interquartile range (whiskers) for RIN values and sequencing statistics across diagnoses x regions, with the number of biologically independently samples per region and diagnosis as indicated in Fig. 1.
Extended Data Fig. 3
Extended Data Fig. 3. Model Covariates, ADI-R Correlations, and Previous Studies Across 11 Cortical Regions.
a. For the covariates selected for the gene (left) and transcript (right) linear mixed models, % of expression variance explained across all genes/transcripts. Boxplots show median and interquartile range (25th/75th percentile; bounds of box) +/− 1.5 times the interquartile range (whiskers) for 24,836 and 99,819 distinct genes and isoforms, respectively, measured across 725 brain samples from 112 unique subjects. b. Spearman correlations for available ADI-R scores with the first and second principal components of ASD differentially expressed genes, calculated across all regions (whole cortex), BA9, and BA17. c. For the Voineagu et al. and Parikshak et al. studies,, the ASD log2FC of differentially expressed genes identified in these studies, compared to this dataset (Spearman’s correlation rho, R, is plotted along with the linear least squares regression best fit line).
Extended Data Fig. 4
Extended Data Fig. 4. Transcriptomic Changes Across 11 Cortical Regions.
a. Overlap of Whole-Cortex differentially expressed ASD genes and transcripts (blue) with other cortical region differentially expressed genes (no colour). Regions with no third numeric label on the right completely overlap with the Whole-Cortex differentially expressed genes. b. For the Whole-Cortex differential expression, overlap of genes and transcripts. Regions not shown have no unique differential expression. c. log2FC (top) and standard error (SE, bottom) of the Whole-Cortex ASD differential expression overlapping and distinct genes and transcripts. d. Overlap in differential expression for ASD and dup15q genes and transcripts. e. For regions with differentially expressed ASD genes (left) and transcripts (right), ASD log2FC v. dup15q log2FC for specific regions (with principal components regression slope, S).
Extended Data Fig. 5
Extended Data Fig. 5. Transcriptomic Regional Identity Attenuation in ASD.
a. Sample size for all regional comparisons. b. Nominal permutation derived p-values (two-sided) for all regional comparisons (See Methods). c. Bootstrapped (10,000 bootstraps) mean difference in the number of differentially expressed genes between regions, ASD – CTL (control). Wilcoxon rank-sum test results with FDR < 0.05 are indicated. Negative/blue values = less differentially expressed genes between regions in ASD compared to controls, positive/red = more differentially expressed genes between regions in ASD compared to controls. d. Spearman’s correlation between number of differentially expressed genes between pairs of regions in this study (mean across bootstraps in controls, y-axis) compared to the Allen Brain Atlas (ref. , mean across matched regions, x-axis; see Methods for matched regions). The Spearman correlation P value (two sided) was calculated using algorithm AS 89.
Extended Data Fig. 6
Extended Data Fig. 6. Additional ARI gene dysregulation.
a. First principal component (PC1) of ARI genes identified in ASD exhibiting posteriorly downregulated (n = 1,881 genes, left) or upregulated (n = 1,695 genes, right) patterns of expression. Boxplots show median and interquartile range (25th/75th percentile; bounds of box) +/− 1.5 times the interquartile range (whiskers) for PC1 of these genes for each regional comparison, summarized across controls and dup15q samples (loess regression line plotted). The unique number of subjects per region is indicated in Fig.1. b. For each significantly attenuated regional comparison, the identified attenuated regional identity (ARI) genes. At center, number of ARI genes with greater neurotypical expression in each pair of regions. On either side of the barplot, the PC1 of the genes with greater neurotypical anterior (left) or posterior (right) expression is plotted across the pair of regions in Controls and ASD. The Wilcoxon signed-rank test (unpaired; two-tailed) p-value is shown. Boxplots show median and interquartile range (25th/75th percentile; bounds of box) +/− 1.5 times the interquartile range (whiskers) for PC1 of the genes for each regional comparison, summarized across controls and ASD samples, with the unique number of subjects per group x region comparison indicated in Fig. 1b.
Extended Data Fig. 7
Extended Data Fig. 7. Gene-level Co-Expression Network Analysis Module Associations.
Top: average-linkage hierarchical clustering of module eigengene biweight midcorrelations. Significant FDR corrected p-values (two sided) are indicated (FDR < 0.05; for GWAS, FDR < 0.1). For ASD, dup15q, and age covariates, FDR-corrected p-value (two sided) from the linear mixed model testing the association of these covariates with module eigengenes is depicted. For the ASD and dup15q region-specific comparisons, cortical lobule colours are indicated (Fig. 1), and bold-italic FDR-corrected p-values indicate that these regions are affected with significantly greater magnitude than the ASD whole-cortex (Methods). For gene biotypes, both positive and negative enrichment is shown (Fisher’s exact test; Methods). Positive enrichment is shown for cell-type, neuronal subtype (ref. ), ARI gene, GWAS, and rare variant enrichment (Methods).
Extended Data Fig. 8
Extended Data Fig. 8. Transcript-level Co-Expression Network Analysis Module Associations.
Top: average-linkage hierarchical clustering of module eigengene biweight midcorrelations. Significant FDR corrected p-values (two sided) are indicated (FDR < 0.05; for GWAS, FDR < 0.1). For ASD, dup15q, and age covariates, FDR-corrected p-value from the linear mixed model testing the association of these covariates with module eigengenes is depicted. For the ASD and dup15q region-specific comparisons, cortical lobule colours are indicated (Fig. 1a). For gene biotypes, both positive and negative enrichment is shown (Fisher’s exact test; Methods). Positive enrichment is shown for cell-type, GWAS, and rare variant enrichments (Methods).
Extended Data Fig. 9
Extended Data Fig. 9. Cell-type Composition Associations, snRNA-seq, and Cell-type Deconvolution.
a. ASD bulk RNA-seq log2FC’s (from BA9, left, and BA41-42-22, right) calculated without (x-axis) and with (y-axis) methylation data derived cell-type proportions as covariates (Methods), compared to the original model used for calculating DE genes (Fig. 1). Spearman correlation is shown. b. Split UMAP plots of snRNA-seq from ASD cortex (left) and CTL cortex (right) with cell subtypes coloured. c. Cell-type proportion (mean + standard error) for cell clusters from each region derived directly from the snRNA-seq data (n = 12 biologically independent individuals, 6 per group, sampled across 3 brain regions). Region is coloured and cell-types are indicated in each plot. Nominal and FDR-corrected P values from ANOVA (two sided) are shown for trend-level associations. d. Volcano plots show within cell-type differential expression across regional comparisons. X-axis is ASD effect size (log2FC) and y-axis is the -log10(FDR) from Nebula. Genes with |log2FC| > 0.2 and FDR < 0.001 are labeled.
Extended Data Fig. 10
Extended Data Fig. 10. Results Summary.
Overview of results from this pan-cortical characterization of the ASD transcriptome. Top left, differential gene expression signatures in ASD, while observed cortex-wide, show greatest effect size changes in posterior regions, especially BA17. Top right, a widespread posterior-predominant attenuation in transcriptomic regional identity is observed in ASD. Bottom, co-expression networks provide an organizing framework for interpretation of cortex-wide and regionally variable effects. A cortex-wide, upregulated co-expression module (isoM37) comprised of genes involved in proteostasis is enriched for common ASD-associated genetic variation. A cortex-wide, downregulated module characterized by genes involved in synaptic signaling and plasticity showed enrichment for common and rare genetic risk variants. Other modules exhibiting cortex-wide or regionally pronounced differential expression patterns in ASD are highlighted.

References

    1. Gandal MJ, et al. Transcriptome-wide isoform-level dysregulation in ASD, schizophrenia, and bipolar disorder. Science. 2018;362:eaat8127. - PMC - PubMed
    1. Wu YE, Parikshak NN, Belgard TG, Geschwind DH. Genome-wide, integrative analysis implicates microRNA dysregulation in autism spectrum disorder. Nat. Neurosci. 2016;19:1463–1476. - PMC - PubMed
    1. Sun W, et al. Histone acetylome-wide association study of autism spectrum disorder. Cell. 2016;167:1385–1397.e11. - PubMed
    1. Voineagu I, et al. Transcriptomic analysis of autistic brain reveals convergent molecular pathology. Nature. 2011;474:380–384. - PMC - PubMed
    1. Parikshak NN, et al. Genome-wide changes in lncRNA, splicing, and regional gene expression patterns in autism. Nature. 2016;540:423–427. - PMC - PubMed

Publication types