. 2022 Nov 2;12(1):18521.
doi: 10.1038/s41598-022-23250-5.

Long-term microglia depletion impairs synapse elimination and auditory brainstem function

Affiliations

Long-term microglia depletion impairs synapse elimination and auditory brainstem function

Sima M Chokr et al. Sci Rep. .

Abstract

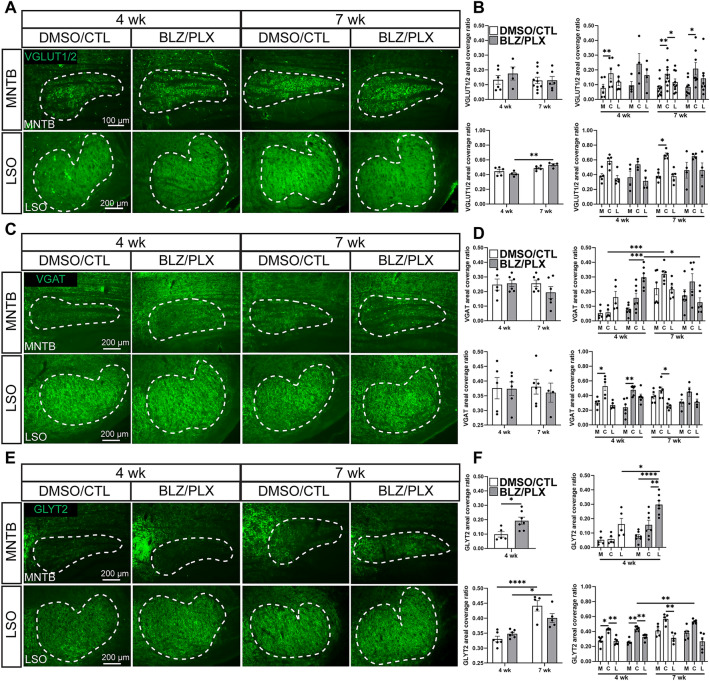
Specialized sound localization circuit development requires synapse strengthening, refinement, and pruning. Many of these functions are carried out by microglia, immune cells that aid in regulating neurogenesis, synaptogenesis, apoptosis, and synaptic removal. We previously showed that postnatal treatment with BLZ945 (BLZ), an inhibitor of colony stimulating factor 1 receptor (CSF1R), eliminates microglia in the brainstem and disables calyceal pruning and maturation of astrocytes in the medial nucleus of the trapezoid body (MNTB). BLZ treatment results in elevated hearing thresholds and delayed signal propagation as measured by auditory brainstem responses (ABR). However, when microglia repopulate the brain following the cessation of BLZ, most of the deficits are repaired. It is unknown whether this recovery is achievable without the return of microglia. Here, we induced sustained microglial elimination with a two-drug approach using BLZ and PLX5622 (PLX). We found that BLZ/PLX treated mice had impaired calyceal pruning, diminished astrocytic GFAP in the lateral, low frequency, region of MNTB, and elevated glycine transporter 2 (GLYT2) levels. BLZ/PLX treated mice had elevated hearing thresholds, diminished peak amplitudes, and altered latencies and inter-peak latencies. These findings suggest that microglia are required to repopulate the brain in order to rectify deficits from their ablation.


Conflict of interest statement

The authors declare no competing interests.

Figures

Figure 1
Figure 1
Long-term microglial depletion with CSF1R inhibitors. (A) Coronal brainstem section from a one-week-old (1 wk) control mouse with Nissl (blue) and microglial marker IBA1 (green) immunolabeling. Microglia are dispersed throughout the brainstem and are abundant by 2 wk. At 3 wk microglia remain distributed throughout the brainstem. (B) Brainstem sections from 1 wk, 2wk, and 3 wk mice treated every other day with BLZ945 (BLZ). At 1 and 2 wk, microglia are depleted. At 3 wk, microglia repopulated the brainstem despite continued BLZ treatment. (C) IBA1 immunolabeled section from a 1 wk mouse that received PLX5622 (PLX) through lactation beginning on P2. At 1 and 2 wk following lactation mediated PLX treatment, microglial are present throughout the brainstem but at lower cell density compared to controls. At 3 wk, pups are weaned and consume the PLX chow directly, resulting in microglial elimination with only a few IBA1 + cells detected. (D) Illustration of a dual drug method which involved subcutaneous BLZ injections and PLX treatment through the nursing dam. Created with BioRender.com. (E)(H) Nissl and IBA1 immunolabeled sections from BLZ/PLX treated mice at 2, 3, 4, and 7 wk, respectively. Microglia were eliminated and did not return within the ages tested.
Figure 2
Figure 2
BLZ/PLX treatment disrupts calyceal elimination. (A) Mono- and polyinnervated MNTB neurons from a control mouse at 4 wk. 3D reconstructed rhodamine dye labeled calyx (magenta) and VGLUT1/2 (green) immunolabeling. (B) Mono- and polyinnervated neuron from a BLZ/PLX treated mouse at 4 wk. (C) Comparison of the percentage of polyinnervated versus monoinnervated cells in each treatment group showed that BLZ/PLX treatment results in more polyinnervated cells. (D) Surface area of the reconstructed calyces did not show a treatment-related difference. (E) Volume of the reconstructed calyces was lower in the BLZ/PLX treated group. *p < 0.05. Scale bar = 5 µm, applies to panels (A), (B).
Figure 3
Figure 3
Effects of BLZ/PLX treatment on astrocytes are limited. (A) Images of Nissl (blue), GFAP (green), and an overlay in DMSO/CTL treated mice at 4 wk. White dashed lines indicate MNTB. (B) Nissl and GFAP immunolabeling in BLZ/PLX at 4 wk. (C) Nissl and GFAP immunolabeling in 7 wk controls. (D) Nissl and GFAP expression in 7 wk BLZ/PLX mice. (E) Comparison of overall GFAP areal coverage ratio and medial, central and lateral GFAP coveragein the MNTB of 4 and 7 wk mice. Overall treatment effects were not detected. BLZ/PLX mice at 4 wk showed less GFAP coverage in lateral and central MNTB, compared to the medial region, while DMSO/CTL mice did not show region specificity. At 7 wk, DMSO/CTL mice had lower GFAP expression levels in lateral compared to medial and central regions. BLZ/PLX did not show a regional difference at 7 wk. (F) Images of Nissl (blue), S100β (green) immunolabeling with an overlay in DMSO/CTL treated mice at 4 wk. (G) Nissl and S100β staining in BLZ/PLX mice at 4 wk. (H) Nissl and S100β immunolabeling in 7 wk DMSO/CTL mice. I) Nissl and S100β immunolabeled sections from BLZ/PLX mice at 7 wk. (J) Comparison of overall and regional S100β areal coverage ratio in the MNTB of 4 and 7 wk mice. Treatment effects were not detected. Both DMSO/CTL and BLZ/PLX treated mice at 4 wk showed higher S100β levels in central MNTB compared to the medial region. At 7 wk, regional differences in the DMSO/CTL group were evident, while the BLZ/PLX group did not show any differences. *p < 0.05. Scalebars = 200 µm, apply to panels (A)(D) and (G)(J).
Figure 4
Figure 4
Inhibitory, but not excitatory, synaptic markers are elevated in microglia-depleted mice. (A) VGLUT1/2 immunolabeling (green) and their overlay in a control or treated mice at 4 and 7 wk. White dashed lines indicate MNTB or LSO. (B) Comparison of overall and regional VGLUT1/2 areal coverage in MNTB (above) or LSO (below) of 4 and 7 wk mice. VGLUT1/2 levels in MNTB were not altered from BLZ/PLX treatment. BLZ/PLX mice showed an increase in VGLUT1/2 levels with age. Increased VGLUT1/2 levels in central LSO were detected in the 7 wk DMSO/CTL group. (C) VGAT (green) immunolabeling and their overlay in control or treated mice at 4 or 7 wk. White dashed lines indicate MNTB or LSO. (D) comparison of overall or regional VGAT coverage in the MNTB (above) or LSO (below) of 4 and 7 wk mice. Overall VGAT levels in MNTB were not affected by microglia depletion but at 4 wk, BLZ/PLX treated mice showed higher VGAT expression in lateral MNTB. VGAT levels increased with age in both the control and treated groups. VGAT levels at 7 wk were higher in central MNTB in both DMSO/CTL and BLZ/PLX groups. There were no overall differences between age or treatment groups in the LSO and VGAT levels were elevated in central LSO at 4 wk in both control and treated groups. (E) GLYT2 (green) immunolabeling and their overlay in the MNTB or LSO of control or treated mice at 4 or 7 wk. White dashed lines indicate MNTB or LSO. (F) Comparison of GLYT2 areal coverage ratio in the MNTB of 4 7 wk mice. BLZ/PLX treated mice at 4 wk showed elevated GLYT2 levels. Lateral MNTB contained higher levels of GLYT2 in 4 wk BLZ/PLX mice. In the LSO, GLYT2 levels increased with age in both control and treated groups. GLYT2 was elevated in the central LSO in control and treated groups at 4 wk. *p < 0.05.
Figure 5
Figure 5
Auditory brainstem response reveals hearing impairments in BLZ/PLX treated mice. (A) Hearing thresholds (dB SPL) in response to click stimuli in 4 and 7 wk mice. BLZ/PLX treated mice had elevated hearing thresholds at both time points. (B) Hearing thresholds (dB SPL) in response to pure tone stimuli in 4 and 7 wk mice. BLZ/PLX mice at 4 wk had increased hearing thresholds in the lower frequencies compared to controls. At 7 wk, BLZ/PLX mice had elevated hearing thresholds at all frequency levels tested. (C) Example trace from a 7 wk control and treated mouse. (D) Peak I amplitudes (µV) in 4 and 7 wk mice at 8, 16, and 32 kHz, respectively. Peak amplitudes in BLZ/PLX mice were comparable to controls at 4 wk and diminished by 7 wk. (E) Peak II amplitudes in 4 and 7 wk mice at 8, 16, and 32 kHz, respectively. Peak amplitudes in BLZ/PLX mice were comparable to controls at 4 wk but diminished by 7 wk in the low and middle frequencies. (F) Peak III amplitudes in 4 and 7 wk mice at 8, 16, and 32 kHz, respectively. Peak amplitudes in BLZ/PLX mice were diminished in low and middle frequencies at both 4 and 7 wk of age. Peak III amplitude at 32 kHz in BLZ/PLX mice was comparable to controls at 4 wk but decreased by 7 wk. (G) Peak IV amplitudes in 4 and 7 wk mice at 8, 16, and 32 kHz, respectively. Peak amplitudes in BLZ/PLX mice were diminished at both 4 and 7 wk in each frequency tested. Asterisks indicate significant differences between age-matched control or treated groups. *p < 0.05.
Figure 6
Figure 6
ABR peak latency is delayed with long-term microglia depletion. (A) Peak I latencies (ms) in 4 and 7 wk mice at 8, 16, and 32 kHz, respectively. Peak I was delayed in the low frequency at 4 and 7 wk in BLZ/PLX mice. In the middle frequency, peak I was comparable to controls at 4 wk but was delayed by 7 wk. There was no difference in peak latency at 32 kHz in the BLZ/PLX mice compared to controls. (B) Peak II latencies (ms) in 4 and 7 wk mice at 8, 16, and 32 kHz, respectively. At 8 kHz, peak II was delayed in BLZ/PLX mice compared to controls at both 4 and 7 wk. BLZ/PLX mice at 7 wk showed delayed peak II latency at 16 kHz. At 32 kHz, peak II was comparable to controls. (C) Peak III latencies in 4 and 7 wk mice at 8, 16, and 32 kHz. Peak III in BLZ/PLX mice was comparable to controls at 4 wk but was delayed in the 7 wk cohort at each frequency. (D) Peak IV latencies in 4 and 7 wk mice at 8, 16, and 32 kHz, respectively. Peak IV latency was delayed in 4 and 7 wk BLZ/PLX mice at 8 kHz. At 16 kHz, peak IV latency was delayed in 7 wk BLZ/PLX mice. Peak IV latency was delayed at 32 kHz in 4 and 7 wk BLZ/PLX mice. *p < 0.05.
Figure 7
Figure 7
ABR interpeak latency is altered in microglia-depleted mice. (A) Peak I-II interpeak latencies (ms) in 4 and 7 wk mice at 8, 16, and 32 kHz, respectively. Peak I-II signal transmission was not affected by BLZ/PLX treatment. (B) Peak II-III interpeak latencies at 8, 16, and 32 kHz, respectively. At 7 wk, BLZ/PLX mice showed increased peak latencies at each frequency tested. (C) Peak III-IV interpeak latencies in 4 and 7 wk mice at 8, 16, and 32 kHz, respectively. At 8 kHz, peak III-IV latencies were longer in BLZ/PLX mice at both 4 and 7 wk. At 16 and 32 kHz, peak III-IV latencies were shortened at 4 wk. By 7 wk, 16 kHz recordings in BLZ/PLX mice showed reduced interpeak latencies and 32 kHz recordings were comparable to controls. (D) Peak I-IV interpeak latencies in 4 and 7 wk mice at 8, 16, and 32 kHz, respectively. At 4 wk, peak I-IV latency was shortened in BLZ/PLX mice at the highest frequency tested. BLZ/PLX mice at 7 wk showed delayed peak I-IV latency at all frequencies tested. *p < 0.05.

References

    1. Tollin DJ. The lateral superior olive: A functional role in sound source localization. Neuroscientist. 2003;9(2):127–143. - PubMed
    1. Gjoni E, et al. Specific synaptic input strengths determine the computational properties of excitation-inhibition integration in a sound localization circuit. J. Physiol. 2018;596(20):4945–4967. - PMC - PubMed
    1. Boudreau JC, Tsuchitani C. Binaural interaction in the cat superior olive S segment. J. Neurophysiol. 1968;31(3):442–454. - PubMed
    1. Magnusson AK, et al. Retrograde GABA signaling adjusts sound localization by balancing excitation and inhibition in the brainstem. Neuron. 2008;59(1):125–137. - PubMed
    1. Karcz A, et al. Low-voltage activated Kv1.1 subunits are crucial for the processing of sound source location in the lateral superior olive in mice. J. Physiol. 2011;589(Pt 5):1143–1157. - PMC - PubMed