

Dementia risk prediction in individuals with mild cognitive impairment: a comparison of Cox regression and machine learning models
- PMID: 36324086
- PMCID: PMC9628121
- DOI: 10.1186/s12874-022-01754-y
Dementia risk prediction in individuals with mild cognitive impairment: a comparison of Cox regression and machine learning models
Abstract
Background: Cox proportional hazards regression models and machine learning models are widely used for predicting the risk of dementia. Existing comparisons of these models have mostly been based on empirical datasets and have yielded mixed results. This study examines the accuracy of various machine learning and of the Cox regression models for predicting time-to-event outcomes using Monte Carlo simulation in people with mild cognitive impairment (MCI).
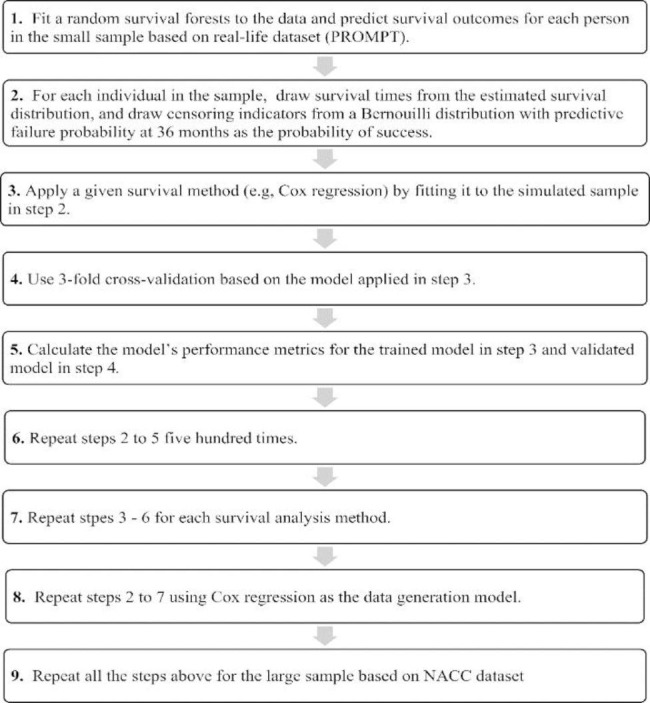
Methods: The predictive accuracy of nine time-to-event regression and machine learning models were investigated. These models include Cox regression, penalized Cox regression (with Ridge, LASSO, and elastic net penalties), survival trees, random survival forests, survival support vector machines, artificial neural networks, and extreme gradient boosting. Simulation data were generated using study design and data characteristics of a clinical registry and a large community-based registry of patients with MCI. The predictive performance of these models was evaluated based on three-fold cross-validation via Harrell's concordance index (c-index), integrated calibration index (ICI), and integrated brier score (IBS).
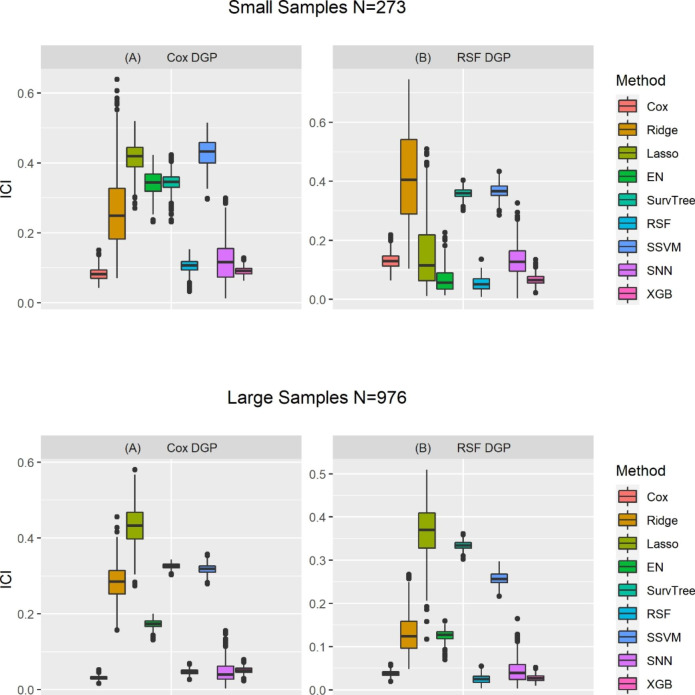
Results: Cox regression and machine learning model had comparable predictive accuracy across three different performance metrics and data-analytic conditions. The estimated c-index values for Cox regression, random survival forests, and extreme gradient boosting were 0.70, 0.69 and 0.70, respectively, when the data were generated from a Cox regression model in a large sample-size conditions. In contrast, the estimated c-index values for these models were 0.64, 0.64, and 0.65 when the data were generated from a random survival forest in a large sample size conditions. Both Cox regression and random survival forest had the lowest ICI values (0.12 for a large sample size and 0.18 for a small sample size) among all the investigated models regardless of sample size and data generating model.
Conclusion: Cox regression models have comparable, and sometimes better predictive performance, than more complex machine learning models. We recommend that the choice among these models should be guided by important considerations for research hypotheses, model interpretability, and type of data.
Keywords: Cox regression; Dementia; Machine learning; Risk prediction; Time-to-event outcomes.
© 2022. The Author(s).
Conflict of interest statement
None declared under financial, general, and institutional competing interests.
Figures


References
Publication types
MeSH terms
Grants and funding
- P50 AG016574/AG/NIA NIH HHS/United States
- P30 AG049638/AG/NIA NIH HHS/United States
- P50 AG016573/AG/NIA NIH HHS/United States
- P50 AG005133/AG/NIA NIH HHS/United States
- P50 AG005136/AG/NIA NIH HHS/United States
- P50 AG047266/AG/NIA NIH HHS/United States
- P30 AG019610/AG/NIA NIH HHS/United States
- P30 AG010161/AG/NIA NIH HHS/United States
- P30 AG035982/AG/NIA NIH HHS/United States
- P50 AG005134/AG/NIA NIH HHS/United States
- P30 AG010129/AG/NIA NIH HHS/United States
- P30 AG053760/AG/NIA NIH HHS/United States
- P30 AG066518/AG/NIA NIH HHS/United States
- P30 AG010124/AG/NIA NIH HHS/United States
- P50 AG033514/AG/NIA NIH HHS/United States
- P30 AG010133/AG/NIA NIH HHS/United States
- P50 AG005146/AG/NIA NIH HHS/United States
- U01 AG016976/AG/NIA NIH HHS/United States
- P30 AG062422/AG/NIA NIH HHS/United States
- P30 AG012300/AG/NIA NIH HHS/United States
- P30 AG008051/AG/NIA NIH HHS/United States
- P50 AG023501/AG/NIA NIH HHS/United States
- P50 AG005681/AG/NIA NIH HHS/United States
- P30 AG028383/AG/NIA NIH HHS/United States
- P50 AG008702/AG/NIA NIH HHS/United States
- P50 AG047270/AG/NIA NIH HHS/United States
- P50 AG005138/AG/NIA NIH HHS/United States
- P50 AG005131/AG/NIA NIH HHS/United States
- P50 AG005142/AG/NIA NIH HHS/United States
- P30 AG008017/AG/NIA NIH HHS/United States
- P30 AG072947/AG/NIA NIH HHS/United States
- P50 AG047366/AG/NIA NIH HHS/United States
- P30 AG013854/AG/NIA NIH HHS/United States
- P50 AG025688/AG/NIA NIH HHS/United States
- P30 AG013846/AG/NIA NIH HHS/United States
LinkOut - more resources
Full Text Sources
Medical
