

CT-derived vessel segmentation for analysis of post-radiation therapy changes in vasculature and perfusion
- PMID: 36324304
- PMCID: PMC9619090
- DOI: 10.3389/fphys.2022.1008526
CT-derived vessel segmentation for analysis of post-radiation therapy changes in vasculature and perfusion
Abstract
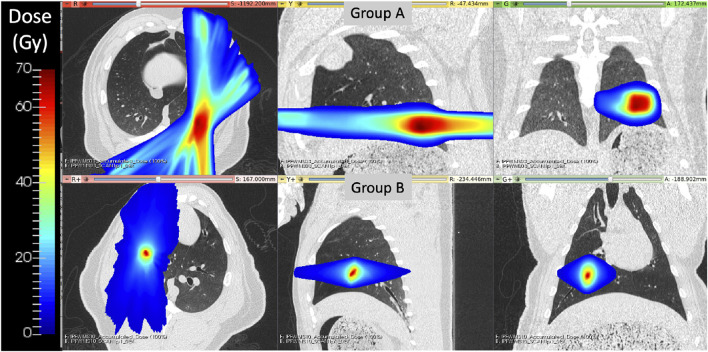
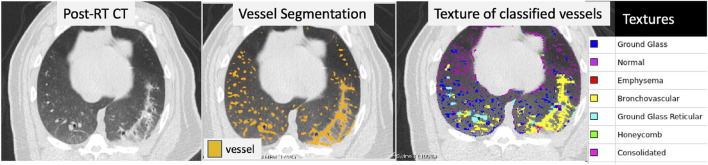
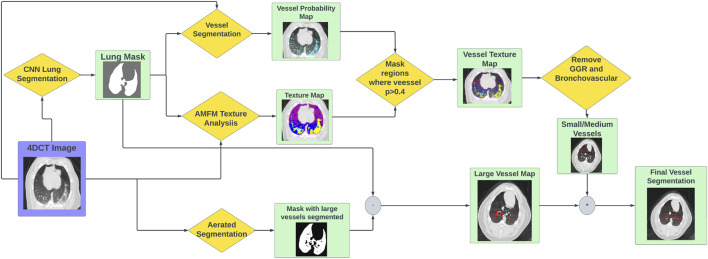
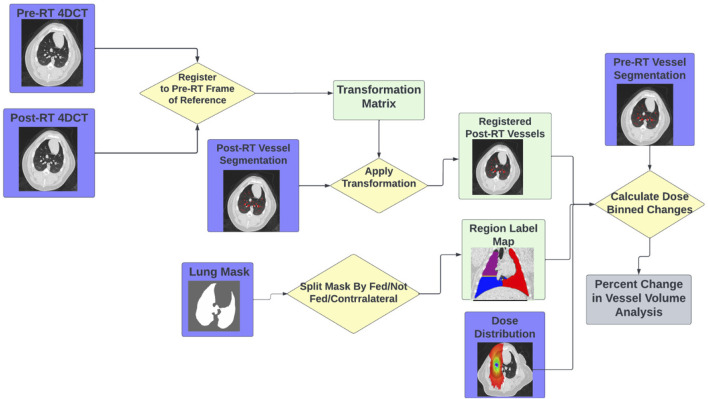
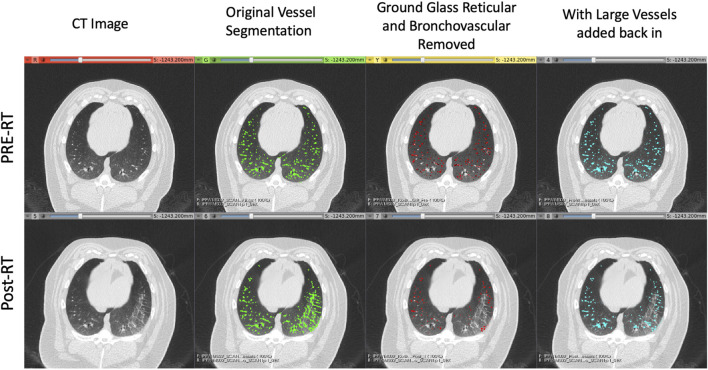
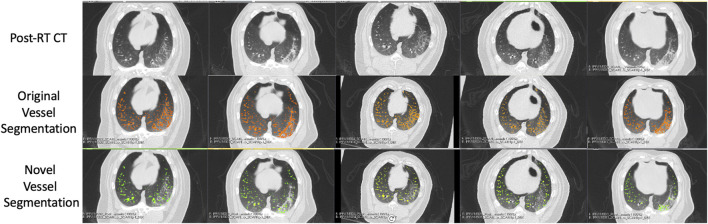
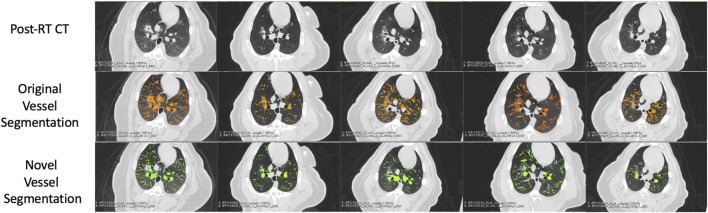
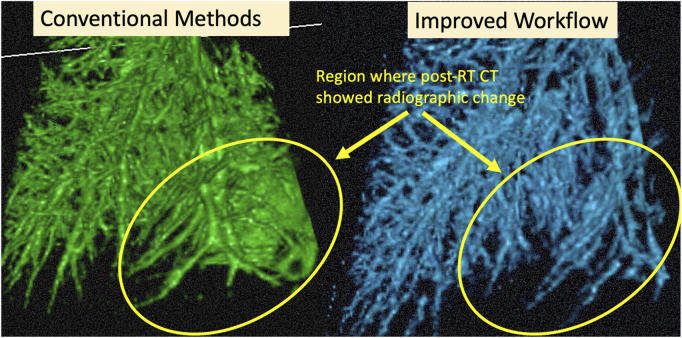
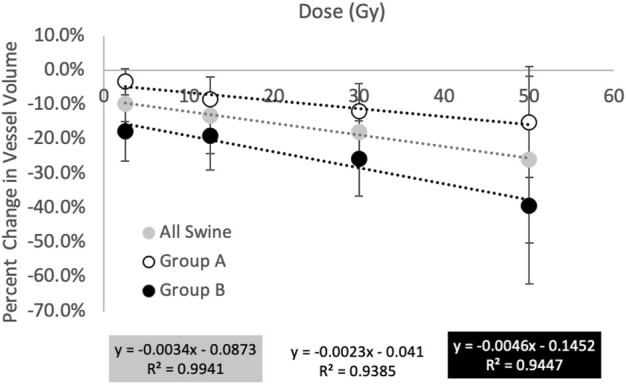
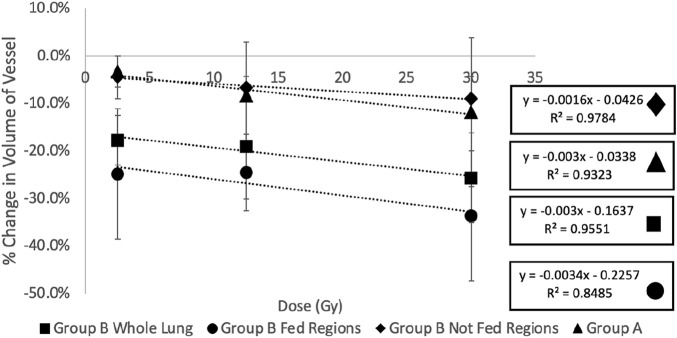
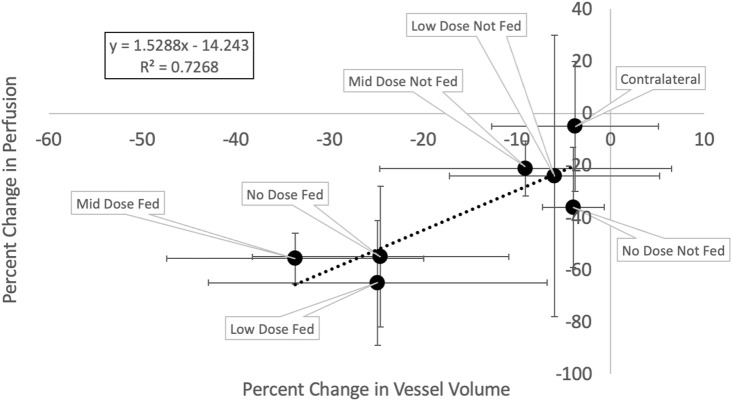
Vessel segmentation in the lung is an ongoing challenge. While many methods have been able to successfully identify vessels in normal, healthy, lungs, these methods struggle in the presence of abnormalities. Following radiotherapy, these methods tend to identify regions of radiographic change due to post-radiation therapytoxicities as vasculature falsely. By combining texture analysis and existing vasculature and masking techniques, we have developed a novel vasculature segmentation workflow that improves specificity in irradiated lung while preserving the sensitivity of detection in the rest of the lung. Furthermore, radiation dose has been shown to cause vascular injury as well as reduce pulmonary function post-RT. This work shows the improvements our novel vascular segmentation method provides relative to existing methods. Additionally, we use this workflow to show a dose dependent radiation-induced change in vasculature which is correlated with previously measured perfusion changes (R 2 = 0.72) in both directly irradiated and indirectly damaged regions of perfusion. These results present an opportunity to extend non-contrast CT-derived models of functional change following radiation therapy.
Keywords: ct-derived perfusion; lung perfusion; post-RT vascular change; pulmonary vasculature segmentation; radiation-induced damage.
Copyright © 2022 Wuschner, Flakus, Wallat, Reinhardt, Shanmuganayagam, Christensen, Gerard and Bayouth.
Conflict of interest statement
JR is a shareholder in VIDA Diagnostics, Inc., GC receives licensing fees from VIDA Diagnostics, Inc., and JB has ownership interest in MR Guidance, LLC. MR Guidance has business activity with ViewRay, Inc., and while this project was not sponsored in any way by ViewRay, data were collected on the ViewRay MRIdian system. Data were collected on a Radixact system (Accuray, Inc.) provided to UW-Madison under a research agreement (JB, PI) The remaining authors declare that the research was conducted in the absence of any commercial or financial relationships that could be construed as a potential conflict of interest.
Figures
Similar articles
-
Radiation-induced Hounsfield unit change correlates with dynamic CT perfusion better than 4DCT-based ventilation measures in a novel-swine model.Sci Rep. 2021 Jun 23;11(1):13156. doi: 10.1038/s41598-021-92609-x. Sci Rep. 2021. PMID: 34162987 Free PMC article.
-
Measuring Indirect Radiation-Induced Perfusion Change in Fed Vasculature Using Dynamic Contrast CT.J Pers Med. 2022 Jul 30;12(8):1254. doi: 10.3390/jpm12081254. J Pers Med. 2022. PMID: 36013203 Free PMC article.
-
Regional dose response to pulmonary irradiation using a manual method.Radiother Oncol. 1998 Jul;48(1):53-60. doi: 10.1016/s0167-8140(98)00057-7. Radiother Oncol. 1998. PMID: 9756172
-
Automated vessel segmentation in lung CT and CTA images via deep neural networks.J Xray Sci Technol. 2021;29(6):1123-1137. doi: 10.3233/XST-210955. J Xray Sci Technol. 2021. PMID: 34421004 Review.
-
Segmentation and Image Analysis of Abnormal Lungs at CT: Current Approaches, Challenges, and Future Trends.Radiographics. 2015 Jul-Aug;35(4):1056-76. doi: 10.1148/rg.2015140232. Radiographics. 2015. PMID: 26172351 Free PMC article. Review.
Cited by
-
Validation of CT-based ventilation and perfusion biomarkers with histopathology confirms radiation-induced pulmonary changes in a porcine model.Sci Rep. 2023 Jun 9;13(1):9377. doi: 10.1038/s41598-023-36292-0. Sci Rep. 2023. PMID: 37296169 Free PMC article.
-
The draft genome of the Wisconsin Miniature SwineTM, a valuable biomedical research tool.G3 (Bethesda). 2025 Jun 4;15(6):jkaf067. doi: 10.1093/g3journal/jkaf067. G3 (Bethesda). 2025. PMID: 40191916 Free PMC article.
-
Quantifying robustness of CT-ventilation biomarkers to image noise.Front Physiol. 2023 Feb 14;14:1040028. doi: 10.3389/fphys.2023.1040028. eCollection 2023. Front Physiol. 2023. PMID: 36866176 Free PMC article.
References
-
- American Cancer Society (2022). 2022-cancer-facts-and-figures. American Cancer Society.
-
- Andrews H. C., Swartzlander E. E. (1973). Introduction to mathematical techniques in pattern recognition. IEEE Trans. Syst. Man, Cybern. SMC-3, 302. 10.1109/TSMC.1973.4309231 - DOI
LinkOut - more resources
Full Text Sources