[Preprint]. 2022 Oct 24:2022.10.21.512606.
doi: 10.1101/2022.10.21.512606.

Modulation of type I interferon responses potently inhibits SARS-CoV-2 replication and inflammation in rhesus macaques

Affiliations

Modulation of type I interferon responses potently inhibits SARS-CoV-2 replication and inflammation in rhesus macaques

Timothy N Hoang et al. bioRxiv. .

Update in

  • Modulation of type I interferon responses potently inhibits SARS-CoV-2 replication and inflammation in rhesus macaques.
    Viox EG, Hoang TN, Upadhyay AA, Nchioua R, Hirschenberger M, Strongin Z, Tharp GK, Pino M, Nguyen K, Harper JL, Gagne M, Marciano S, Boddapati AK, Pellegrini KL, Pradhan A, Tisoncik-Go J, Whitmore LS, Karunakaran KA, Roy M, Kirejczyk S, Curran EH, Wallace C, Wood JS, Connor-Stroud F, Voigt EA, Monaco CM, Gordon DE, Kasturi SP, Levit RD, Gale M Jr, Vanderford TH, Silvestri G, Busman-Sahay K, Estes JD, Vaccari M, Douek DC, Sparrer KMJ, Johnson RP, Kirchhoff F, Schreiber G, Bosinger SE, Paiardini M. Viox EG, et al. Sci Immunol. 2023 Jul 28;8(85):eadg0033. doi: 10.1126/sciimmunol.adg0033. Epub 2023 Jul 28. Sci Immunol. 2023. PMID: 37506197 Free PMC article.

Abstract

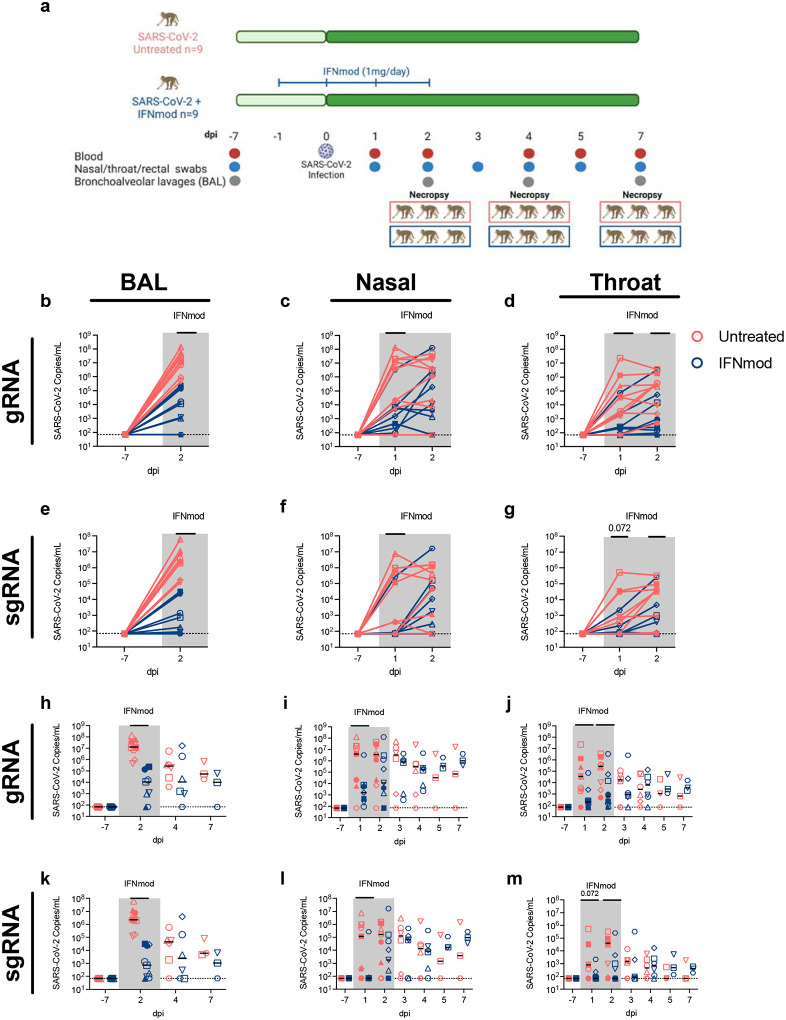
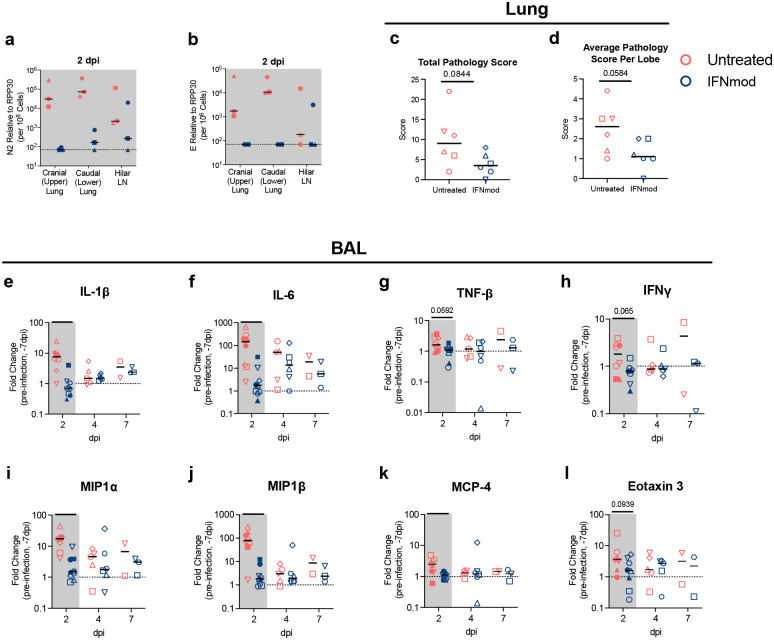
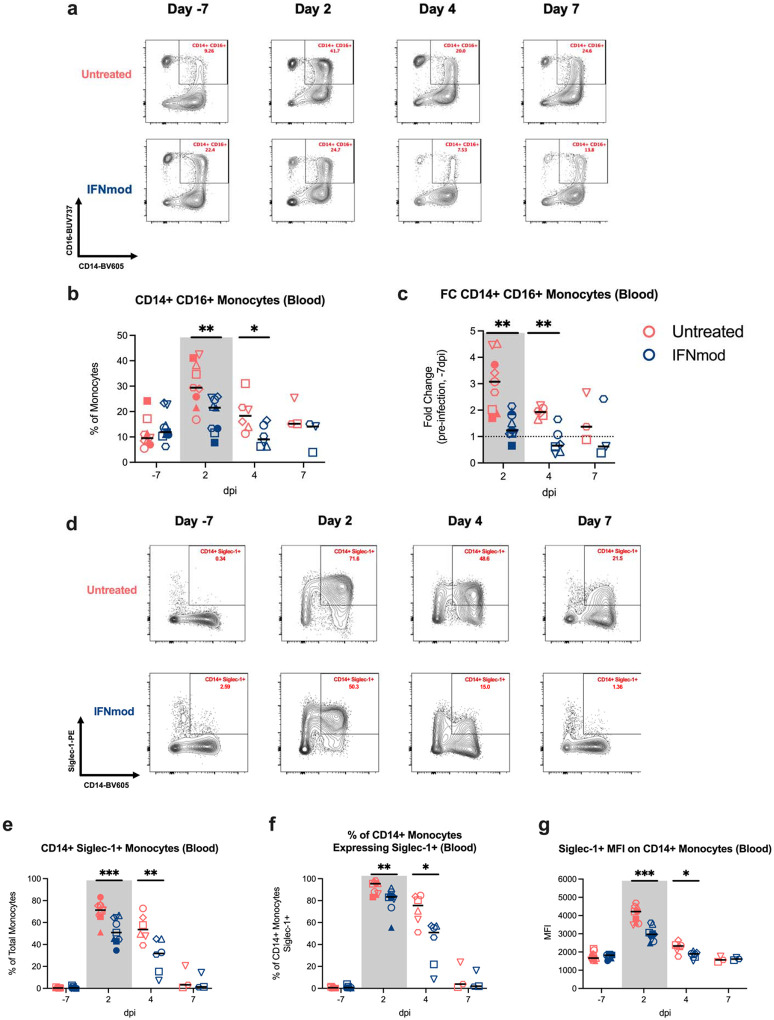
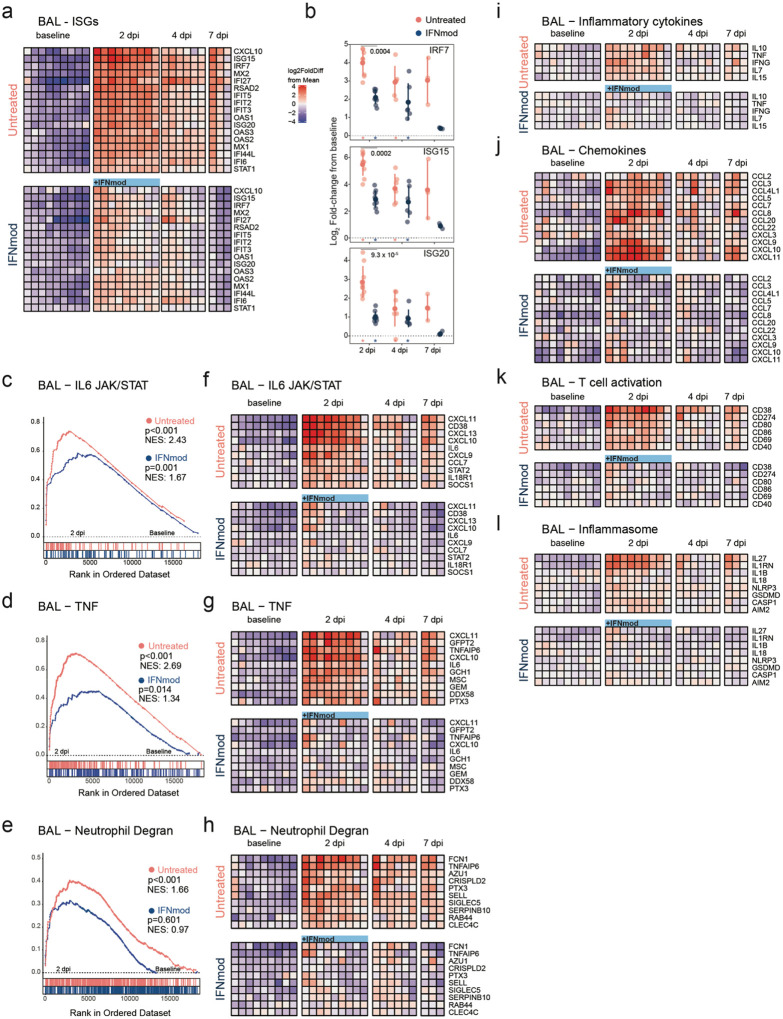
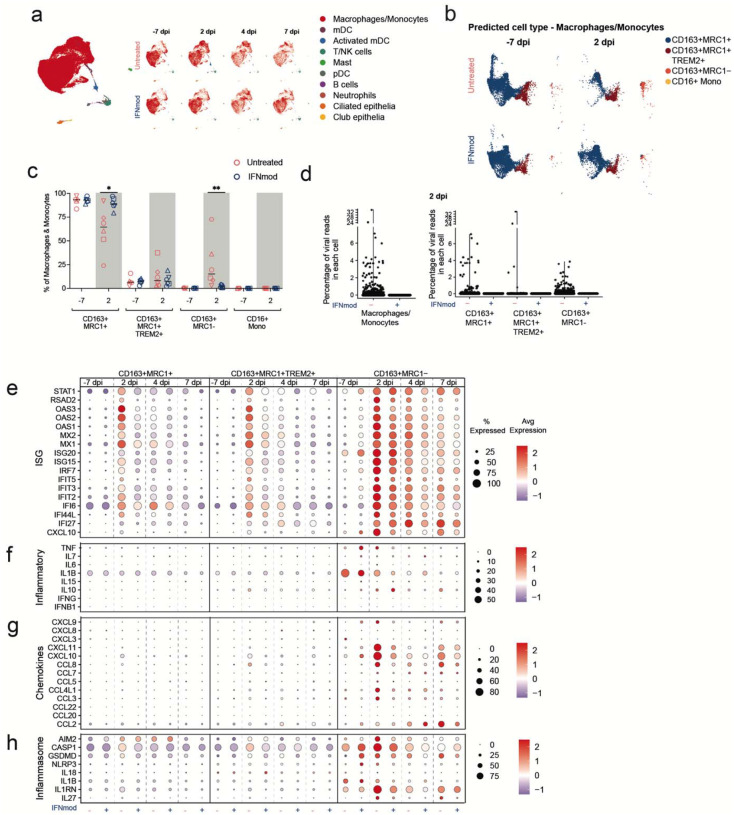
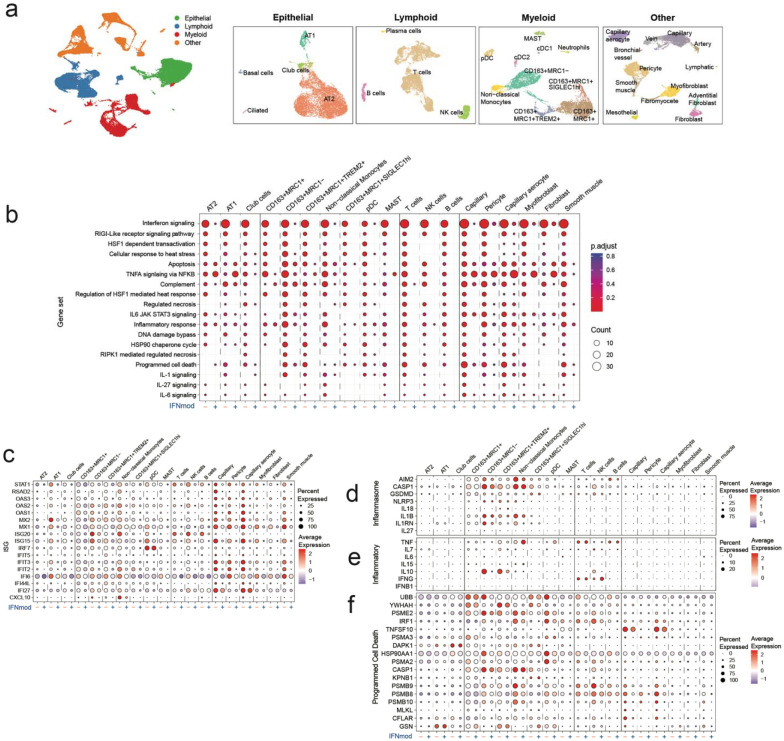
Type-I interferons (IFN-I) are critical mediators of innate control of viral infections, but also drive recruitment of inflammatory cells to sites of infection, a key feature of severe COVID-19. Here, and for the first time, IFN-I signaling was modulated in rhesus macaques (RMs) prior to and during acute SARS-CoV-2 infection using a mutated IFNα2 (IFN-modulator; IFNmod), which has previously been shown to reduce the binding and signaling of endogenous IFN-I. In SARS-CoV-2-infected RMs, IFNmod reduced both antiviral and inflammatory ISGs. Notably, IFNmod treatment resulted in a potent reduction in (i) SARS-CoV-2 viral load in Bronchoalveolar lavage (BAL), upper airways, lung, and hilar lymph nodes; (ii) inflammatory cytokines, chemokines, and CD163+MRC1-inflammatory macrophages in BAL; and (iii) expression of Siglec-1, which enhances SARS-CoV-2 infection and predicts disease severity, on circulating monocytes. In the lung, IFNmod also reduced pathogenesis and attenuated pathways of inflammasome activation and stress response during acute SARS-CoV-2 infection. This study, using an intervention targeting both IFN-α and IFN-β pathways, shows that excessive inflammation driven by type 1 IFN critically contributes to SARS-CoV-2 pathogenesis in RMs, and demonstrates the potential of IFNmod to limit viral replication, SARS-CoV-2 induced inflammation, and COVID-19 severity.


Conflict of interest statement

Competing Interests

The authors have nothing to disclose.

Figures

Fig. 1.
Fig. 1.. IFNmod administration results in significant reduction in viral loads of SARS-CoV-2 infected RMs.
(a) Study Design; 18 RMs were infected intranasally and intratracheally with SARS-CoV-2. 1 day prior to infection (−1dpi), 9 RMs started a 4-dose regimen of IFNmod (1mg/day) that continued up until 2dpi while the other 9 RMs remained untreated. RMs were sacrificed at 2, 4, or 7 dpi. Levels of SARS-CoV-2 gRNA N (b-d) and sgRNA E (e-g) in BAL, nasopharyngeal swabs, and throat swabs during IFNmod treatment. Levels of SARS-CoV-2 gRNA N (h-j) and sgRNA E (k-m) in BAL, nasopharyngeal swabs, and throat swabs longitudinally throughout the entire duration of the study. Untreated animals are depicted in red and IFNmod-treated animals are depicted in blue. Black lines in h-m represent median viral loads for each treatment group at each timepoint. Gray-shaded boxes indicate that timepoint occurred during IFNmod treatment. Statistical analyses were performed using non-parametric Mann-Whitney tests. * p-value < 0.05, ** p-value < 0.01.
Fig. 2.
Fig. 2.. IFNmod administration resulted in lower levels of lung pathology and inflammatory cytokines and chemokines in SARS-CoV-2-infected RMs.
Levels of SARS-CoV-2 gRNA (a) and (b) sgRNA in cranial (upper) lung, caudal (lower) lung, and hilar lymph nodes (LNs) of RMs necropsied at 2 dpi. (c) Total lung pathology scores and (d) average lung pathology scores per lobe of RMs necropsied at 4 and 7 dpi. (e-l) Fold change of cytokines and chemokines in BAL fluid relative to −7 dpi measured by mesoscale. Untreated animals are depicted in red and IFNmod treated animals are depicted in blue. Black lines represent the median viral load, pathology score, or fold change in animals from each respective treatment group. Gray-shaded boxes indicate that timepoint occurred during IFNmod treatment. Statistical analyses were performed using non-parametric Mann-Whitney tests. * p-value < 0.05, ** p-value < 0.01.
Fig. 3.
Fig. 3.. IFNmod-treated RMs had lower frequencies of CD14+CD16+ monocytes and expression of Siglec-1 compared to untreated RMs.
(a) Representative staining of classical (CD14+CD16-), non-classical (CD14-CD16+), and inflammatory (CD14+CD16+) monocytes in peripheral blood throughout the course of infection. (b-c) Frequency and fold change relative to pre-infection baseline (−7dpi) of inflammatory (CD14+CD16+) monocytes in peripheral blood. (d-e) Representative staining and frequency of Siglec-1+ CD14+ monocytes in peripheral blood. (f) Frequency of CD14+ monocytes that were Siglec-1+ in peripheral blood. (g) MFI of Siglec-1 on CD14+ monocytes in peripheral blood. Untreated animals are depicted in red and IFNmod treated animals are depicted in blue. Black lines represent the median frequency or fold change in animals from each respective treatment group. Gray-shaded boxes indicate that timepoint occurred during IFNmod treatment. Statistical analyses were performed using non-parametric Mann-Whitney tests. * p-value < 0.05, ** p-value < 0.01
Fig. 4.
Fig. 4.. IFNmod treatment suppresses gene expression of ISGs, inflammation and neutrophil degranulation in the BAL of SARS-CoV-2 infected NHPs.
Bulk RNA-Seq profiles of BAL cell suspensions obtained at −7 dpi (n = 9 for each arm), 2 dpi (n = 9 per arm), 4 dpi (n = 6 per arm), and 7 dpi (n = 3 per arm). (a) Heatmap of longitudinal gene expression in BAL prior to and following SARS-CoV-2 infection for the ISG gene panel. The color scale indicates log2 expression relative to the mean of all samples. Samples obtained while the animals were receiving IFNmod administration are depicted by a blue bar. (b) Distribution of log2 fold-changes of select ISGs relative to baseline. Filled dots represent the mean, and lighter dots are individual data points. Asterisks indicate statistical significance (padj < 0.05) of gene expression relative to baseline within treatment groups; black horizontal bars indicate p-values of direct contrasts of the gene expression between groups at time-points (i.e. IFNmod vs Untreated). (c-e) GSEA enrichment plots depicting pairwise comparison of gene expression of 2 dpi samples vs −7 dpi samples within treatment groups. The untreated group is depicted by red symbols, and data for the IFNmod treated group is shown in blue. The top-scoring (i.e. leading edge) genes are indicated by solid dots. The hash plot under GSEA curves indicate individual genes and their rank in the dataset. Left-leaning curves (i.e. positive enrichment scores) indicate enrichment, or higher expression, of pathways at 2 dpi, right-leaning curves (negative enrichment scores) indicate higher expression at −7 dpi. Sigmoidal curves indicate a lack of enrichment, i.e. equivalent expression between the groups being compared. The normalized enrichment scores and nominal p-values testing the significance of each comparison are indicated. Genesets were obtained from the MSIGDB (Hallmark and Canonical Pathways) database. (f-h) Heatmaps of longitudinal gene expression after SARS-CoV-2. Genes plotted are the top 10 genes in the leading edge of geneset enrichment analysis calculated in panels c-e for each pathway in the Untreated 2 dpi vs −7 dpi comparison. (i-l) Longitudinal gene expression for selected DEGs in immune signaling pathways. The expression scale is depicted in the top right of panel A.
Fig. 5.
Fig. 5.. Effect of IFNmod treatment on gene expression of BAL single-cells using 10X.
(a) UMAP of BAL samples (62,081 cells) integrated using reciprocal PCA showing cell type annotations. UMAP split by treatment and time points are also shown. (b) Mapping of macrophage/monocyte cells in the BAL of SARS-CoV-2-infected untreated and IFNmod treated RMs to different lung macrophage/monocyte subsets from healthy rhesus macaque. (c) Percentage of different macrophage/monocyte subsets out of all the macrophage/monocytes in BAL at −7 dpi and 2 dpi from untreated and IFNmod treated RMs. The black bars represent the median. Statistical analyses between treatment groups were performed using non-parametric Mann-Whitney tests. * p-value < 0.05, ** p-value < 0.01. (d) Violin Plots showing the percentage of viral reads in each cell for total macrophages/monocytes and individual macrophages/monocytes subsets at 2 dpi determined using the PercentageFeatureSet in Seurat. (e-h) Dot Plots showing expression of selected ISGs (e), inflammatory genes (f), chemokines (g) and inflammasome genes (h). The size of the dot indicates the percentage of cells that express a given a gene and the color indicates the level of expression. The numbers of CD16+ monocytes were very low and have been thus omitted.
Fig. 6.
Fig. 6.. Effect of IFNmod treatment on lung cells.
(a) UMAP based on reciprocal PCA of lung single cells collected at 2 dpi (n = 2 Untreated, 2 IFNmod) and 7 dpi (n = 1 Untreated, 1 IFNmod). The cells were classified into four broad categories – epithelial, lymphoid, myeloid and others (stromal and endothelial). The cells from each category were subset and clustered separately. UMAPs for each category with cell type annotations are also shown. (b) Selected gene sets that were found to be enriched (p-adjusted value < 0.05) in lung cells from untreated RMs at 2 dpi based on over-representation analysis using Hallmark, Reactome, KEGG, and BioCarta gene sets from msigdb. The size of the dots represents the number of genes that were enriched in the gene set and the color indicates the p-adjusted value. The gene set id in order are: M983, M15913, M27255, M27253, M5902, M5890, M5921, M27250, M41804, M5897, M5932, M27698, M27251, M29666, M27436, M27895, M27897, M1014. (C-F) Dot plots showing gene expression in lung cells present at higher frequencies from untreated and IFNmod treated macaques at 2 dpi (c) ISG, (d) genes related to inflammasome, (e) inflammation, and (f) programmed cell death. The size of the dot represents the percent of cells expressing a given gene and the color indicates the average expression.

Similar articles

Cited by

References

    1. Tan W., et al. A Novel Coronavirus Genome Identified in a Cluster of Pneumonia Cases - Wuhan, China 2019–2020. China CDC Wkly 2, 61–62 (2020). - PMC - PubMed
    1. Isaacs A. & Lindenmann J. Virus interference. I. The interferon. Proc R Soc Lond B Biol Sci 147, 258–267 (1957). - PubMed
    1. Isaacs A., Lindenmann J. & Valentine R.C. Virus interference. II. Some properties of interferon. Proc R Soc Lond B Biol Sci 147, 268–273 (1957). - PubMed
    1. Fensterl V., Chattopadhyay S. & Sen G.C. No Love Lost Between Viruses and Interferons. Annu Rev Virol 2, 549–572 (2015). - PMC - PubMed
    1. Schoggins J.W. Interferon-Stimulated Genes: What Do They All Do? Annu Rev Virol 6, 567–584 (2019). - PubMed

Publication types