. 2022 Sep 6;15(10):4323-4337.
doi: 10.1039/d2ee01754g. eCollection 2022 Oct 12.

A mechanistic study of the dopant-induced breakdown in halide perovskites using solid state energy storage devices

Affiliations

A mechanistic study of the dopant-induced breakdown in halide perovskites using solid state energy storage devices

Angus G M Mathieson et al. Energy Environ Sci. .

Abstract

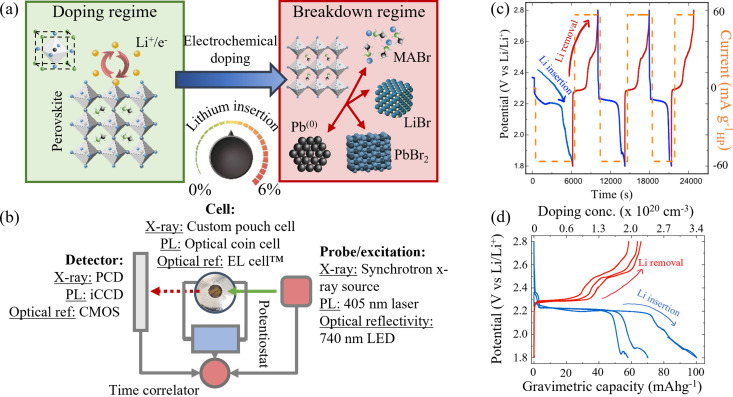
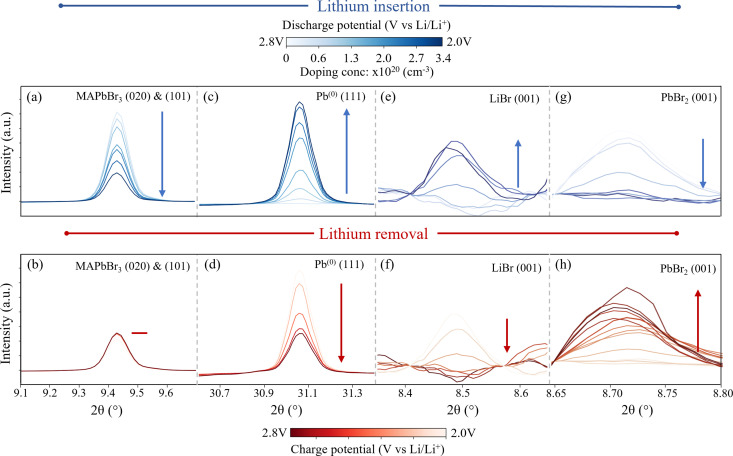
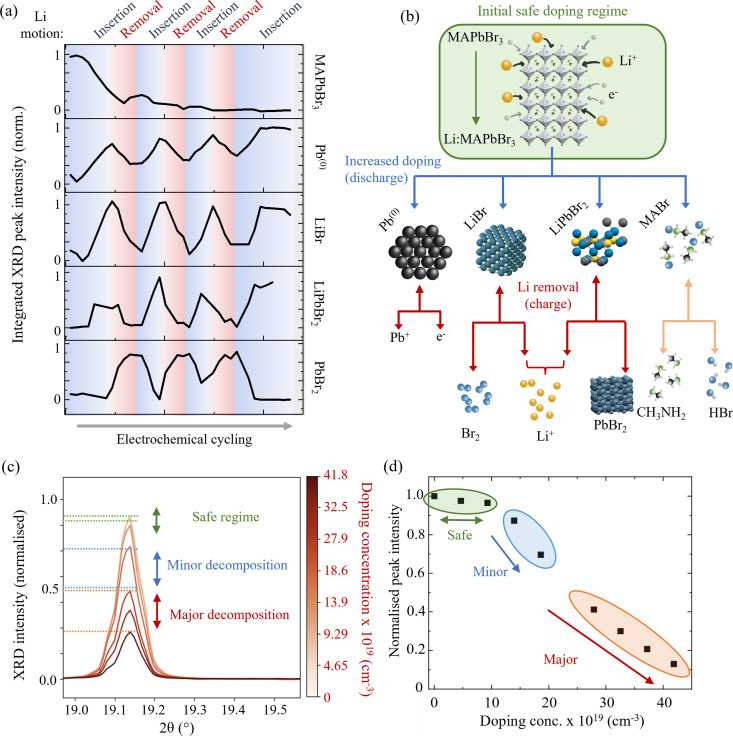
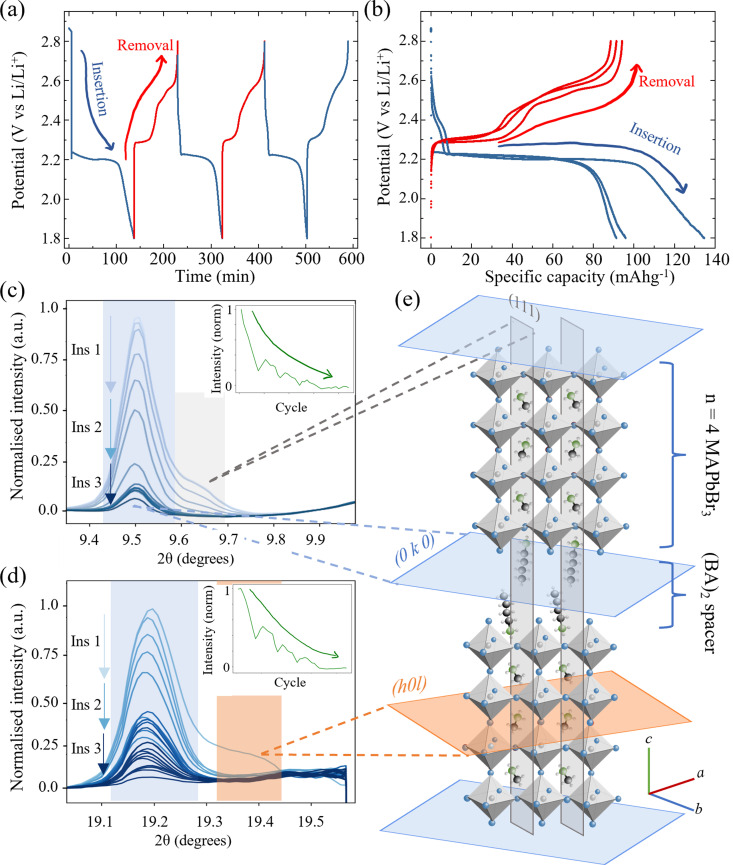
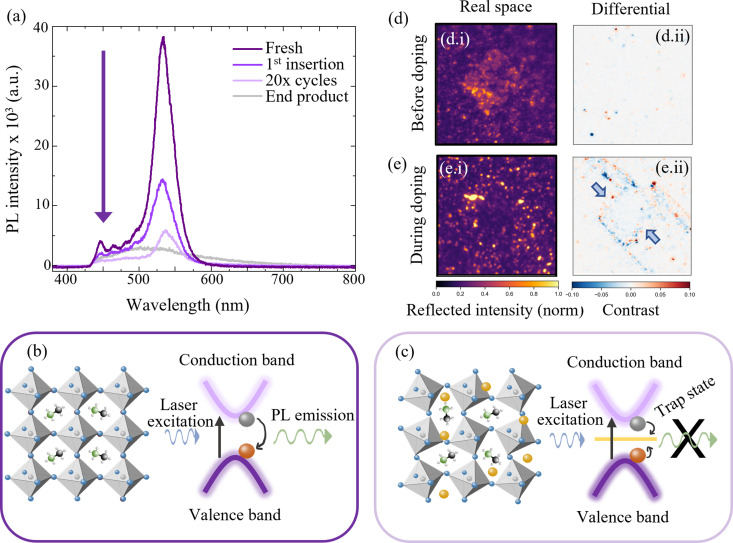
Doping halide perovskites (HPs) with extrinsic species, such as alkali metal ions, plays a critical, albeit often elusive role in optimising optoelectronic devices. Here, we use solid state lithium ion battery inspired devices with a polyethylene oxide-based polymer electrolyte to dope HPs controllably with lithium ions. We perform a suite of operando material analysis techniques while dynamically varying Li doping concentrations. We determine and quantify three doping regimes; a safe regime, with doping concentrations of <1020 cm-3 (2% Li : Pb mol%) in which the HP may be modified without detrimental effect to its structure; a minor decomposition regime, in which the HP is partially transformed but remains the dominant species; and a major decomposition regime in which the perovskite is superseded by new phases. We provide a mechanistic description of the processes mediating between each stage and find evidence for metallic Pb(0), LiBr and LiPbBr2 as final decomposition products. Combining results from synchrotron X-ray diffraction measurements with in situ photoluminescence and optical reflection microscopy studies, we distinguish the influences of free charge carriers and intercalated lithium independently. We find that the charge density is equally as important as the geometric considerations of the dopant species and thereby provide a quantitative framework upon which the future design of doped-perovskite energy devices should be based.


Conflict of interest statement

There are no conflicts to declare.

Figures

Fig. 1
Fig. 1. (a) Schematic representation of two doping regimes. Left: Safe doping regime, where Li is reversibly inserted into the perovskite structure. (MAPbBr3 unit cell shown inset). Right: Breakdown regime with phase conversion products shown inset. (b) Schematic reduction of the operando characterisation techniques used to probe the properties of the perovskite while dynamically inserting and removing Li ions via electrochemical cycling. PCD – Dectris PILATUS 300 kW photon counting detector. iCCD – intensified charge coupled device. CMOS – complementary metal oxide semiconductor active pixel sensor. (c) Galvanostatic cycling process used to insert (blue traces) and remove (red traces) lithium from MAPbBr3. The potential vs. Li/Li+ varies as lithium is inserted and removed (left axis). Right axis (orange trace) indicates the applied current at each stage. (d) Charge–discharge curves of the first three insertion and removal cycles at 60 mA g−1. Gravimetric capacity corresponds to the amount of Li+ inserted (blue) or removed (red) in each cycle.
Fig. 2
Fig. 2. Operando XRD peak behaviour of each species rising and falling during the Li doping (blue) and removal (red) in MAPbBr3. (Wavelength λ = 0.9918 Å, 12.5 keV) Blue data corresponds to peak changes during Li insertion and red data to Li removal. Peaks proceed from low to high colour intensity as indicated by arrow. Peaks correspond to: (a and b) (020) and (101) MAPbBr3 (cubic space group Pmm). The two orientations overlap and resolution is not sufficient to distinguish. (c and d) (111) Pb(0) (cubic space group Fmm). (e and f) (001) LiBr (hexagonal space group P63mc) (g and h) Behaviour of the (001) reflection of PbBr2 during the first charge cycle (bottom red) and second lithiation (top blue) cycle. (orthorhombic space group Pnma.) The corresponding cell potential and doping concentrations for each peak are provided in colour bars at the top and bottom of the figure.
Fig. 3
Fig. 3. Li doping induced decomposition of MAPbBr3. (a) Normalised XRD peak integrated intensity as a function of multiple Li insertion and removal cycles for each of the studied species. Blue regions correspond to Li insertion and red to Li removal. (b) Schematic representation of the MAPbBr3 phase conversion pathways and decomposition products. Blue arrows denote processes that occur during Li insertion and red (downwards-pointing) arrows during Li removal. Decomposition of MABr (orange) is assumed to occur regardless of applied current. Double headed arrows denote bidirectional processes. (c) Close examination of Li insertion effects on MAPbBr3. Peak corresponds to the (032) (main peak) and (040) (left hand shoulder) of MAPbBr3 and is representative of all indexed MAPbBr3 peaks during this process. (Wavelength λ = 0.9918 Å, 12.5 keV.) (d) Integrated peak intensity as a function of doping concentration. Green, blue and red regions correspond to three doping regimes: safe, minor decomposition and major decomposition respectively, which are also indicated by horizontal lines on the diffraction peak in (c). Beyond the safe doping regime, a rapid decrease in perovskite peak intensity is observed.
Fig. 4
Fig. 4. Operando XRD characterisation of 2d/3d hybrid perovskite (BA)2(MA)3Pb4Br13 during electrochemical doping. (a) Galvanostatic cycling protocol comprising three charge–discharge cycles at current density 60 mA g−1. (b) Corresponding charge–discharge voltage plateaus showing the electrochemical processes between 1.8 V and 2.8 V vs. Li/Li+ and their associated gravimetric capacities. (c) Behaviour of the (0 10 0) (blue) and (111) (grey) diffraction peaks of (BA)2(MA)3Pb4Br13 (indexed phase cubic Cc2m). Inset, normalised intensity of combined peaks during three insertion/removal cycles. (d) (0 20 0) (blue) and (202) (orange) reflections of the HP. (e) Schematic illustration of the crystallographic planes in (BA)2(MA)3Pb4Br13 showing the intra-perovskite reflections (grey and orange) and inter-perovskite reflections (blue). N. B. Planes are colour coded to match the respective peaks in (c) and (d). (Wavelength λ = 0.9918 Å, 12.5 keV.)
Fig. 5
Fig. 5. Optical characterisation of hybrid perovskites (BA)2(MA)3Pb4Br13 and MAPbBr3 during electrochemical doping. (a) Photoluminescence (PL) spectra of MAPbBr3 electrode at various stages of Li doping. (b) Schematic representation of the radiative band-to-band recombination of the unperturbed MAPbBr3 species. (c) Intercalation of lithium ions (yellow) and resulting lattice distortion leads to quenching of PL in the perturbed system. NB cartoon in (c) is approximate and does not represent a calculated structure. (d) (i) Operando reflection microscopy of (BA)2(MA)3Pb4Br13 before electrochemical insertion of Li showing a characteristic square crystallite. (ii) Differential frame analysis at t = 0 (before applying current). (e) (i) Operando reflection microscopy during electrochemical insertion of Li to an average (electrode-level) doping concentration of 3.0 × 1020 cm−3 showing loss of perovskite particulate structure. (ii) Differential frame analysis during the doping process (on the lithiation potential plateau at 2.1 V) showing inward procession of decreasing reflectivity. (Blue regions in differential plots correspond to loss in reflectivity and red to an increase in reflectivity.)

References

    1. A decade of perovskite photovoltaics Nat. Energy. 2019;4:1. doi: 10.1038/s41560-018-0323-9. doi: 10.1038/s41560-018-0323-9. - DOI - DOI
    1. Park N.-G. Perovskite solar cells: an emerging photovoltaic technology. Mater. Today. 2015;18:65–72. doi: 10.1016/j.mattod.2014.07.007. - DOI
    1. Snaith H. J. Perovskites: The Emergence of a New Era for Low-Cost, High-Efficiency Solar Cells. J. Phys. Chem. Lett. 2013;4:3623–3630. doi: 10.1021/jz4020162. - DOI
    1. Green M. Dunlop E. Hohl-Ebinger J. Yoshita M. Kopidakis N. Hao X. Solar cell efficiency tables (version 59) Prog. Photovoltaics. 2022;29:3–15.
    1. Stranks S. D. Snaith H. J. Metal-halide perovskites for photovoltaic and light-emitting devices. Nat. Nanotechnol. 2015;10:391–402. doi: 10.1038/nnano.2015.90. - DOI - PubMed

LinkOut - more resources