. 2022 Nov;10(21):e15481.
doi: 10.14814/phy2.15481.

Celecoxib impairs primary human myoblast proliferation and differentiation independent of cyclooxygenase 2 inhibition

Affiliations

Celecoxib impairs primary human myoblast proliferation and differentiation independent of cyclooxygenase 2 inhibition

Ronald W Matheny Jr et al. Physiol Rep. 2022 Nov.

Abstract

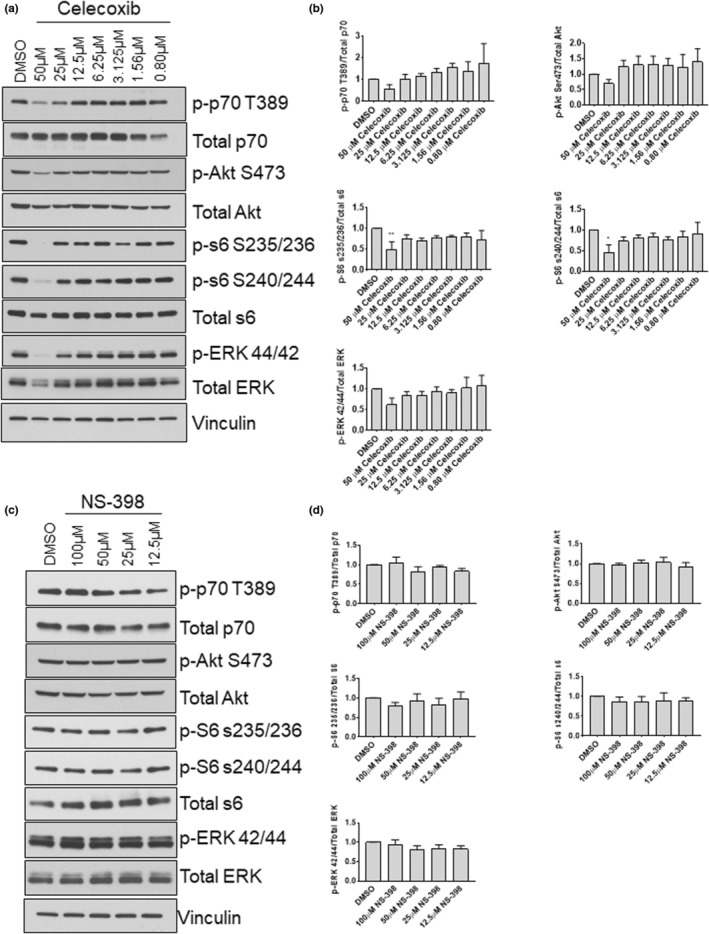
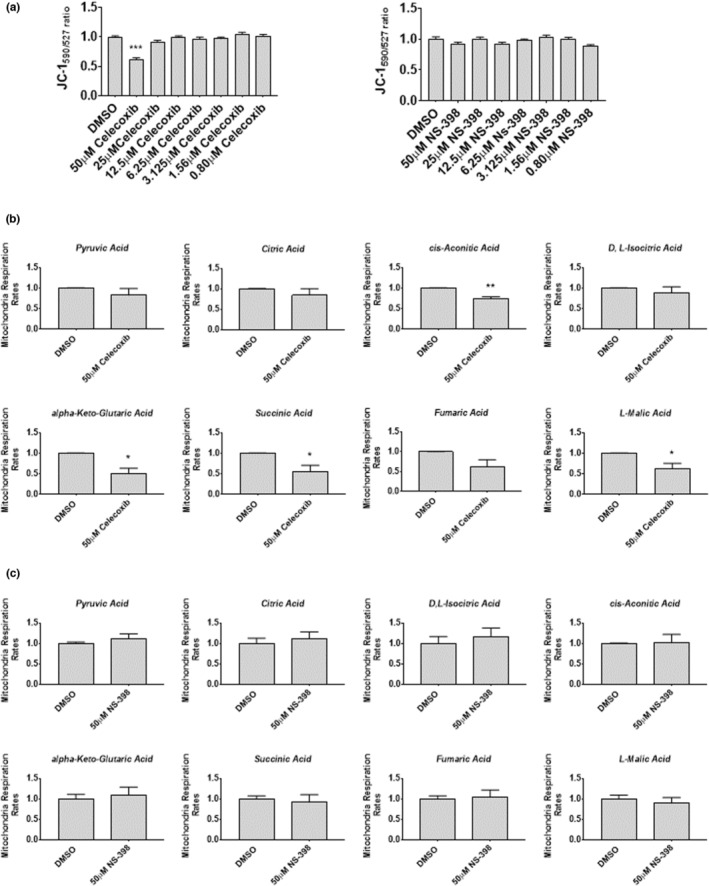
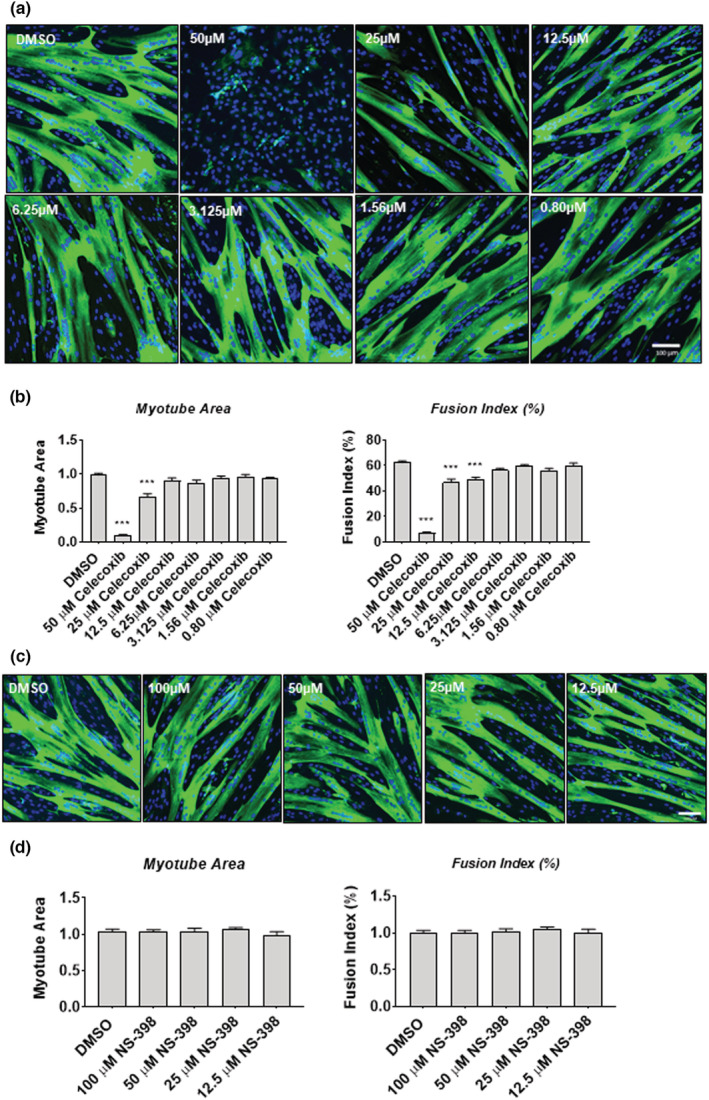
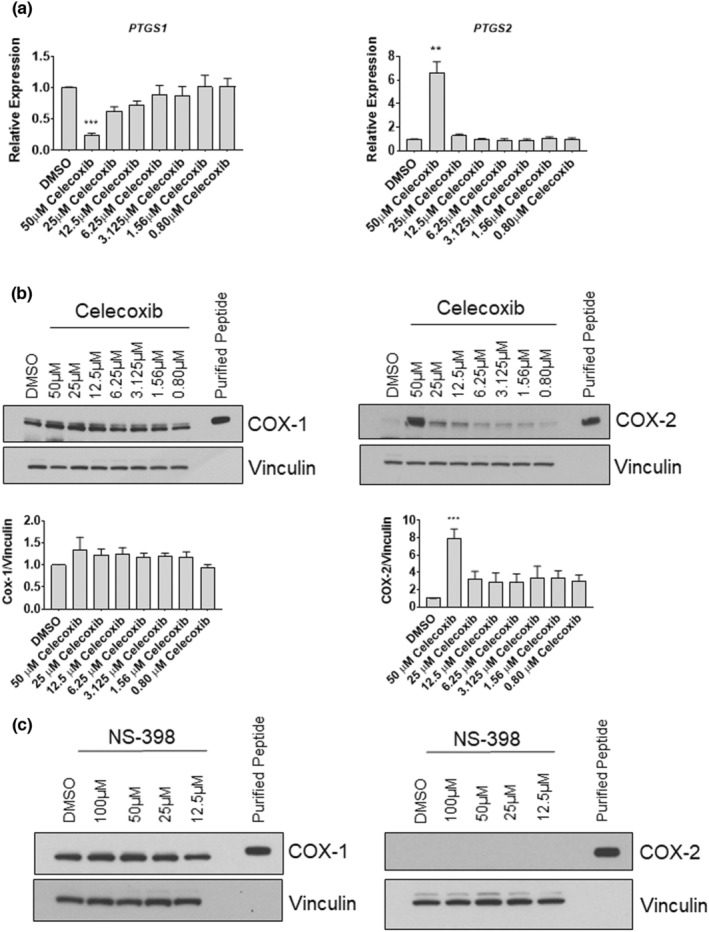
The use of non-steroidal anti-inflammatory drugs (NSAIDs) for treatment of musculoskeletal injuries is commonplace in the general, athletic, and military populations. While NSAIDs have been studied in a variety of tissues, the effects of NSAIDs on skeletal muscle have not been fully defined. To address this, we investigated the degree to which the cyclooxygenase (COX)-2-selective NSAID celecoxib affects muscle cell proliferation, differentiation, anabolic signaling, and mitochondrial function in primary human skeletal myoblasts and myotubes. Primary muscle cells were treated with celecoxib or NS-398 (a pharmacological inhibitor of COX-2) as a control. Celecoxib administration significantly reduced myoblast proliferation, viability, fusion, and myotube area in a dose-dependent manner, whereas NS-398 had no effect on any of these outcomes. Celecoxib treatment was also associated with reduced phosphorylation of ribosomal protein S6 in myoblasts, and reduced phosphorylation of AKT, p70S6K, S6, and ERK in myotubes. In contrast, NS-398 did not alter phosphorylation of these molecules in myoblasts or myotubes. In myoblasts, celecoxib significantly reduced mitochondrial membrane potential and respiration, as evidenced by the decreased citric acid cycle (CAC) intermediates cis-aconitic acid, alpha-keto-glutarate acid, succinate acid, and malic acid. Similar results were observed in myotubes, although celecoxib also reduced pyruvic acid, citric acid, and fumaric acid. NS-398 did not affect CAC intermediates in myoblasts or myotubes. Together, these data reveal that celecoxib inhibits proliferation, differentiation, intracellular signaling, and mitochondrial function in primary human myoblasts and myotubes independent of its function as a COX-2 inhibitor.

Keywords: celecoxib; cyclooxygenase; inflammation; mitochondria; myoblast; non-steroidal anti-inflammatory drug (NSAID).


Conflict of interest statement

The authors have no conflict of interests to report.

Figures

FIGURE 1
FIGURE 1
Celecoxib inhibits prostaglandin production in a dose‐dependent manner in primary human myoblasts. (a) Myoblasts were seeded and exposed to the indicated concentration of arachidonic acid (AA), celecoxib, or the combination for 48‐h. Conditioned media was collected and ELISAs performed to determine levels of PGE2 or PGF2α, as indicated. Data are expressed as mean ± SD and represents four independent determinations (*** p < 0.001; * p < 0.05). (b) Myoblasts were seeded and exposed to the indicated concentration of arachidonic acid (AA), NS‐398, or the combination for 48‐h. Conditioned media was collected and assayed as described in (a). Data are expressed as mean ± SD and represents four independent determinations (*** p < 0.001; ** p < 0.01; * p < 0.05).
FIGURE 2
FIGURE 2
Celecoxib reduces myoblast cell number and viability in a dose‐dependent manner. (a) Myoblasts were seeded and exposed to the indicated concentration of celecoxib for 48‐h. Total cell number was determined using an automated cell counter with live cell staining using trypan blue. Trypan blue‐excluding myoblasts were considered live. Data are expressed as mean ± SD from three independent experiments each performed in triplicate (*** p < 0.001; ** p < 0.01). (b) Myoblasts were seeded and treated with celecoxib as described in (a), and MTT assay was used to assess cell viability. Data are expressed as mean ± SD from three independent experiments (*** p < 0.001; ** p < 0.01). (c) Myoblasts were seeded, treated with indicated concentrations of NS‐398, and counted as described in (a). Data are expressed as mean ± SD from three independent experiments, each performed in triplicate. (d) Myoblasts were seeded, treated with indicated concentrations of NS‐398, and MTT assay performed as described in (b). Data are expressed as mean ± SD from three independent experiments, each performed in triplicate. (e) Myoblasts were seeded, treated with indicated concentrations of celecoxib and (or) Long IGF‐I as indicated, and counted as described in (A). Data are expressed as mean ± SD from two independent experiments performed in duplicate (*** p < 0.001; ** p < 0.01). (f) Myoblasts were seeded, treated with indicated concentrations of celecoxib and (or) Long IGF‐I as indicated, and MTT assay performed as described in (b). Data are expressed as mean ± SD from two independent experiments, each performed in duplicate (*** p < 0.001).
FIGURE 3
FIGURE 3
Effects of celecoxib and NS‐398 on anabolic signaling molecules. (a) Myoblasts were treated with the indicated concentration of celecoxib or vehicle (DMSO) for 48‐h. Protein lysates were obtained and Western immunoblotting was performed using the indicated antibodies. (b) Quantifications of blots shown in (a). Phosphorylated protein levels were first normalized to the total expression of the relevant molecule and then expressed relative to DMSO control, which was set at 1.0. Data are expressed as mean ± SD from three independent experiments (** p < 0.01; * p < 0.05). Myoblasts were treated with the indicated concentration of NS‐398 or vehicle (DMSO) for 48‐h and harvested for protein and Western blot. (d) Quantification of blots shown in (c) and quantified as described in (b).
FIGURE 4
FIGURE 4
Celecoxib does not alter COX protein in myoblasts. (a) Myoblasts were treated with the indicated concentration of celecoxib or diluent (DMSO) for 48‐h. Protein lysates were obtained and Western immunoblotting was performed using the indicated antibodies. Purified recombinant COX‐1 or COX‐2, identified as “purified peptide,” were subjected to Western blot alongside samples to verify correct antibody immunoreactivity with each isoform. Blots are representative from three independent experiments. Graphs beneath Western blots show quantification of COX‐1 and COX‐2 Western blots. Quantifications were performed by normalizing expression of each COX isoform to vinculin, and then normalized to control which was set at 1.0. (b) Myoblasts were treated and Western blots performed exactly as described in (a) using the indicated concentrations of NS‐398. Blots are representative of three independent experiments.
FIGURE 5
FIGURE 5
Celecoxib does not affect COX RNA transcript expression in myoblasts. (a) Myoblasts were treated with various concentrations of Celecoxib (a), NS‐398 (b), or vehicle (DMSO) in growth media for 48 h. Cells were harvested 48‐h after seeding, RNA was extracted, and RT‐PCR performed using primers/probes for PTGS1 (COX‐1) or PTGS2 (COX‐2) and normalized to GAPDH gene expression. Data are expressed as mean ± SD from four independent experiments, each performed in triplicate.
FIGURE 6
FIGURE 6
Mitochondrial respiration is reduced in human myoblasts following 48‐h celecoxib treatment. (a) Myoblasts were treated with various concentrations of celecoxib or NS‐398, as indicated, for 48 h. Mitochondria membrane potential was measured using JC‐1, a membrane potential‐sensitive dye. Values from DMSO‐treated control JC‐1590 nm/527 nm ratios were set to 1.0, and all other treatment conditions were expressed relative to DMSO control. Data are expressed as mean ± SD and represent eight experimental replicates. (*** p < 0.001). (b) Myoblasts were treated with 50 μM Celecoxib for 48 h. Mitochondrial respiration, using various substrates, was analyzed by measuring the reduction of tetrazolium redox dye as the final electron acceptor. Respiration ratios of DMSO control myoblasts were set to 1.0 for each substrate, and respiration ratios from celecoxib‐treated myoblasts were expressed relative to DMSO control myoblasts. Data are expressed as mean ± SD and represents 3 independent experiments (** p < 0.01; * p < 0.05). (c) Myoblasts were treated with 50 μM NS‐398 for 48 h. Mitochondrial respiration was assessed and expressed as described in (b). Data are expressed as mean ± SD and represents 3 independent experiments.
FIGURE 7
FIGURE 7
Celecoxib inhibits Prostaglandin production in a dose‐dependent manner in human myotubes. (a) Myoblasts were seeded in differentiation media and exposed to the indicated concentration of arachidonic acid (AA), celecoxib, or the combination for 72‐h. Conditioned media was collected and ELISAs performed to determine levels of PGE2 or PGF2α, as indicated. Data are expressed as mean ± SD and represents four independent determinations (*** p < 0.001; * p < 0.05). (b) Myoblasts were seeded and exposed to the indicated concentration of arachidonic acid (AA), NS‐398, or the combination for 48‐h. Conditioned media was collected and assayed as described in (a). Data are expressed as mean ± SD and represents four independent determinations (*** p < 0.001; ** p < 0.01; * p < 0.05).
FIGURE 8
FIGURE 8
Celecoxib decreases myotube area and fusion index in a dose‐dependent fashion. (a) Myoblasts were exposed to the indicated concentrations of celecoxib or DMSO diluent and allowed to differentiate for 72 h. Cells were fixed and prepared for fluorescent confocal microscopy using an antibody that recognizes embryonic myosin heavy chain (MF‐20). Images were prepared from a Zeiss LSM 700 confocal microscope and processed using Zen software. Celecoxib concentrations are provided in the upper left of each image. (b) Quantification of myotube area and fusion index from experiments shown in (a) (means ± SD; n = 3 independent experiments; 5 fields analyzed per experimental point; *** p < 0.001). (c) Myoblasts were exposed to the indicated concentrations of NS‐398 (or DMSO) and allowed to differentiate for 72 h. Cells were processed and imaged as described in (a). (d) Quantification of myotube area and fusion index from experiments shown in (c) (means ± SD; n = 3 independent experiments; 5 fields analyzed per experimental point).
FIGURE 9
FIGURE 9
50 μM celecoxib inhibits myosin heavy chain gene expression and myogenin. (a) Myotubes were harvested after 72 h exposure to various concentrations of celecoxib and RNA was extracted. RT‐PCR was performed on cDNA derived from each experimental condition using primers/probes specific for each myosin heavy chain (MYH) isoform. Data are expressed as mean ± SD and represent four independent experiments (*** p < 0.001; ** p < 0.01; * p < 0.05). (b) Myotubes were harvested after a 24, 48, or 72 h exposure to the 50 μM of celecoxib and protein was extracted. Western blotting was performed to evaluate the abundance of myosin heavy chain and myogenin at each indicated time point. Bands from myosin heavy chain and myogenin were expressed relative to the control (DMSO alone) at 24 h, which was set at 1.0. Data are expressed as mean ± SD and represent 3 independent experiments (* p < 0.05).
FIGURE 10
FIGURE 10
Effects of celecoxib and NS‐398 on signaling molecules involved in myogenic differentiation. Myotubes were harvested after 72 h exposure to the indicated concentrations of celecoxib and protein was extracted. (a) Western blotting was performed to evaluate the abundance of total and phosphorylated p70S6K (T389), AKT (S473), S6 (S235/236) and ERK (42/44). (b) Quantification of blots shown in (a). Bands from phosphorylated p70S6K, AKT, S6, and ERK were first normalized to total expression of these molecules, and then expressed relative to control (DMSO), which was set at 1.0. Data are expressed as mean ± SD and represents 3 independent experiments (*** p < 0.001; ** p < 0.01; * p < 0.05). (c) Western blotting was performed on lysates derived from myotubes exposed to NS‐398 (or DMSO) for 72‐h. (d) Quantifications of blots shown in (c). Data are expressed as mean ± SD and represents 3 independent experiments.
FIGURE 11
FIGURE 11
Celecoxib alters COX mRNA, but not protein, in cultured human myotubes. (a) Myoblasts were seeded directly into differentiation media containing the indicated concentrations of celecoxib or diluent control (DMSO). Cells were harvested 72 h after seeding, when differentiation into myotubes was complete. (a) RT‐PCR was performed using primers/probes for PTGS1 (COX‐1) or PTGS2 (COX‐2), first normalizing to GAPDH gene expression, and then normalizing to DMSO control, which was set to 1.0. Data are expressed as mean ± SD and represent three independent experiments (p < 0.001; ** p < 0.01). (b) Western blotting was performed on lysates derived from myotubes exposed to the indicated concentrations of celecoxib. Purified recombinant COX‐1 or COX‐2 peptides were electrophoresed alongside experimental samples to verify relative molecular masses of COX enzymes. Data from four independent experiments were quantified as described in Figure legend for Figure 10b, and are expressed as mean ± SD (*** p < 0.001). (c) Western blotting was performed on lysates derived from myotubes exposed to NS‐398 (or DMSO) for 72 h. No differences in levels of COX enzymes were observed at any concentration.
FIGURE 12
FIGURE 12
Celecoxib alters mitochondrial membrane potential and respiration in primary human myotubes. (a) Myotubes were treated with various concentrations of Celecoxib or NS‐398 for 72 h. Mitochondria membrane potential was measured using the membrane potential‐sensitive dye JC‐1. Values from DMSO‐treated control JC‐1590 nm/527 nm ratios were set to 1.0, and all other treatment conditions were expressed relative to DMSO control. Data are expressed as mean ± SD and represent eight experimental replicates (*** p < 0.001; ** p < 0.01; * p < 0.05). (b) Myotubes were treated with 50 μM celecoxib in differentiation media for 72 h. Mitochondria respiration, using the indicated substrates, was analyzed by measuring the reduction of tetrazolium redox dye as the final electron acceptor. Respiration ratios of DMSO control myoblasts were set to 1.0 for each substrate, and respiration ratios from celecoxib‐treated myoblasts were expressed relative to DMSO control myoblasts. Data are expressed as mean ± SD and represent 3 independent experiments (*** p < 0.001; ** p < 0.01; * p < 0.05). (c) Myotubes were treated with 50 μM NS‐398 in differentiation media for 72 h. Mitochondria respiration was analyzed using the indicated substrates. Data are expressed as mean ± SD and represent 3 independent experiments.

References

    1. Alemo Munters, L. , Alexanderson, H. , Crofford, L. J. , & Lundberg, I. E. (2014). New insights into the benefits of exercise for muscle health in patients with idiopathic inflammatory myositis. Current Rheumatology Reports, 16(7), 429. - PMC - PubMed
    1. Benedetti, M. G. , Furlini, G. , Zati, A. , & Letizia, M. G. (2018). The effectiveness of physical exercise on bone density in osteoporotic patients. BioMed Research International, 2018, 4840531. - PMC - PubMed
    1. Biever, A. , Valjent, E. , & Puighermanal, E. (2015). Ribosomal protein S6 phosphorylation in the nervous system: From regulation to function. Frontiers in Molecular Neuroscience, 8, 75. - PMC - PubMed
    1. Bondesen, B. A. , Mills, S. T. , Kegley, K. M. , & Pavlath, G. K. (2004). The COX‐2 pathway is essential during early stages of skeletal muscle regeneration. American Journal of Physiology. Cell Physiology, 287(2), C475–C483. - PubMed
    1. Bondesen, B. A. , Mills, S. T. , & Pavlath, G. K. (2006). The COX‐2 pathway regulates growth of atrophied muscle via multiple mechanisms. American Journal of Physiology. Cell Physiology, 290(6), C1651–C1659. - PubMed

Publication types

MeSH terms

Substances