. 2023 Jan 2;220(1):e20220484.
doi: 10.1084/jem.20220484. Epub 2022 Nov 3.

Inherited human ITK deficiency impairs IFN-γ immunity and underlies tuberculosis

Affiliations

Inherited human ITK deficiency impairs IFN-γ immunity and underlies tuberculosis

Masato Ogishi et al. J Exp Med. .

Abstract

Inborn errors of IFN-γ immunity can underlie tuberculosis (TB). We report three patients from two kindreds without EBV viremia or disease but with severe TB and inherited complete ITK deficiency, a condition associated with severe EBV disease that renders immunological studies challenging. They have CD4+ αβ T lymphocytopenia with a concomitant expansion of CD4-CD8- double-negative (DN) αβ and Vδ2- γδ T lymphocytes, both displaying a unique CD38+CD45RA+T-bet+EOMES- phenotype. Itk-deficient mice recapitulated an expansion of the γδ T and DN αβ T lymphocyte populations in the thymus and spleen, respectively. Moreover, the patients' T lymphocytes secrete small amounts of IFN-γ in response to TCR crosslinking, mitogens, or forced synapse formation with autologous B lymphocytes. Finally, the patients' total lymphocytes secrete small amounts of IFN-γ, and CD4+, CD8+, DN αβ T, Vδ2+ γδ T, and MAIT cells display impaired IFN-γ production in response to BCG. Inherited ITK deficiency undermines the development and function of various IFN-γ-producing T cell subsets, thereby underlying TB.


Conflict of interest statement

Disclosures: Q. Philippot reported personal fees from Gilead outside the submitted work. S.J. Pelham reported other from Takeda UK Ltd outside the submitted work. No other disclosures were reported.

Figures

None
Graphical abstract
Figure 1.
Figure 1.
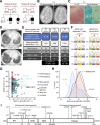
AR ITK deficiency with TB. (A) Pedigree of the kindreds. Black symbols indicate affected individuals. Arrows indicate the probands. Genotypes for ITK are also shown. M, mutated. (B) Cranial T2-weighted MRI for P1. The high-intensity lesion in the right temporal lobe disappeared after 9 mo of anti-TB therapy (post-tx). (C) Surgical biopsy of an enlarged mesenteric lymph node of P1 showing central caseation on H&E staining and acid-fast bacilli (arrows) on Ziehl–Neelsen staining. (D) A thoracic CT scan of the lung of P3 showing tree-in-bud signs. Radiological improvement was observed after 4 mo of anti-TB therapy. (E) Variants detected by WES. (F) Sanger sequencing of the ITK variants. (G) Population genetics of ITK. The minor allele frequency (MAF) and CADD scores for all non-synonymous variants reported in the gnomAD database are shown. Three homozygous variants found in our private cohort are also shown. The CADD score of 35.0 for the c.496C>T (R166*) allele is well above the MSC of 20.7 (Kircher et al., 2014; Itan et al., 2016; horizontal dotted line). (H) Gene-level negative selection. Like other genes with mutations underlying AR IEI, ITK is not under negative selection, as shown by CoNeS (Rapaport et al., 2021). (I) Schematic representation of the ITK protein. PH, pleckstrin homology domain; SH, Src homology domain. Previously reported homozygous or compound heterozygous mutations are also shown.
Figure S1.
Figure S1.
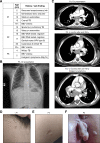
Clinical findings. (A) A table summarizing medical history and key laboratory findings related to infectious diseases in the three patients studied. (B) Chest x ray of P3 on presentation. (C) Thoracic CT scans of P3. (D) A common wart on the forehead of P1. (E) A common wart on the extremity of P2. (F) A genital wart in P2. Infx, infections; Stg, stage.
Figure S2.
Figure S2.
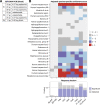
Virological analysis. (A) EBV-DNA viral load in the serum samples of P1, P2, and P3. yo, years old. (B) VirScan analysis of the serum samples of P1 and P2. Species are annotated based on the National Center for Biotechnology Information Taxonomy database (Schoch et al., 2020).
Figure 2.
Figure 2.
Analysis of ITK expression and function. (A–C) Studies of ITK alleles in an overexpression system. (A and B) Immunoblotting of the ITK protein with two different mAbs. (C) Phosphorylation of phospholipase C-γ1. (D and E) Immunoblotting for endogenous ITK protein with two different antibodies, on total T lymphocytes from P1, P2, their father, and one healthy control (Ctrl). (F) TCR signaling assay. Total T lymphocytes from P1, P2, their father, and one healthy control were analyzed by immunoblotting for general tyrosine phosphorylation (pY) and for the phosphorylation of phospholipase C-γ1 without stimulation or after 2 or 5 min of stimulation with anti-CD3 mAb. (G) Calcium (Ca2+) influx assay. Total T lymphocytes from P1, P2, their father, and one healthy control were stimulated by TCR crosslinking (with anti-CD3 and anti-IgG mAbs) or ionomycin. Intracellular Ca2+ concentration was determined with Indo-1. Representative results from at least two independent experiments are shown. Source data are available for this figure: SourceData F2.
Figure S3.
Figure S3.
Phosphorylation of ZAP70. Total T lymphocytes from P1, P2, and two healthy controls (Ctrl) were analyzed by immunoblotting for phosphorylated ZAP70 (Y319) after 5 min of stimulation with anti-CD3 mAb. A representative result from two independent experiments is shown. Source data are available for this figure: SourceData FS3.
Figure 3.
Figure 3.
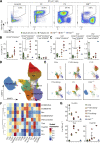
Immunophenotyping of ITK-deficient leukocytes. Freshly thawed PBMCs from P1, P2, P3 (obtained at the ages of 20, 17, and 4 yr, respectively), healthy members of their families, and adult and pediatric controls, together with two IL-12Rβ1-deficient patients and one FAS-deficient patient, were immunophenotyped by spectral flow cytometry. (A) UMAP visualization of cellular composition for 50,000 cells per individual. Cellular identity was determined by manual gating in FlowJo. (B) Abundance of leukocyte subsets. Experiments from two batches of experiments were compiled. Bars represent the mean and SEM. The statistical significance of differences was determined for comparisons of ITK-deficient patients vs. adult, pediatric, and familial controls combined. ***, P < 0.001, two-tailed Wilcoxon’s rank sum tests with FDR adjustment.
Figure 4.
Figure 4.
Atypical phenotypes of ITK-deficient DN αβ and γδ T lymphocytes. PBMCs from P1 (obtained at the ages of 18 and 19 yr), P2 (obtained at the age of 16 yr, free from EBV viremia), P3 (at the age of 4 yr), heterozygous members of their families, one patient with a homozygous LOF (R29C) mutation of ITK with EBV viremia but no history of TB, and one FAS-deficient patient were studied by flow cytometric immunophenotyping. (A) A representative plot of CD38 and T-bet expression. (B and C) Phenotypes of (B) DN αβ T and (C) Vδ2 γδ T lymphocytes. Results from three batches of experiments are compiled. (D–G) FlowSOM-guided clustering analysis. (D and E) UMAP plots of (D) all DN αβ T lymphocytes and (E) 2,500 cells per group. Equal numbers of cells were randomly sampled from each individual in each group. (F) Heatmap of scaled median expression levels. (G) Cluster abundance. In B, C, and G, the bars represent the mean and SEM. In B and C, statistical significance was determined for differences between ITK-deficient patients and adult, pediatric, and familial controls combined. ***, P < 0.001, two-tailed Wilcoxon’s rank sum tests with FDR adjustment.
Figure 5.
Figure 5.
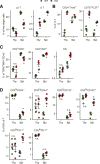
Expansion of the γδ and DN αβ T cell populations in Itk-deficient mice. Five WT and Itk-deficient mice (C57BL/6 background) were studied in two batches of experiments. (A) Frequencies of αβ and γδ T cells in the thymus (Thy) and spleen (Spl). (B) Phenotypes of γδ T cells. CD24 staining was performed for only three of the five mice. (C) αβ T cell subsets. (D) Phenotypes of DN αβ T cells. Bars represent the mean and SEM. Statistical significance was determined for differences between WT and Itk-deficient mice. n.s., not significant. *, P < 0.05, two-tailed Wilcoxon’s rank sum tests with FDR adjustment.
Figure 6.
Figure 6.
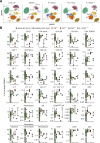
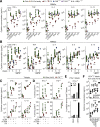
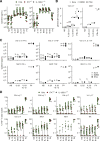
Impaired production of IFN-γ and TNF by ITK-deficient T lymphocytes. (A and B) PBMCs from P1 and P2 (obtained at the ages of 19 and 18 yr, respectively) and their father were stimulated for (A) 18 h or (B) 3 or 5 d with IL-2. Secreted cytokine levels were determined in LEGENDplex assays. Technical duplicates were prepared for (A) P1 or (B) P1, P2, and their father (except P2 for 3 d). (C and D) Expanded T cell blasts (T-blasts) from P1 and P2 were stimulated for 2 h with various reagents and then for an additional 5 h in the presence of a secretion inhibitor. Secreted cytokines were determined with the LEGENDplex assay, and intracellular cytokine levels were determined by flow cytometry. Technical duplicates were prepared for the unstimulated and anti-CD3 mAb-conjugated bead-stimulated samples. (E) Lentiviral rescue. P2’s T-blasts underwent lentiviral transduction with the EV or the WT ITK CDS. Cells were selected on puromycin. Cells were either left unstimulated or stimulated with anti-CD3 mAb-conjugated beads for 5 h. Cytokine production was assessed by flow cytometry. (F) Pharmacological ITK inhibition. Magnetically enriched CD4+ T-blasts from four healthy donors were incubated for 1 h with DMSO or an ITK inhibitor (BMS509744) and were then stimulated for 6 h. Secreted cytokines were determined in LEGENDplex assays. In A–D and F, bars represent the mean and SEM. In A–D, statistical significance was determined for differences between the two ITK-deficient patients on the one hand, and local and familial controls on the other. *, P < 0.05; **, P < 0.01; ***, P < 0.001, and two-tailed Wilcoxon’s rank sum tests with FDR adjustment.
Figure S4.
Figure S4.
Impaired production of IL-9 by ITK-deficient T lymphocytes. (A) T-blasts from P1 and P2 were stimulated for 2 h with various reagents. Secreted cytokines were determined with the LEGENDplex assay. Technical duplicates were prepared for the unstimulated and anti-CD3 mAb-conjugated bead-stimulated samples. (B) Expression of IRF4. T-blasts from P2, her mother, and local controls were either left unstimulated or were stimulated with an anti-CD2/CD3/CD28 mAb cocktail for 24 h and analyzed by flow cytometry. For pharmacological ITK inhibition, T-blasts from controls were cultured in the presence of DMSO or an ITK inhibitor (BMS509744). Bars represent the mean and SEM. Statistical significance was determined for differences between the two ITK-deficient patients on the one hand, and local and familial controls on the other. *, P < 0.05, two-tailed Wilcoxon’s rank sum tests with FDR adjustment. Representative results from two independent experiments are shown.
Figure 7.
Figure 7.
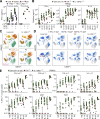
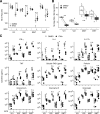
Impaired IFN-γ production in response to mycobacteria. The blood samples of P1 and P2 were obtained at the ages of 19 and 16 yr, respectively. (A) Whole-blood BCG infection assay. One local control and one travel control were grouped as controls. Secreted IFN-γ levels were determined by ELISA. For comparison, data from a previous study (Boisson-Dupuis et al., 2018) are also shown. (B–E) PBMC BCG infection assay. Freshly thawed PBMCs from P1, P2, P4, one IL-12Rβ1-deficient patient, and healthy local controls were stimulated for 40 h with various combinations of IL-12, IL-23, and BCG, and were then incubated with a cytokine secretion inhibitor for 8 h. (B) Secreted cytokine levels, as determined in LEGENDplex assays. (C and D) UMAP visualization of (C) manually gated cell subsets without stimulation and (D) IFN-γ and T-bet expression in non-stimulated and BCG-stimulated cells, as determined by flow cytometry. Results for 10,000 randomly downsampled cells per sample are visualized. (E) IFN-γ production by lymphocyte subsets. In A, B, and E, bars represent the mean and SEM. In B and E, statistical significance was determined for comparisons of the three ITK-deficient patients with local controls. *, P < 0.05, two-tailed Wilcoxon’s rank sum tests with FDR adjustment.
Figure S5.
Figure S5.
Analysis of the role of ITK in IL-23-mediated antimycobacterial immunity. (A) Freshly thawed PBMCs from P1 (age 19 yr), P2 (age 16 yr), P4, one IL-12Rβ1-deficient patient, and healthy local controls, were stimulated for 40 h with various combinations of IL-12, IL-23, and BCG, and were then incubated with a cytokine secretion inhibitor for 8 h. Secreted cytokine levels were determined with a LEGENDplex assay. (B and C) Analysis of IL-23 signaling. Vδ2+ γδ T and MAIT cells were sorted from healthy donors and subjected to pretreatment with DMSO or an ITK inhibitor (BMS509744). (B) STAT3 phosphorylation levels after stimulation with IL-23 or IFNα-2b for 30 min, as determined by flow cytometry. (C) Cytokine secretion, as measured by a LEGENDplex assay, after stimulation with IL-23, with or without IL-1β, for 48 h. (D) TNF production by lymphocyte subsets, as determined by flow cytometry, as in A. In A and D, bars represent the mean and SEM.
Figure 8.
Figure 8.
Human ITK is required for optimal cytotoxicity in innate-like adaptive T lymphocytes. Innate-like adaptive T lymphocyte subsets were sorted from two to three healthy donors, expanded for 2 wk, and cocultured with CFSE-stained Raji cells with or without BiTE in the presence of DMSO or an ITK inhibitor (BMS509744). After 24 h of coculture, the supernatants were collected and analyzed with a LEGENDplex assay. The cells were acquired with an Attune NxT automated flow cytometry instrument to quantify the remaining CFSE+ Raji cells in equal volumes of sample. (A) Absolute numbers of Raji cells per well. (B) The ratio of the numbers of Raji cells in wells with and without BiTE. A higher ratio indicates more potent BiTE-induced Raji cell killing. (C) Secreted cytokines and cytotoxic effector molecules. Bars represent the mean and SEM. Statistical significance was determined for comparisons between samples with or without ITK inhibition. n.s., not significant. *, P < 0.05; **, P < 0.01, and two-tailed Wilcoxon’s rank sum tests with FDR adjustment. Representative results from two independent experiments are shown.

References

    1. Abel, L., El-Baghdadi J., Bousfiha A.A., Casanova J.L., and Schurr E.. 2014. Human genetics of tuberculosis: A long and winding road. Philos. Trans. R. Soc. Lond. B: Biol. Sci. 369:20130428. 10.1098/rstb.2013.0428 - DOI - PMC - PubMed
    1. Abel, L., Fellay J., Haas D.W., Schurr E., Srikrishna G., Urbanowski M., Chaturvedi N., Srinivasan S., Johnson D.H., and Bishai W.R.. 2018. Genetics of human susceptibility to active and latent tuberculosis: Present knowledge and future perspectives. Lancet Infect. Dis. 18:e64–e75. 10.1016/S1473-3099(17)30623-0 - DOI - PMC - PubMed
    1. Alme, C., Satwani P., Alobeid B., Bhagat G., and Kelly K.M.. 2015. Atypical clinical course in pediatric Hodgkin lymphoma: Association with germline mutations in interleukin-2-inducible T-cell kinase. J. Pediatr. Hematol. Oncol. 37:507–508. 10.1097/MPH.0000000000000366 - DOI - PubMed
    1. Altare, F., Ensser A., Breiman A., Reichenbach J., Baghdadi J.E., Fischer A., Emile J.F., Gaillard J.L., Meinl E., and Casanova J.L.. 2001. Interleukin-12 receptor β1 deficiency in a patient with abdominal tuberculosis. J. Infect. Dis. 184:231–236. 10.1086/321999 - DOI - PubMed
    1. Belkadi, A., Pedergnana V., Cobat A., Itan Y., Vincent Q.B., Abhyankar A., Shang L., El Baghdadi J., Bousfiha A., Exome/Array Consortium, et al. . 2016. Whole-exome sequencing to analyze population structure, parental inbreeding, and familial linkage. Proc. Natl. Acad. Sci. USA. 113:6713–6718. 10.1073/pnas.1606460113 - DOI - PMC - PubMed

Publication types

Substances