. 2022 Nov 15;38(45):13923-13934.
doi: 10.1021/acs.langmuir.2c02203. Epub 2022 Nov 3.

Single-Molecule Trapping and Measurement in a Nanostructured Lipid Bilayer System

Affiliations

Single-Molecule Trapping and Measurement in a Nanostructured Lipid Bilayer System

Maria Bespalova et al. Langmuir. .

Abstract

The repulsive electrostatic force between a biomolecule and a like-charged surface can be geometrically tailored to create spatial traps for charged molecules in solution. Using a parallel-plate system composed of silicon dioxide surfaces, we recently demonstrated single-molecule trapping and high precision molecular charge measurements in a nanostructured free energy landscape. Here we show that surfaces coated with charged lipid bilayers provide a system with tunable surface properties for molecular electrometry experiments. Working with molecular species whose effective charge and geometry are well-defined, we demonstrate the ability to quantitatively probe the electrical charge density of a supported lipid bilayer. Our findings indicate that the fraction of charged lipids in nanoslit lipid bilayers can be significantly different from that in the precursor lipid mixtures used to generate them. We also explore the temporal stability of bilayer properties in nanofluidic systems. Beyond their relevance in molecular measurement, such experimental systems offer the opportunity to examine lipid bilayer formation and wetting dynamics on nanostructured surfaces.


Conflict of interest statement

The authors declare no competing financial interest.

Figures

Figure 1
Figure 1
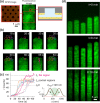
(a) Schematic illustration of a single-molecule trapping device consisting of a parallel array of nanoslits whose surfaces are passivated with SLBs (yellow). Bottom left: illustration of SLBs spreading in the nanoslits carrying surface indentations, or “pockets”, on the top surface. The dimensions are not to scale. Bottom right: wide-field fluorescence image of SLBs spreading in the nanostructured region of two nanoslits (top view). (b) Cross section of a single trapping nanostructure or pocket depicting the spatial distribution of electrical potential in the nanostructured region. Nanostructured features were ≈160 nm deep and either ≈500 or 740 nm in diameter. The SLBs coating the nanoslit surfaces contain POPG/POPC (yellow) and a small fraction of fluorescent Rhodamine-DHPE (green). Bottom left: calculated spatial distribution of minimum axial electrostatic free energy, ΔFel. Bottom right: Probability density distribution, Pt), of measured escape times, Δt, plotted on log–log scale for measurements on 30bp dsDNA in nanostructured POPG/POPC SLB system at three different values of dimensionless slit depth, κh, and fitted to the expression Pt) ∝ exp (−Δt/tesc)/tesc. (c) A series of snapshots in a trap displays the duration of a single recorded escape time, Δt, for fluorescently labeled single molecules entering and leaving a single trap location. Note that although we use fluorescently labeled lipids to visualize SLB formation as shown in (a), (d) and (e), the SLB is bleached to eliminate the fluorescent background signal in single-molecule measurements. This gives rise to a bright signal from the molecule visible against a dark device background. (d) Top: wide-field fluorescence images of SLB formation in ≈10 μm wide slits recorded over 3 h while flushing the SUV suspension containing nominally 20% of POPG at pH 9 and c = 100 mM. Bottom: schematic representation of SLB formation by vesicle rupture and fusion at the surface. (e) Top: wide-field fluorescence images of SLBs in ≈5 μm wide slits created by “steady-migration”, recorded within 37 min while flushing the SUV suspension nominally containing 20% of POPG at pH 3.5 and c = 100 mM. Bottom: schematic representation of SLB migrating steadily in the direction of the flow indicated by the arrow.
Figure 2
Figure 2
Various modes of surface coverage of SLBs in nanostructured silicon dioxide slits. Top panels depict the wide-field fluorescence images of passivated slits upon the completion of SLB formation when using SUV suspensions with (a) pH 3.5, c = 100 mM (See Supporting Movie), (b) pH = 3.5, c = 2 M, and (c) pH = 9, c = 100 mM. Central panels illustrate possible SLB coverage scenarios in a single pocket region for each of the illustrated fluorescence images: the SLB (a) circumvents the pocket, (b) coats the pocket, and (c) caps the pocket (illustration not to scale). Bottom panels depict intensity profiles plotted along the red lines drawn on top of the corresponding wide-field fluorescence images. Gray dashed line indicates I = 150 counts and shows that intensity level at the planar regions of the slits is relatively constant across the three scenarios.
Figure 3
Figure 3
Steadily migrating SLBs circumvent nanostructured surface features. (a) AFM image of the nanostructured slit surface with circular “pocket” indentations (left). Wide-field fluorescence image of the pocket region upon the completion of SLB formation (middle). Here, we used the device with ≈160 nm deep pockets of two different radii, r ≈ 250 and ≈370 nm. Schematic representation of a cross section through the center of a single pocket where the lipid bilayer coats the slits but circumvents the surface feature (right). (b) Wide-field fluorescence images of progressing SLB sequentially recorded in a ≈ 5 μm wide slit while flushing the SUV suspension nominally containing 20% of POPG with pH 3.5 and c = 100 mM. Colored circles indicate the pocket regions traversed by the lipid bilayer during the recording, and the square displays a flat region of the slit in between two neighboring pockets (See Supporting Movie). (c) Temporal evolution of fluorescence intensity signal, I, in the pockets and flat regions during traversal of the SLB across the slit as shown in (b) (left). I0 and Ip denote the average intensities in the flat region and pocket regions upon the completion of the SLB formation, respectively. Sketch of optical point spread functions (PSFs) for two fluorescent Rhodamine-DHPE molecules located on the circumference of the surface nanostructure in an SLB coated slit (green circle) (right). For σPSF= 120 nm and a pocket radius of 250 nm the fluorescence signal intensity in the center of the pocket is ≈25% of the peak intensity at the location of each molecule due to lateral overlap of the PSFs from the two diametrically opposite molecules on the pocket circumference. (d) Wide-field fluorescence images sequentially recorded within 18 min of the SLBs in ≈5 μm wide slits while flushing the SUV suspension nominally containing 20% of POPG with pH 3.5 and c = 100 mM at a typical speed of ≈80 μm/s.
Figure 4
Figure 4
Trapping 60bp dsDNA (qeff = −44.8 e) molecules in SLB systems nominally containing 5% (red), 10% (green), and 20% (blue) of POPG. The three experiments with nominally different SLBs were performed sequentially in the same trapping device. (a) Dependence of measured escape times, tesc, on dimensionless slit height, κh. (b) Measured values (symbols) for electrostatic free energy ΔFel fitted to eq 3 with a single fit parameter, ϕs, the effective surface electrical potential of the SLB. We obtained ϕs = −1.3 ± 0.05 kBT/e (−33 ± 1 mV), −1.6 ± 0.11 kBT/e (−41 ± 3 mV), and −1.5 ± 0.04 kBT/e (−39 ± 1 mV) for SLBs nominally containing 5, 10, and 20% of POPG respectively. (c) Comparison of measured (symbols) and calculated (solid lines) values for ln[ln(tesc/tr)] reveals good agreement over the whole range of κh. Calculated ln[ln(tesc/tr)] values were obtained using eq 4 where ϕs values were taken from ΔFel vs κh fits in (b). (d) Comparison of relative POPG fraction in the obtained SLBs with that in the precursor lipid mixtures reveals the absence of a strong correlation. We infer 1–2% charged lipid in the SLBs with nominal POPG fractions of 5–20%. (e) Representative calculation of electrostatic potential in the slit obtained by solving the Poisson–Boltzmann equation for a given device geometry; solution conditions (2h = 68.4 nm, pH 5.85 and c = 1.10 mM) and surface charge density given by eq 5 with the number density of POPG phosphate groups Γ = 0.021 nm–2.
Figure 5
Figure 5
Trapping 60bp dsDNA (qeff = −44.8 e, circles), 40bp dsDNA (qeff = −33.8 e, triangles), 30bp dsDNA (qeff = −28.1 e, squares), ATTO 542 (qeff = −3.0 e, diamonds) molecules in three different nanoslit SLB devices. Data are provided for measurements on SLBs nominally containing 20% of POPG (blue symbols and lines; device 1), and 5% of POPG in different devices (orange and violet symbols and lines; devices 2 and 3). (a) Dependence of measured escape times, tesc, on κh. (b) Measured values (symbols) for electrostatic free energy ΔFel fitted to the eq 3 with a single fit parameter, ϕs. We obtained ϕs = −1.5 ± 0.04 kBT/e (−39 ± 1 mV) and −1.4 ± 0.04 kBT/e (−36 ± 1 mV) for 60bp (solid blue line) and 30bp dsDNA (dashed blue line) in the SLB system nominally containing 20% of POPG (device 1). For measurements with nominal 5% of POPG we obtain −0.9 ± 0.04 kBT/e (−23 ± 1 mV) and −1 ± 0.02 kBT/e (−26 ± 0.05 mV) for 60bp (solid orange line) and 40bp dsDNA (dashed orange line; device 2) and −2.8 ± 0.12 kBT/e (−72 ± 3 mV) for ATTO 542 (violet solid line; device 3). (c) Comparison of measured (symbols) and calculated (solid lines) values for ln[ln(tesc/tr)] reveals good agreement over the whole range of κh. Calculated ln[ln(tesc/tr)] values were obtained using eq 4 where ϕs values were taken from ΔFel vs κh fits in (b). (d) Comparison of relative POPG fraction in the SLBs with that in the precursor lipid mixtures indicates ≈1–3% negatively charged lipids in the SLBs with nominal POPG fractions of 5 and 20%.

References

    1. Tamm L. K.; McConnell H. M. Supported phospholipid-bilayers. Biophys. J. 1985, 47 (1), 105–113. 10.1016/S0006-3495(85)83882-0. - DOI - PMC - PubMed
    1. Chan Y. H. M.; Boxer S. G. Model membrane systems and their applications. Curr. Opin. Chem. Biol. 2007, 11 (6), 581–587. 10.1016/j.cbpa.2007.09.020. - DOI - PMC - PubMed
    1. Reimhult E.; Baumann M. K.; Kaufmann S.; Kumar K.; Spycher P. R. Advances in nanopatterned and nanostructured supported lipid membranes and their applications. Biotechnology and Genetic Engineering Reviews 2010, 27 (1), 185–216. 10.1080/02648725.2010.10648150. - DOI - PubMed
    1. Richter R. P.; Hock K. K.; Burkhartsmeyer J.; Boehm H.; Bingen P.; Wang G. L.; Steinmetz N. F.; Evans D. J.; Spatz J. P. Membrane-grafted hyaluronan films: A well-defined model system of glycoconjugate cell coats. J. Am. Chem. Soc. 2007, 129 (17), 5306–5307. 10.1021/ja068768s. - DOI - PubMed
    1. McConnell H. M.; Watts T. H.; Weis R. M.; Brian A. A. Supported planar membranes in studies of cell-cell recognition in the immune system. Biochimica Et Biophysica Acta 1986, 864 (1), 95–106. 10.1016/0304-4157(86)90016-X. - DOI - PubMed

Publication types