. 2022 Dec 15;132(24):e153943.
doi: 10.1172/JCI153943.

SCF-SKP2 E3 ubiquitin ligase links mTORC1/ER stress/ISR with YAP activation in murine renal cystogenesis

Affiliations

SCF-SKP2 E3 ubiquitin ligase links mTORC1/ER stress/ISR with YAP activation in murine renal cystogenesis

Dibyendu K Panda et al. J Clin Invest. .

Abstract

The Hippo pathway nuclear effector Yes-associated protein (YAP) potentiates the progression of polycystic kidney disease (PKD) arising from ciliopathies. The mechanisms underlying the increase in YAP expression and transcriptional activity in PKD remain obscure. We observed that in kidneys from mice with juvenile cystic kidney (jck) ciliopathy, the aberrant hyperactivity of mechanistic target of rapamycin complex 1 (mTORC1), driven by ERK1/2 and PI3K/AKT cascades, induced ER proteotoxic stress. To reduce this stress by reprogramming translation, the protein kinase R-like ER kinase-eukaryotic initiation factor 2α (PERK/eIF2α) arm of the integrated stress response (ISR) was activated. PERK-mediated phosphorylation of eIF2α drove the selective translation of activating transcription factor 4 (ATF4), potentiating YAP expression. In parallel, YAP underwent K63-linked polyubiquitination by SCF S-phase kinase-associated protein 2 (SKP2) E3 ubiquitin ligase, a Hippo-independent, nonproteolytic ubiquitination that enhances YAP nuclear trafficking and transcriptional activity in cancer cells. Defective ISR cellular adaptation to ER stress in eIF2α phosphorylation-deficient jck mice further augmented YAP-mediated transcriptional activity and renal cyst growth. Conversely, pharmacological tuning down of ER stress/ISR activity and SKP2 expression in jck mice by administration of tauroursodeoxycholic acid (TUDCA) or tolvaptan impeded these processes. Restoring ER homeostasis and/or interfering with the SKP2-YAP interaction represent potential therapeutic avenues for stemming the progression of renal cystogenesis.

Keywords: Chronic kidney disease; Nephrology.


Conflict of interest statement

Conflict of interest: The authors have declared that no conflict of interest exists.

Figures

Figure 1
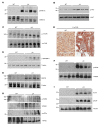
Figure 1. Aberrant mTOR activity, ER stress, and ISR in jck kidneys.
Representative expression of (A) p-ERK1/2, t-ERK1/2, and (B) p-AKT and t-AKT in jck kidneys relative to WT expression levels. (C) p-mTOR and t-mTOR levels in WT and jck kidneys. (D) IHC images of p-mTOR expression. Scale bars: 200 μm. (E) Levels of the p-mTOR downstream target proteins EIF4EBP1 and (F) RPS6. (G) Increased GRP78 expression, consistent with increased ER stress in jck kidneys. (H) Activation of the PERK arm of the ISR (p-PERK) and p-eIF2α levels in jck kidneys. (I) Increased ATF4 and CHOP expression in jck kidneys compared with WT expression.
Figure 2
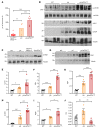
Figure 2. Increased YAP/TAZ expression in jck kidneys.
(A) p-YAP and t-YAP expression in WT and jck kidneys. (B) p-TAZ and t-TAZ expression by Western blotting in WT and jck kidneys. (C) YAP and (D) TAZ expression by IHC in WT and jck kidney sections. Scale bars: 50 μm. (E) Expression of YAP and TAZ target genes Cyr61 and Ctgf in jck kidneys compared with WT by quantitative real-time PCR and (F) by IHC. Data represent the mean ± SEM. *P < 0.05 and **P < 0.01, by unpaired Student’s t test.
Figure 3
Figure 3. ER stress potentiates cystogenesis in jck mice.
(A) Mice heterozygous for the SA-knockin mutation at the eIF2α phosphorylation site (eIF2α at S52A) were crossed onto the jck background. Mice of the 4 genotypes (WT, Nek8+/jck eIF2α+/SA, Nek8jck/jck eIF2α+/+ [jck], and Nek8jck/jck eIF2α+/SA) were generated as shown schematically. The expected percentages of offspring with the indicated genotypes are shown. (B) Ultrasonographic examination of renal cysts at 3 months of age (top panels). Shown are representative images of kidneys generated by 3D reconstruction (red images, lower panels) used to determine relative kidney volume. (C) Kidney volume relative to body weight (wt) measurements. (D) Individual cyst area measurements (mm2) in kidneys from mice of the corresponding genotypes, as determined from ultrasonographic 2D images (n = 3 mice from each group). (E) H&E-stained kidney sections from mice of the indicated genotypes. Original magnification, ×10. Data represent the mean ± SEM. ***P < 0.001 and ****P < 0.0001, by 1-way ANOVA followed by a Tukey-Kramer multiple-comparison test for differences between the groups (C) and unpaired Student’s t test for comparison of the 2 groups (D).
Figure 4
Figure 4. YAP transcriptional activity associates with renal cystogenesis.
(A) Urine output (microliters of urine over 4 hours) by mice of the indicated genotypes. (B) Representative expression levels of p-mTOR and t-mTOR, ATF4, and CHOP in the kidneys of mice of the indicated genotypes (n = 4 mice for each genotype). (C) CYR61 and (D) MYC protein levels in kidneys from mice of the corresponding genotypes, as indicators of YAP target gene transcriptional activity (n = 2 and 4, mice respectively, for each of the indicated genotypes). mRNA expression of the YAP target genes (E) Cyr61, (F) Myc, (G) Ctgf, (H) Ankrd1, and (I) Nppb by quantitative real-time PCR relative to Actb in kidney extracts from mice of the indicated genotypes (n = 4 mice for each genotype). Data are representative of 2 independent experiments. (J) Taz mRNA expression in kidneys from mice of the indicated genotypes. Data represent the mean ± SEM. *P < 0.05, **P < 0.01, and ***P < 0.001, by 1-way ANOVA followed by a Tukey-Kramer multiple-comparison test.
Figure 5
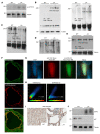
Figure 5. YAP K63-linked polyubiquitination and nuclear colocalization.
(A) p-LATS1/2 expression in WT and jck kidney extracts. (B) t-YAP levels in kidney samples immunoprecipitated using a YAP antibody followed by immunoblotting with a K63-linked polyubiquitin-specific antibody (left panel). t–K63-Ub in kidney samples was immunoprecipitated using a K63-linked, polyubiquitin-specific antibody followed by immunoblotting with a YAP-specific antibody (right panel). (C) t-YAP in kidney samples was immunoprecipitated using a YAP antibody followed by immunoblotting with a K48-linked, polyubiquitin-specific antibody. (D) t-TAZ was immunoprecipitated using a TAZ antibody followed by immunoblotting with a K63-linked, polyubiquitin-specific antibody. (E) t-TAZ in kidney samples was immunoprecipitated using an antibody against TAZ followed by immunoblotting with a K48-linked, polyubiquitin-specific antibody. Results from 2 different kidney samples from mice of each of the 2 genotypes are shown. (F) Representative immunofluorescence micrographs of jck kidney sections showing K63-Ub and YAP colocalization in the nucleus. Upper panel: Immunostaining with a Ub-K63-FITC–specific antibody (green); middle panel: immunostaining with a YAP-specific rhodamine antibody (red); bottom panel: merged image of Ub-K63-FITC with YAP-rhodamine. Original magnification, ×20. (G and H) Laser-scanning confocal fluorescence microscopy of jck kidney sections using DAPI, anti-YAP Alexa Fluor 594, and anti–K63-Ub Alexa Fluor 488. The Pearson’s correlation coefficient (r) values, a measure of the strength of the linear relationship between 2 variables, YAP and K63-Ub in the left panel (r = 0.939) and DAPI and K63-Ub in the right panel (r = 0.895), are indicated. (I) Immunohistochemical localization of K63-linkage–specific ubiquitinated proteins in kidney sections. Scale bars: 50 μm. (J) SKP2 and p27 expression in WT and jck kidneys.
Figure 6
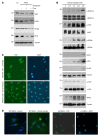
Figure 6. Deciliation induces ER stress, ATF4 and SKP2 expression, and YAP nuclear localization.
(A) YAP, CDK1, PCNA, and MYC expression in MDCKII cells cultured either in a tissue culture (TC) dish or in a parallel-plate flow chamber (PPFC) unexposed or exposed to steady unidirectional laminar fluid shear stress (3 dyn/cm2) in the presence or absence of the dampener. (B) p-ERK1/2, t-ERK1/2, p-AKT/t-AKT, p-RPS6/t-RPS6, CDK1, ATF4, CHOP, p-YAP, t-YAP, and SKP2 expression levels following treatment of MDCKII cells with increasing concentrations of chloral hydrate to induce deciliation. (C) YAP immunofluorescence micrographs of MDCKII cells with or without chloral hydrate treatment (4 mM). DAPI fluorescence demarcates the nuclei. Original magnification, ×20. (D) YAP immunofluorescence in WT MEFs before and after chloral hydrate treatment (left panels) and in jck MEFs (right panels). Original magnification, ×20.
Figure 7
Figure 7. TUDCA and tolvaptan alleviate ER stress and slow renal cyst growth in jck kidneys.
(A) In vivo ultrasonography of kidneys from WT and jck mice fed regular chow or chow containing TUDCA or tolvaptan. Yellow arrows indicate cysts. Shown in red are representative images of kidneys generated by 3D reconstruction used to determine the relative kidney volume. (B) Kidney volume/body weight ratio for WT, jck, and jck mouse treatment groups. (C) Average cyst area in mm2 in kidneys from mice in the control and 2 treatment groups. Cyst content was assessed from 2D images at the level where the renal artery could be identified. (D) Representative gross morphology of kidneys (arrows) procured from mice of each group at 3 months of age. (E) Serum urea nitrogen levels. (F) Urine osmolality following a 4-hour fast with access only to water. Each symbol represents an individual animal. Data represent the mean ± SEM. *P < 0.05, **P < 0.01, and ***P < 0.001, by 1-way ANOVA, followed by a Tukey-Kramer multiple-comparison test.
Figure 8
Figure 8. SKP2 plays a central role in renal cystogenesis.
(A) Representative H&E, Picrosirius red (dark red indicating collagen), and trichrome (blue indicates fibrosis) staining and YAP and SKP2 immunostaining in kidney sections from mice in the control and treatment groups. (B) Higher magnification of SKP2 immunostaining in WT and jck kidneys demonstrating its differential subcellular distribution. Scale bars: 50 μm (A) and 100 μm (B). (C) Representative Western immunoblots for p-eIF2α/t-eIF2α. (D) Graphic representation of the quantified p-eIF2α/t-eIF2α ratio derived from Western blots using 4 kidney samples from mice in each of the groups. (E) Representative Western blot for p-YAP/t-YAP expression in kidneys from mice in the control and treatment groups. (F) Graphic representation of Ctgf expression using quantitative real-time PCR in the 4 kidney samples examined for each group using Actb as an internal control. (G) Representative Western blot analysis for SKP2, p27, PCNA, and MYC in kidneys from mice in each of the groups. (H) p27 and (I) p-YAP/t-YAP levels as determined by Western blotting in 2 representative kidneys from jck mice treated with vehicle or the SKP2 inhibitor SKPin C1. Each symbol in the graphs represents an individual animal. Data represent the mean ± SEM. *P < 0.05, **P < 0.01, and ***P < 0.001, by 1-way ANOVA followed by a Tukey-Kramer multiple-comparison test.
Figure 9
Figure 9. YAP and SKP2 expression in kidneys following Pkd1 deletion.
(A) YAP immunostaining in kidney sections from Cre (control) and Cre+ EO and LO Pkd1cond Pax8 Tet-On mice. Scale bars: 100 μm. (B) p-mTOR, t-mTOR, YAP, CYR61, and SKP2 expression in kidney tissue extracts from Cre and Cre+ EO mice. (C) Schematic representation of the mechanistic pathways proposed to contribute to YAP-mediated renal cystogenesis and its progression. Lines represent direct/indirect activation (arrowhead) or inactivation (blunt end). The various drugs used for this study are indicated in red. Additional details are found in the body of the manuscript.

References

    1. Fry AM, et al. The primary cilium: guardian of organ development and homeostasis. Organogenesis. 2014;10(1):62–68. doi: 10.4161/org.28910. - DOI - PMC - PubMed
    1. Praetorius HA, Spring KR. Removal of the MDCK cell primary cilium abolishes flow sensing. J Membr Biol. 2003;191(1):69–76. doi: 10.1007/s00232-002-1042-4. - DOI - PubMed
    1. Devlin LA, Sayer JA. Renal ciliopathies. Curr Opin Genet Dev. 2019;56:49–60. doi: 10.1016/j.gde.2019.07.005. - DOI - PubMed
    1. Hughes J, et al. The polycystic kidney disease 1 (PKD1) gene encodes a novel protein with multiple cell recognition domains. Nat Genet. 1995;10(2):151–160. doi: 10.1038/ng0695-151. - DOI - PubMed
    1. Mochizuki T, et al. PKD2, a gene for polycystic kidney disease that encodes an integral membrane protein. Science. 1996;272(5266):1339–1342. doi: 10.1126/science.272.5266.1339. - DOI - PubMed

Publication types

MeSH terms

Substances