. 2023 Sep;17(3):609-626.
doi: 10.1007/s12079-022-00692-0. Epub 2022 Nov 3.

Quinacrine and Curcumin in combination decreased the breast cancer angiogenesis by modulating ABCG2 via VEGF A

Affiliations

Quinacrine and Curcumin in combination decreased the breast cancer angiogenesis by modulating ABCG2 via VEGF A

Deepika Nayak et al. J Cell Commun Signal. 2023 Sep.

Abstract

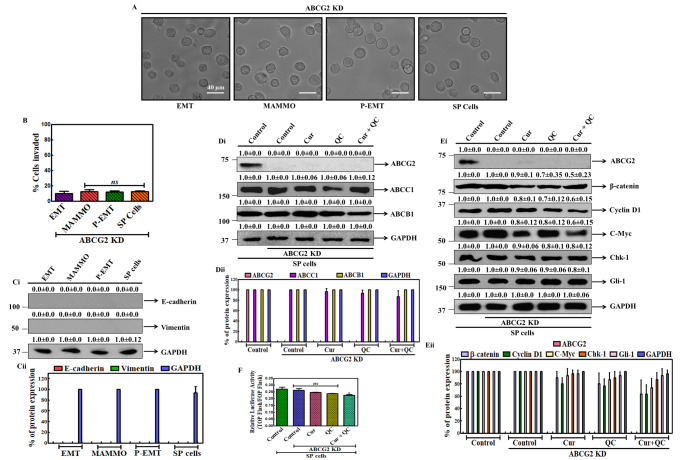
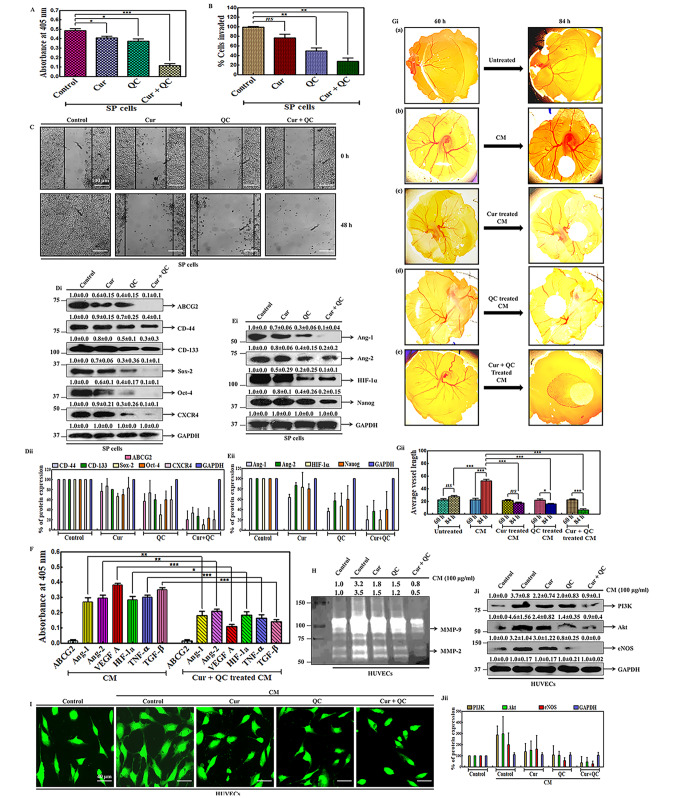
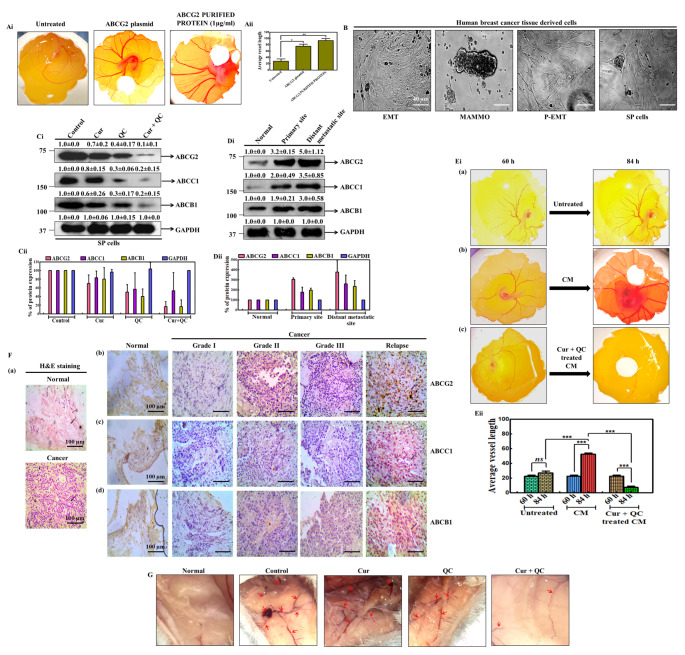
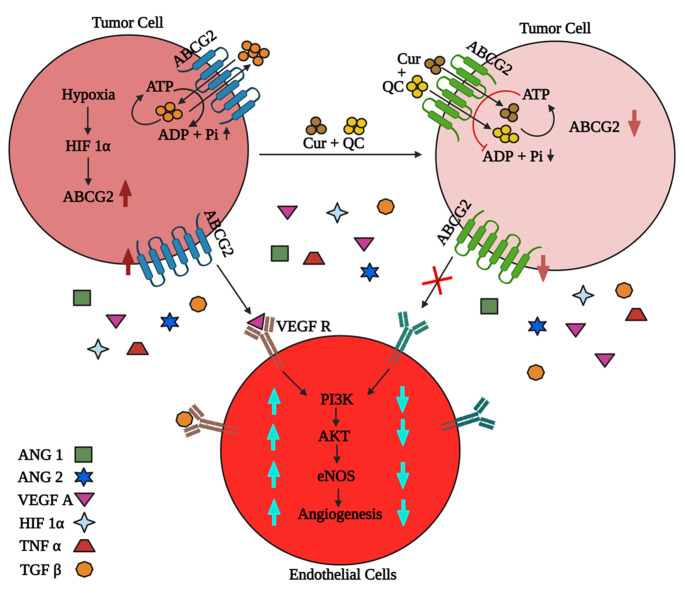
Cancer stem cells (CSCs) cause drug resistance in cancer due to its extensive drug efflux, DNA repair and self-renewal capability. ATP binding cassette subfamily G member 2 (ABCG2) efflux pump afford protection to CSCs in tumors, shielding them from the adverse effects of chemotherapy. Although the role of ABCG2 in cancer progression, invasiveness, recurrence are known but its role in metastasis and angiogenesis are not clear. Here, using in vitro (CSCs enriched side population [SP] cells), ex vivo (patient derived primary cells), in ovo (fertilized egg embryo) and in vivo (patient derived primary tissue mediated xenograft (PDX)) system, we have systematically studied the role of ABCG2 in angiogenesis and the regulation of the process by Curcumin (Cur) and Quinacrine (QC). Cur + QC inhibited the proliferation, invasion, migration and expression of representative markers of metastasis and angiogenesis. Following hypoxia, ABCG2 enriched cells released angiogenic factor vascular endothelial growth factor A (VEGF A) and induced the angiogenesis via PI3K-Akt-eNOS cascade. Cur + QC inhibited the ABCG2 expression and thus reduced the angiogenesis. Interestingly, overexpression of ABCG2 in SP cells and incubation of purified ABCG2 protein in media induced the angiogenesis but knockdown of ABCG2 decreased the vascularization. In agreement with in vitro results, ex vivo data showed similar phenomena. An induction of vascularization was noticed in PDX mice but reduction of vascularization was also observed after treatment of Cur + QC. Thus, data suggested that in hypoxia, ABCG2 enhances the production of angiogenesis factor VEGF A which in turn induced angiogenesis and Cur + QC inhibited the process by inhibiting ABCG2 in breast cancer.

Keywords: ABCG2; Angiogenesis; Cancer stem cells; Curcumin; HUVECs; Quinacrine.


Conflict of interest statement

The authors have no competing financial and/or non-financial interests.

Figures

Fig. 1
Fig. 1
Establishment of breast cancer metastasis model and SP cells using MCF-10A-Tr cells. A Morphology of cells at different stages of metastasis. B Matrigel invasion assay in mBCSCs. Ci Expression of E-cadherin and Vimentin in mBCSCs. GAPDH served as the loading control. The numerical value above each blot indicated the relative fold change in comparison to control analyzed by densitometry. Fig. Cii is the graphical representation of fig. Ci. Di Expression of ABC transporter proteins after the treatment of Cur and QC individually and in combination in SP cells. GAPDH served as loading control. The numerical value above each blot indicated the relative fold change in comparison to control analyzed by densitometry. Fig. Dii is the graphical representation of fig. Di. Ei Expression of WNT/β-catenin signaling proteins in SP cells after the treatment of Cur and QC alone and in combination. GAPDH served as loading control. The numerical value above each blot indicated the relative fold change in comparison to control analyzed by densitometry. Fig. Eii is the graphical representation of fig. Ei. F Relative luciferase activity of WNT transcription factor TCF/LEF after the exposure of Cur and QC individually and in combination in SP cells. All the experiments were conducted thrice and representative data were given. Statistical significance was determined by one-way ANOVA where ‘***’, ‘**’, ‘*’ represent statistical significance (P < 0.0001, P < 0.001 and P < 0.05 respectively)
Fig. 2
Fig. 2
Development of breast cancer metastasis model using ABCG2 knockdown MCF-10A-Tr and SP cells. A Morphology of different stages of metastasis in ABCG2 knockdown cells. B Invasive potentiality of ABCG2-silenced metastasis cells. Ci Expressions of representative metastasis protein markers in ABCG2 silenced SP cells. GAPDH served as the loading control. The numerical value above each blot indicated the relative fold change in comparison to control analyzed by densitometry. Fig. Cii is the graphical representation of fig. Ci. Di Expression of ABC transporter proteins after the treatment of Cur and QC individually and in combination in ABCG2 knockdown SP cells. GAPDH served as loading control. The numerical value above each blot represented the relative fold change in comparison to control analyzed by densitometry. Fig. Dii is the graphical representation of fig. Di. Ei Expression of WNT/β-catenin signaling proteins in Cur + QC treated ABCG2 knockdown SP cells. GAPDH served as loading control. The numerical value above each blot represented the relative fold change in comparison to control analyzed by densitometry. Fig. Eii is the graphical representation of fig. Ei. F Relative luciferase activity of WNT transcription factor TCF/LEF after the exposure of Cur and QC alone and in combination in ABCG2 knockdown SP cells. Data was the mean ± SD of three independent experiments. Statistical significance was determined by one-way ANOVA where ‘*’ represents statistical significance (P < 0.05) and ‘ns’ represents statistical non-significance (P > 0.05)
Fig. 3
Fig. 3
Cur and QC modulates the ABCG2 mediated metastasis and angiogenesis in SP cells A Expression of proliferation marker Ki67 in whole cell lysates of SP cells. B Invasive capacities of the cells after drug treatment. C Anchorage-dependent cell migration of SP cells after drug treatment. Di Expression of representative metastatic markers in SP cells after the exposure of Cur and QC individually and in combination . GAPDH served as loading control. The numerical value above each blot indicated the relative fold change in comparison to control analyzed by densitometry. Fig. Dii is the graphical representation of fig. Di. Ei Expression of representative angiogenic markers in treated SP cells. GAPDH served as loading control. The numerical value above each blot represented the relative fold change in comparison to control analyzed by densitometry. Fig. Eii is the graphical representation of fig. Ei. F Expression of the representative soluble angiogenic markers in CM of SP cells after Cur and QC treatment measured by ELISA. Gi CAM assay showing the effect of CM from ABCG2 enriched SP cells in inducing new blood vessel formation and reducing new blood vessel formation in ABCG2 enriched SP cells treated with Cur and QC alone and in combination in ovo. Fig. Gii is the graphical representation of fig. Gi using angiotool64 0.6a Software. H Expression of MMP-9 and MMP-2 in HUVECs supplemented with CM of SP cells after treatment with Cur and QC. I In vitro tubule formation of HUVECs supplemented with CM of SP cells after the treatment of drugs. Ji Expression of PI3K, Akt and eNOS in whole cell lysates of HUVECs supplemented with CM of SP cells. GAPDH served as loading control. The numerical value above each blot indicated the relative fold change in comparison to control analyzed by densitometry. Fig. Jii is the graphical representation of fig. Ji. All the experiments were conducted thrice and representative data were given. Statistical significance was determined by one-way ANOVA where ‘***’, ‘**’, ‘*’ represent statistical significance (P < 0.0001, P < 0.001 and P < 0.05 respectively) and ‘ns’ represents statistical non-significance (P > 0.05)
Fig. 4
Fig. 4
Cur + QC treatment did not alter metastasis and angiogenesis in ABCG2 knock down SP cells. A Expression of proliferation marker Ki67 in whole cell lysates of ABCG2 knock down SP cells. B Matrigel invasion assay in ABCG2 knockdown SP cells after drug treatment. C Anchorage-dependent cell migration of ABCG2 knockdown SP cells after drug treatment. Di Expression of some representative metastatic markers after the treatment of Cur and QC individually and in combination in ABCG2 knockdown SP cells. GAPDH served as loading control. The numerical value above each blot indicated the relative fold change in comparison to control analyzed by densitometry. Fig. Dii is the graphical representation of fig. Di. Ei Expression of some angiogenic markers in treated ABCG2 knockdown SP cells. GAPDH served as loading control. The numerical value above each blot represented the relative fold change in comparison to control analyzed by densitometry. Fig. Eii is the graphical representation of fig. Ei. F Expression of some angiogenic markers in CM from ABCG2 knockdown SP cells and same CM treated with Cur and QC alone and in combination measured by ELISA. Gi CAM assay showing the effects of CM from ABCG2 knockdown SP cells treated with Cur and QC alone and in combination in ovo. Fig. Gii is the graphical representation of fig. Gi using angiotool64 0.6a Software. H Expression of MMP-9 and MMP-2 in HUVECs supplemented with CM of ABCG2 knockdown SP cells after treatment with Cur and QC individually and in combination. I In vitro tubule formation of HUVECs incubated with CM from ABCG2 silenced SP cells after the treatment with desired drugs. Ji Expression of PI3K, Akt and eNOS in whole cell lysates of HUVECs supplemented with the CM of ABCG2 knockdown SP cells. GAPDH served as loading control. The numerical value above each blot indicated the relative fold change in comparison to control analyzed by densitometry. Fig. Jii is the graphical representation of fig. Ji. All the experiments were conducted thrice and representative data were given. Statistical significance was determined by one-way ANOVA where ‘***’, ‘**’, ‘*’ represent statistical significance (P < 0.0001, P < 0.001 and P < 0.05 respectively) and ‘ns’ represents statistical non-significance (P > 0.05)
Fig. 5
Fig. 5
Cur and QC disrupts the angiogenesis in patient derived samples. Ai CAM assay showing the effects of pSIN4-EF2-ABCG2-IRES-Neo plasmid and purified ABCG2 protein in inducing new blood vessel formation in ovo. Aii Graphical representation of CAM assay of fig. Ai. B Morphology of human breast cancer tissue derived cells at different stages of metastasis. Ci Western blot analysis of MDR proteins in the lysate of cultured human breast cancer tissue derived cells after the treatment of Cur and QC alone and in combination. GAPDH served as the loading control. The numerical value above each blot indicated the relative fold change in comparison to control analyzed by densitometry. Fig. Cii is the graphical representation of fig. Ci. Di Expression of representative MDR markers in different primary and distant sites. GAPDH served as the loading control. The numerical value above each blot represented the relative fold change in comparison to control analyzed by densitometry. Fig. Dii is the graphical representation of fig. Di. Ei CAM assay showing new blood vessel formation in eggs after induction of CM from cultured tumor tissue derived SP cells. Eii Graphical representation of in ovo blood vessel formation from fig. Ei at three different microscopic fields using angiotool64 0.6a Software. F Expression of ABCG2, ABCC1 and ABCB1 in primary breast cancer tissue sample a histopathology of H&E staining of human breast samples. Rows b–d show the expression of ABCG2, ABCC1 and ABCB1 by IHC analysis in different stages of sample. The images were taken by bright-field microscopy at 20x magnification. Scale bar represents 20μm. Images are representative of three independent experiments. G Decrease in In vivo blood vessel formation in female Balb/C mice after the treatment of Cur and QC individually and in combination. Photographs are representative of three independent experiments. All the experiments were conducted thrice and representative data were given. Statistical significance was determined by one-way ANOVA where ‘***’, ‘**’, ‘*’ represent statistical significance (P < 0.0001, P < 0.001 and P < 0.05 respectively) and ‘ns’ represents statistical non-significance (P > 0.05)
Fig. 6
Fig. 6
Schematic representation of ABCG2 induced angiogenesis. VEGF A from ABCG2 enriched SP cells interacts with VEGF R and activates tumor induced angiogenesis via PI3K, Akt and eNOS

References

    1. Abhinand CS, Athira PA, Soumya SJ, Sudhakaran PR. Multiple targets directed multiple ligands: An in silico and in vitro approach to evaluating the effect of triphala on angiogenesis. Biomolecules. 2020;10:177. doi: 10.3390/biom10020177. - DOI - PMC - PubMed
    1. Cao B, Jia J, Ma L, et al. Recombinant human endostatin could eliminate the pro-angiogenesis priority of SP cells sorted from non-small cell lung cancer cells. Clin Transl Oncol. 2012;14:575–585. doi: 10.1007/s12094-012-0844-9. - DOI - PubMed
    1. Chatterjee S, Sinha S, Molla S, et al. PARP inhibitor Veliparib (ABT-888) enhances the anti-angiogenic potentiality of Curcumin through deregulation of NECTIN-4 in oral cancer: Role of nitric oxide (NO) Cell Signal. 2021;80:109902. doi: 10.1016/j.cellsig.2020.109902. - DOI - PubMed
    1. Chen Z, Liu F, Ren Q, et al. Suppression of ABCG2 inhibits cancer cell proliferation. Int J Cancer. 2010;126:841–851. - PubMed
    1. Chikazawa N, Tanaka H, Tasaka T, et al. Inhibition of Wnt signaling pathway decreases chemotherapy-resistant side-population colon cancer cells. Anticancer Res. 2010;30:2041–2048. - PubMed