. 2023 Feb;12(1):129-144.
doi: 10.1007/s40120-022-00412-1. Epub 2022 Nov 3.

Brain Complexity Predicts Response to Adrenocorticotropic Hormone in Infantile Epileptic Spasms Syndrome: A Retrospective Study

Affiliations

Brain Complexity Predicts Response to Adrenocorticotropic Hormone in Infantile Epileptic Spasms Syndrome: A Retrospective Study

Chu-Ting Zhang et al. Neurol Ther. 2023 Feb.

Abstract

Introduction: Infantile epileptic spasms syndrome (IESS) is an age-specific and severe epileptic encephalopathy. Although adrenocorticotropic hormone (ACTH) is currently considered the preferred first-line treatment, it is not always effective and may cause side effects. Therefore, seeking a reliable biomarker to predict the treatment response could benefit clinicians in modifying treatment options.

Methods: In this study, the complexities of electroencephalogram (EEG) recordings from 15 control subjects and 40 patients with IESS before and after ACTH therapy were retrospectively reviewed using multiscale entropy (MSE). These 40 patients were divided into responders and nonresponders according to their responses to ACTH.

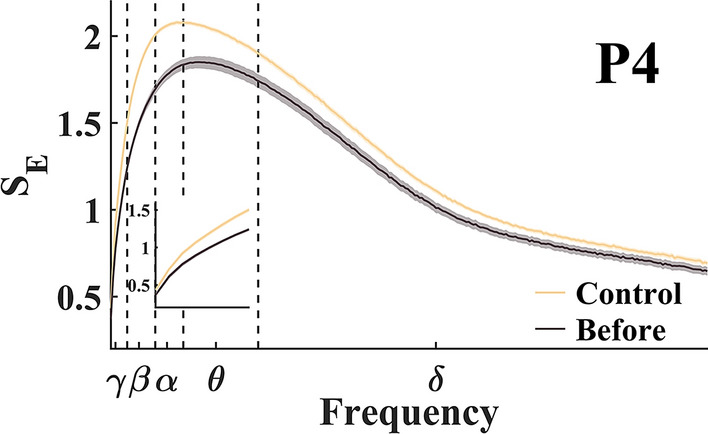
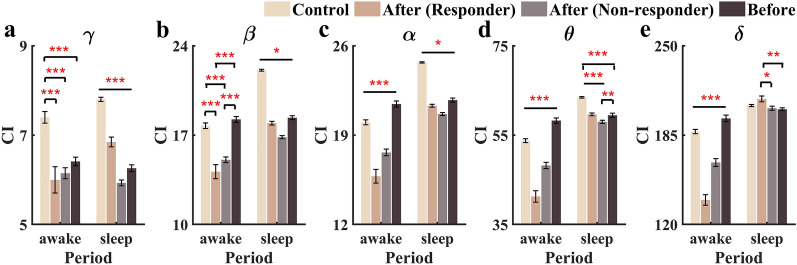
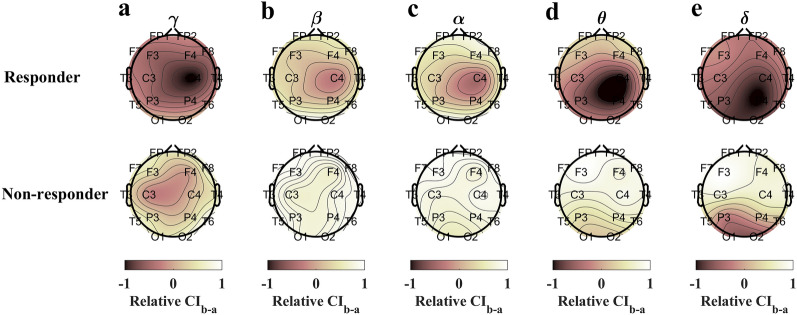
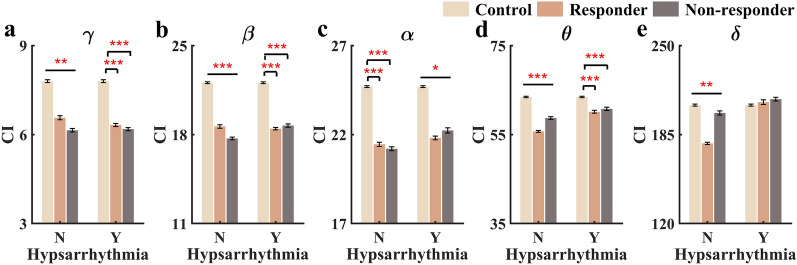
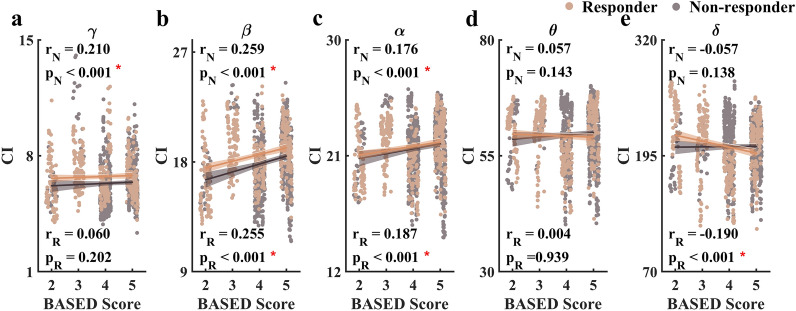
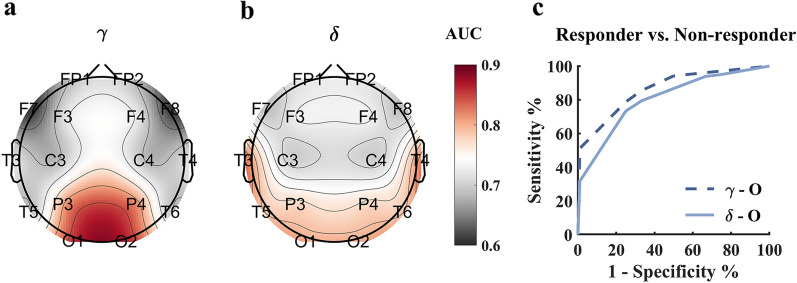
Results: The EEG complexities of the patients with IESS were significantly lower than those of the healthy controls. A favorable response to treatment showed increasing complexity in the γ band but exhibited a reduction in the β/α-frequency band, and again significantly elevated in the δ band, wherein the latter was prominent in the parieto-occipital regions in particular. Greater reduction in complexity was significantly linked with poorer prognosis in general. Occipital EEG complexities in the γ band revealed optimized performance in recognizing response to the treatment, corresponding to the area under the receiver operating characteristic curves as 0.8621, while complexities of the δ band served as a fair predictor of unfavorable outcomes globally.

Conclusion: We suggest that optimizing frequency-specific complexities over critical brain regions may be a promising strategy to facilitate predicting treatment response in IESS.

Keywords: BASED score; Infantile epileptic spasms syndrome; Multiscale entropy; Prediction; Response.


Figures

Fig. 1
Fig. 1
The averaged MSE curves. The beige line and brownish black line represent the controls and the patients with IESS without treatment during sleep, respectively. The darker traces and the shaded areas denote mean ± standard error
Fig. 2
Fig. 2
Comparisons of responses to ACTH using complexity indexes (CIs). Bar plots show the CIs of control, responder to ACTH after treatment, nonresponder to ACTH after treatment, and patients before treatment across a γ, b β, c α, d θ, and e δ bands. All comparisons are grouped by period (awake and sleep). *, **, and *** represent p value < 0.05, 0.01, and 0.001, respectively. The lines over the bars represent pairwise significant differences between groups, while the brackets indicate significant differences only between groups to which the brackets refer
Fig. 3
Fig. 3
Relative change of complexity indexes (relative CIba) during treatment. The relative CIsba are normalized by the maximum absolute difference for the responders and nonresponders, respectively. Topoplots highlight the relative change across a γ, b β, c α, d θ, and e δ bands for the responders and nonresponders. Warmer/cooler colors indicate a greater reduction/increase during treatment
Fig. 4
Fig. 4
Comparisons of responses to ACTH using complexity indexes (CIs) by the presence/absence of hypsarrhythmia. Bar plots show CIs of control, responder to ACTH before treatment, and nonresponder to ACTH before treatment across a γ, b β, c α, d θ, and e δ bands. All comparisons are grouped by the presence/absence of hypsarrhythmia. *, **, and *** represent p value < 0.05, 0.01, and 0.001, respectively. N and Y denote absence and presence of hypsarrhythmia, respectively. The lines over the bars represent pairwise significant differences between groups, while the brackets indicate significant differences only between groups to which the brackets refer
Fig. 5
Fig. 5
Correlations between complexity indexes and BASED scores. Scatter plots depict CIs significantly correlating with the BASED scores across a γ, b β, c α, and e δ, but not d θ bands. * represents p value < 0.001
Fig. 6
Fig. 6
Region-specific complexity predicts responses to ACTH. Brain maps illustrate the area under the curve (AUC) of the receiver operating characteristic (ROC) curve of CIs before treatment in predicting responses to ACTH across a γ and b δ bands. c ROC curve of candidate features in classifying responses to ACTH for IESS. Two sets of features including γ-O CI (dashed line) and δ-O CI (solid line) were applied

Similar articles

Cited by

References

    1. Zuberi SM, Wirrell E, Yozawitz E, et al. ILAE classification and definition of epilepsy syndromes with onset in neonates and infants: position statement by the ILAE Task Force on Nosology and Definitions. Epilepsia. 2022;63(6):1349–1397. doi: 10.1111/epi.17239. - DOI - PubMed
    1. Hrachovy RA, Frost JD., Jr Infantile epileptic encephalopathy with hypsarrhythmia (infantile spasms/West syndrome) J Clin Neurophysiol. 2003;20(6):408–425. doi: 10.1097/00004691-200311000-00004. - DOI - PubMed
    1. Grinspan ZM, Knupp KG, Patel AD, et al. Comparative effectiveness of initial treatment for infantile spasms in a contemporary US cohort. Neurology. 2021;97(12):e1217–e1228. doi: 10.1212/WNL.0000000000012511. - DOI - PMC - PubMed
    1. Knupp KG, Coryell J, Nickels KC, et al. Response to treatment in a prospective national infantile spasms cohort. Ann Neurol. 2016;79(3):475–484. doi: 10.1002/ana.24594. - DOI - PMC - PubMed
    1. Hussain SA, Kwong G, Millichap JJ, et al. Hypsarrhythmia assessment exhibits poor interrater reliability: a threat to clinical trial validity. Epilepsia. 2015;56(1):77–81. doi: 10.1111/epi.12861. - DOI - PubMed

LinkOut - more resources