Reliability of COVID-19 data: An evaluation and reflection
- PMID: 36327273
- PMCID: PMC9632841
- DOI: 10.1371/journal.pone.0251470
Reliability of COVID-19 data: An evaluation and reflection
Abstract
Importance: The rapid proliferation of COVID-19 has left governments scrambling, and several data aggregators are now assisting in the reporting of county cases and deaths. The different variables affecting reporting (e.g., time delays in reporting) necessitates a well-documented reliability study examining the data methods and discussion of possible causes of differences between aggregators.
Objective: To statistically evaluate the reliability of COVID-19 data across aggregators using case fatality rate (CFR) estimates and reliability statistics.
Design, setting, and participants: Cases and deaths were collected daily by volunteers via state and local health departments, as primary sources and newspaper reports, as secondary sources. In an effort to begin comparison for reliability statistical analysis, BroadStreet collected data from other COVID-19 aggregator sources, including USAFacts, Johns Hopkins University, New York Times, The COVID Tracking Project.
Main outcomes and measures: COVID-19 cases and death counts at the county and state levels.
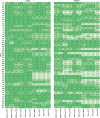
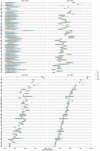
Results: Lower levels of inter-rater agreement were observed across aggregators associated with the number of deaths, which manifested itself in state level Bayesian estimates of COVID-19 fatality rates.
Conclusions and relevance: A national, publicly available data set is needed for current and future disease outbreaks and improved reliability in reporting.
Conflict of interest statement
The specific roles of these authors are articulated in the ‘author contributions’ section. This does not alter our adherence to PLOS ONE policies on sharing data and materials.
Figures


References
-
- Data Collection and Reporting | NNDSS [Internet]. [cited 2021 Mar 12]. https://wwwn.cdc.gov/nndss/data-collection.html.
-
- Killeen BD, Wu JY, Shah K, Zapaishchykova A, Nikutta P, Tamhane A, et al. A County-level Dataset for Informing the United States’ Response to COVID-19. ArXiv200400756 Phys Q-Bio [Internet]. 2020 Sep 10 [cited 2021 Mar 12]; http://arxiv.org/abs/2004.00756.
Publication types
MeSH terms
LinkOut - more resources
Full Text Sources
Medical

