. 2022 Nov 15;3(11):100803.
doi: 10.1016/j.xcrm.2022.100803. Epub 2022 Nov 2.

Ancestral library identifies conserved reprogrammable liver motif on AAV capsid

Affiliations

Ancestral library identifies conserved reprogrammable liver motif on AAV capsid

Eric Zinn et al. Cell Rep Med. .

Abstract

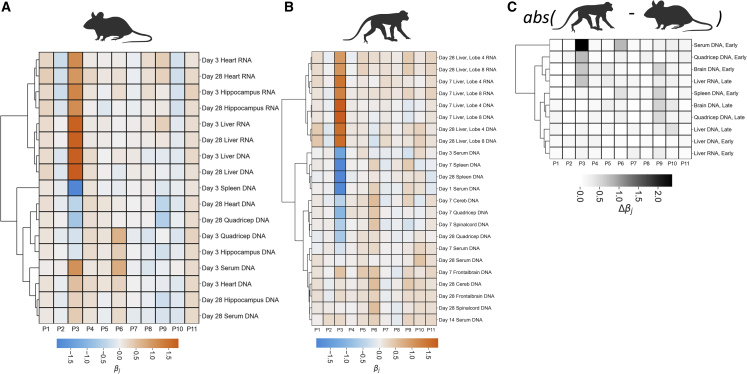
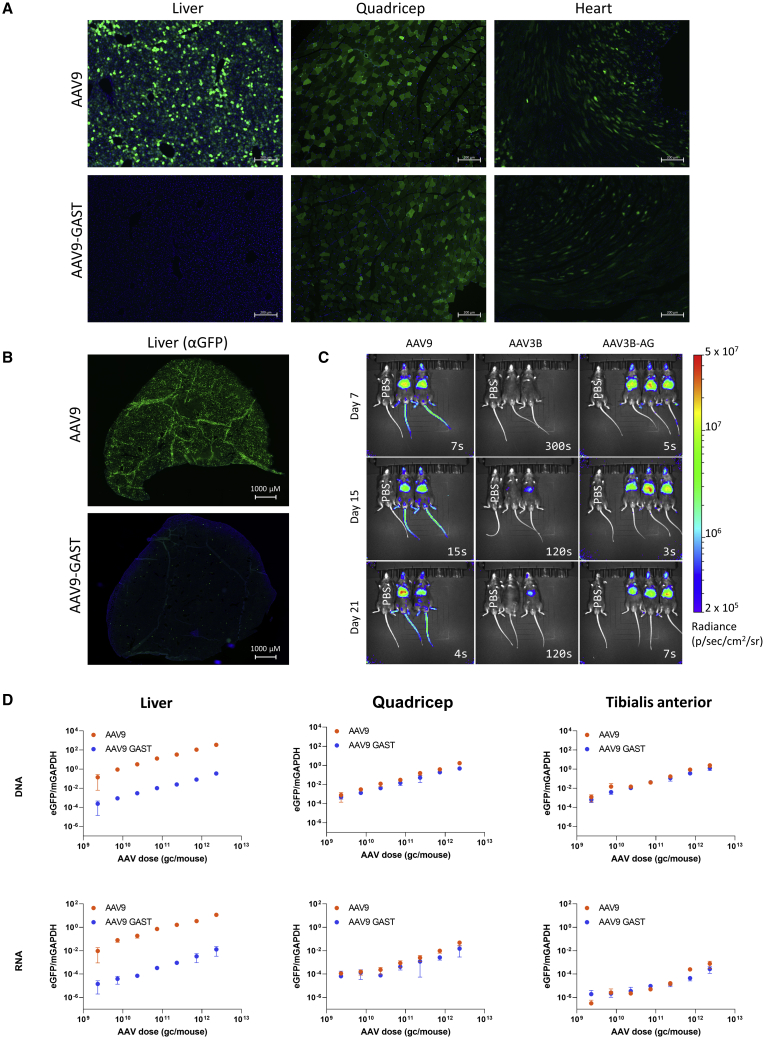
Gene therapy is emerging as a modality in 21st-century medicine. Adeno-associated viral (AAV) gene transfer is a leading technology to achieve efficient and durable expression of a therapeutic transgene. However, the structural complexity of the capsid has constrained efforts to engineer the particle toward improved clinical safety and efficacy. Here, we generate a curated library of barcoded AAVs with mutations across a variety of functionally relevant motifs. We then screen this library in vitro and in vivo in mice and nonhuman primates, enabling a broad, multiparametric assessment of every vector within the library. Among the results, we note a single residue that modulates liver transduction across all interrogated models while preserving transduction in heart and skeletal muscles. Moreover, we find that this mutation can be grafted into AAV9 and leads to profound liver detargeting while retaining muscle transduction-a finding potentially relevant to preventing hepatoxicities seen in clinical studies.

Keywords: AAV9; ASR; Anc80; adeno-associated virus; ancestral sequence reconstruction; capsid; gene therapy; hepatotoxicity; hepatotropism; library; liver toggle.


Conflict of interest statement

Declaration of interests L.H.V. holds equity in Affinia Therapeutics, Akouos, and ciendias bio. He serves on the Board of Directors of Affinia Therapeutics, Addgene, ciendias bio, and Odylia. L.H.V. is an employee of ciendias bio. L.H.V. and E.Z. are inventors of AncAAV technology licensed to Affinia, Akouos, and/or other biopharmaceutical companies from which they may receive royalties. L.H.V. is compensated for his scientific advisory position with Affinia and Akouos. L.H.V. is a SAB member to Akouos, consultant to Affinia and Novartis, and receives research support from Novartis. L.H.V.’s interests were reviewed and are managed by Mass Eye and Ear and Mass General Brigham in accordance with their conflict-of-interest policies. L.H.V., E.Z., C.U., P.F.S., C.T., and H.T.T. are inventors on patent applications relating to AAVSeq, CombiAAV, or the liver toggle technology contained in this publication. A.J.W. and L.H.V. are inventors on patents related to use of AAVs for therapeutic gene delivery in the muscle and other tissues.

Figures

None
Graphical abstract
Figure 1
Figure 1
Approach and substrate (A) Dendrogram depicting the evolutionary monophyletic origins of AAV vectors with high (orange) or low (blue) hepatotropism in mice. Anc80Lib refers to an AAV variant capsid library derived from ML-ASR. The percent identity to Anc80 (protein) is provided for each extant AAV. (B) Above, bar graph depicting locations of amino acid differences in the coding sequence of the capsid gene between Anc80 and AAV2. Below, schematic representation of the coding sequence of the resultant barcoded library. The gray rectangle represents the coding sequence of the capsid and the smaller rectangles (either orange or blue) depict the different states at positions of variability within the library (each a single codon). (C) Circos diagram highlighting structural features of the AAV capsid. The outer circle of the figure is divided into rectangles, each corresponding to an amino acid in the structure of AAV9 (PDB: 3UX1) and are numbered (VP1 numbering). Positions are shaded by the number of predicted quaternary interactions (darker meaning more interactions). Lines drawn between positions on the outer circle indicate predicted interactions. The next set of highlights (purple) correspond to amino acids determined to bind different monoclonal antibodies. The blue highlights identify amino acids involved in glycan binding. The green highlights identify amino acids involved in binding to AAVR. Glyphs identify interactions as being between the 2-fold (green circles), 3-fold (orange triangles), or 5-fold interfaces (blue stars). The inner radius depicts a histogram plotting sequence conservation (Shannon entropy), where green bars indicate high sequence diversity (entropy > 2.0), red bars indicate high conservation (entropy < 1.0), and orange bars indicate moderate diversity (entropy > 1.5). Blue wedges indicate positions of variability within the Anc80 library and are numbered (Anc80VP1/AAV9 VP1). Table S1 provides detailed information on each of the highlighted positions. Note that p1 and p2 (corresponding to positions 168 and 205 by Anc80 VP1 numbering) are not shown due to the lack of structures in the VP1/VP2 unique regions.
Figure 2
Figure 2
Library production and in vitro infectivity (A) A barcoded AAV vector library was produced either with (N = 5) or without (N = 3) addition of an exogenous assembly-activating protein (AAP). Individual dots in MA plots represent distinct barcodes, colors represent the amino acid identity at position 5. To the right of MA plots, eCDF plots with SEM depicted as horizontal error bars. (B) Results of an independent sites linear elastic net regularization approach show that addition of AAP modifies the impact of certain sites on production of vector. (C) Huh7 cells were transduced with the barcoded AAV library and DNA/RNA were isolated from those transduced cells (N = 5 per condition). Individual barcodes in MA plots are colored by identity at position 3 within the library. Extant barcoded vectors were also spiked into this transduction mixture. Fold change is plotted as bar graphs (error bars determined by bootstrapping, 1,000 replicates). (D) Regularization and linear modeling approach reveal potential similarities and differences among our positions of variation with respect to transduction and gene expression in vitro.
Figure 3
Figure 3
Variation within the Anc80Lib at a single position alters liver tropism of vectors in mice and NHPs (A) Pairwise comparisons of barcode isolation and counting from livers of three mice at day 3 (N = 8) as DNA (top) or RNA (bottom). (B) MA plots depicting the fold change of vectors (tissue/vector) colored by amino acid identity at position 3 within our library. (C) Vectors were sorted by fold-change (top to bottom, positive to negative) and colored by their states at every position (in “fingerprint plots”). (D) Following administration into NHPs, barcodes are isolated from DNA (top) and RNA (bottom) at day 28 with varying reproducibility (Spearman’s ρ = 0.94 and 0.73 respectively, N = 2 NHPs). (E) MA plots from NHP data depicting differences among vectors with A/G at position 3. (F) Fingerprint plots from NHP liver DNA and RNA at day 28.
Figure 4
Figure 4
Pharmacokinetic profiling of barcoded viruses Barcodes were purified from the DNA of liver, spleen, quadriceps, and serum from either mice (top row, N = 8) or NHPs (bottom row, N = 2) at an early time point (day 3 for mice, day 7 for NHPs, except for serum which is day 3). To illustrate the relationships between these vectors, MA plots were rendered each highlighting the previously identified “liver” toggle and depicted next to a fingerprint plot for each tissue.
Figure 5
Figure 5
Summary of in vivo tissue tropism studies (A) Average log2 fold-changes were computed for every RNA/DNA/tissue combination at every time point from the study detailed in Figure S6 (mice N = 8, NHPs N = 2). Data were centered by means subtraction and an independent sites linear model was fit by elastic net regularization to determine the impact of variation at each site within the library on enrichment in each sample. Samples were then clustered by Ward’s method according to the fit coefficients. (B) The same approach as described in (A) was applied to samples isolated from NHPs. (C) To compare between species, regularization coefficients were subtracted (cynomolgus macaque – mouse) from one another. The absolute value of the differences were clustered and plotted as in (A and B).
Figure 6
Figure 6
Clonal confirmation of p3 liver toggle and reprogramming of AAV9 with respect to tissue tropism (A) Anc80L1533 (p3 = G, Liver On) and Anc80L0193 (p3 = A, Liver Off) were identified from Anc80Lib AAVSeq based on their performance, individually produced with a GFP reporter transgene, and vectors were administered intravenously into five mice per clonal vector. Relative transgene (eGFP) DNA (top) and RNA (bottom) were determined by ddPCR and qRT-PCR, respectively, and represented in box-and-whisker plots for liver (left), quadriceps (middle), and heart (right). After testing for normality and equal variances, significance was determined by an ANOVA followed by a post-hoc test (Tukey’s HSD) (n.s., 0.05 < p < 1, ∗0.01 < p < 0.05, ∗∗0.001 < p < 0.01, ∗∗∗0.0001 < p < 0.001). (B) Mutations were introduced into AAV9 to confer the observed liver-detargeted phenotype observed in the library and confirmed clonally as in (A). Transgene expression was measured by qRT-PCR, represented, and analyzed statistically as in (A).
Figure 7
Figure 7
In vivo transduction of reprogrammed AAVs (A) Mice were injected with either AAV9 or AAV9-GAST containing a self-complementary eGFP transgene (dose of 1.87 × 1011 gc/mouse). Tissues were isolated, preserved, sectioned, and imaged. Scale bars, 200 μm. (B) Whole mouse livers following injection with a self-complementary eGFP transgene in either AAV9 or AAV9-GAST (dose of 2.65 × 1011 gc/mouse). (C) IVIS Imaging of mice injected with AAV9, AAV3B, or AAV3B-GA packaging a firefly luciferase transgene. PBS-injected mice are included as negative controls in each image (and labeled accordingly). Optimal exposure time determined by the instrument in the bottom right of each image. (D) Increasing doses of either AAV9 (teal) or AAV9-GAST (purple) packing an eGFP transgene under a CB7 promoter were injected into C57BL6 Mice (N = 3 per dose). DNA and RNA were isolated from livers, quadriceps, or tibialis anterior (TA) from each mouse and were quantified by ddPCR. Mean values ± SEM are represented.

References

    1. Li C., Samulski R.J. Engineering adeno-associated virus vectors for gene therapy. Nat. Rev. Genet. 2020;21:255–272. doi: 10.1038/s41576-019-0205-4. - DOI - PubMed
    1. Keeler A.M., Flotte T.R. Recombinant adeno-associated virus gene therapy in light of luxturna (and zolgensma and glybera): where are we, and how did we get here? Annu. Rev. Virol. 2019;6:601–621. doi: 10.1146/annurev-virology-092818-015530. - DOI - PMC - PubMed
    1. Hudry E., Vandenberghe L.H. Therapeutic AAV gene transfer to the nervous system: a clinical reality. Neuron. 2019;101:839–862. doi: 10.1016/j.neuron.2019.02.017. - DOI - PMC - PubMed
    1. Mendell J.R., Al-Zaidy S.A., Rodino-Klapac L.R., Goodspeed K., Gray S.J., Kay C.N., Boye S.L., Boye S.E., George L.A., Salabarria S., et al. Current clinical applications of in vivo gene therapy with AAVs. Mol. Ther. 2021;29:464–488. doi: 10.1016/j.ymthe.2020.12.007. - DOI - PMC - PubMed
    1. Manno C.S., Pierce G.F., Arruda V.R., Glader B., Ragni M., Rasko J.J., Rasko J., Ozelo M.C., Hoots K., Blatt P., et al. Successful transduction of liver in hemophilia by AAV-Factor IX and limitations imposed by the host immune response. Nat. Med. 2006;12:342–347. doi: 10.1038/nm1358. - DOI - PubMed

Publication types

Substances