

Global estimates and determinants of antituberculosis drug pharmacokinetics in children and adolescents: a systematic review and individual patient data meta-analysis
- PMID: 36328357
- PMCID: PMC9996834
- DOI: 10.1183/13993003.01596-2022
Global estimates and determinants of antituberculosis drug pharmacokinetics in children and adolescents: a systematic review and individual patient data meta-analysis
Abstract
Background: Suboptimal exposure to antituberculosis (anti-TB) drugs has been associated with unfavourable treatment outcomes. We aimed to investigate estimates and determinants of first-line anti-TB drug pharmacokinetics in children and adolescents at a global level.
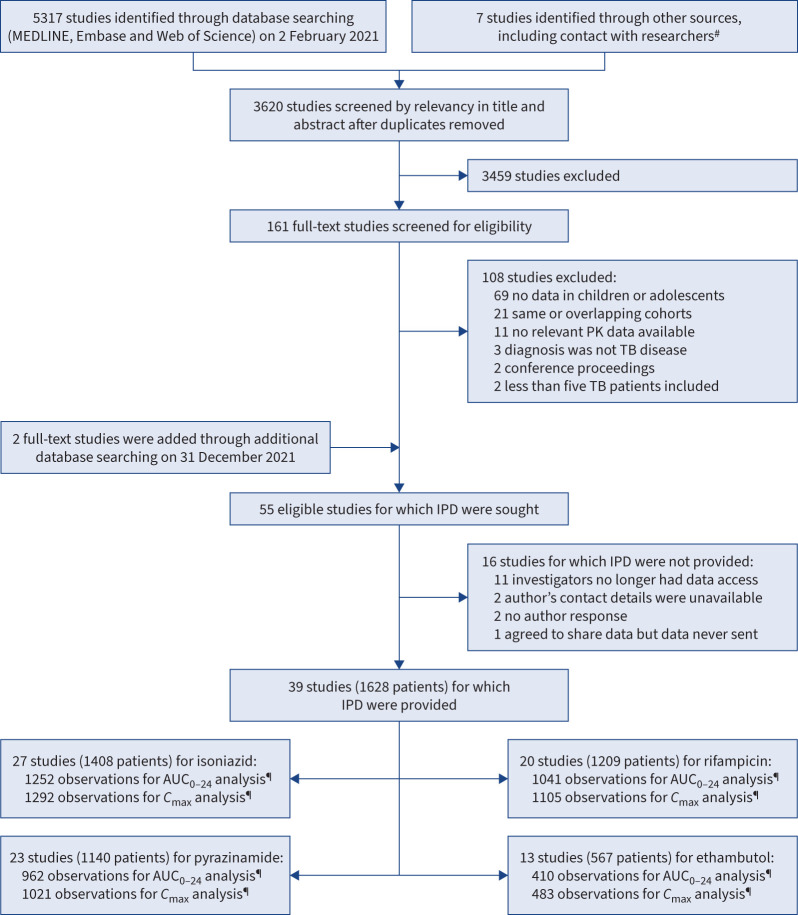
Methods: We systematically searched MEDLINE, Embase and Web of Science (1990-2021) for pharmacokinetic studies of first-line anti-TB drugs in children and adolescents. Individual patient data were obtained from authors of eligible studies. Summary estimates of total/extrapolated area under the plasma concentration-time curve from 0 to 24 h post-dose (AUC0-24) and peak plasma concentration (C max) were assessed with random-effects models, normalised with current World Health Organization-recommended paediatric doses. Determinants of AUC0-24 and C max were assessed with linear mixed-effects models.
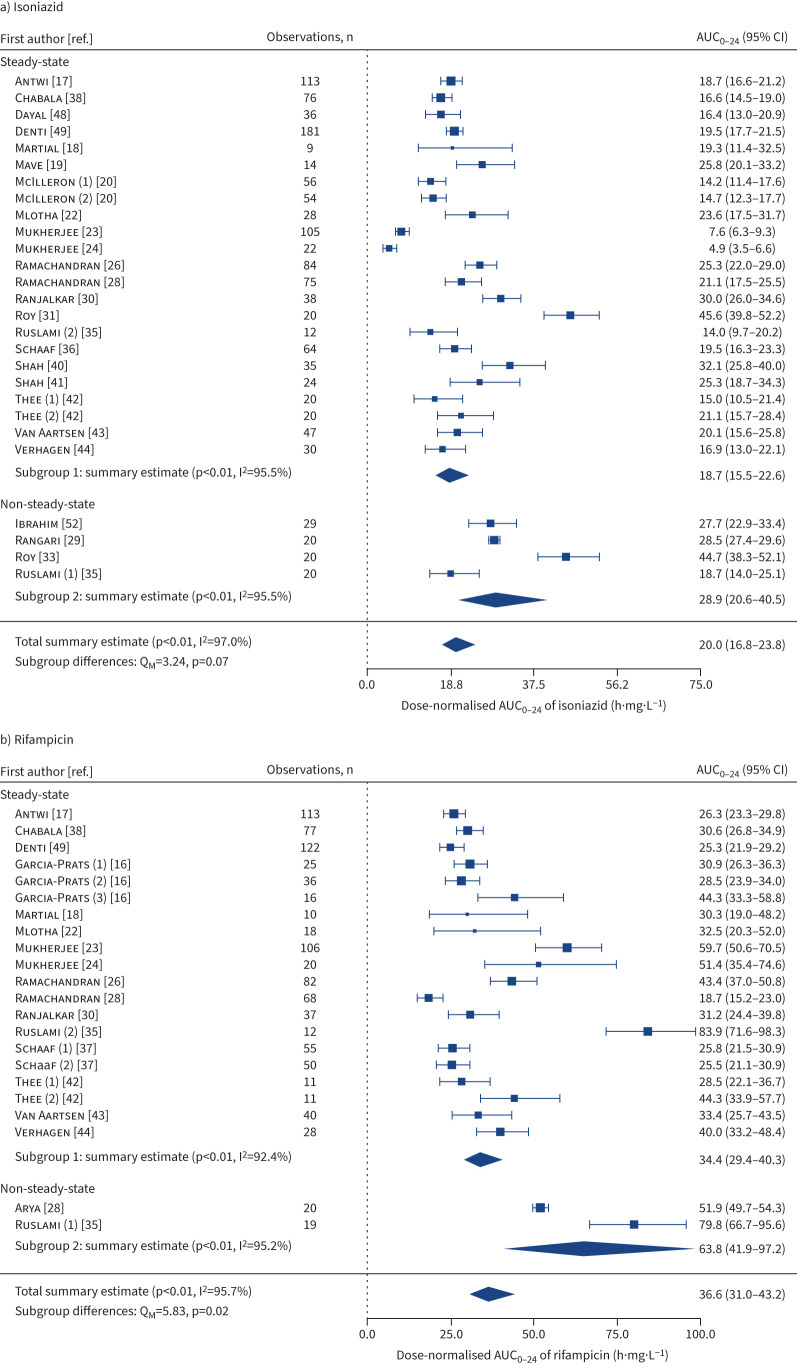
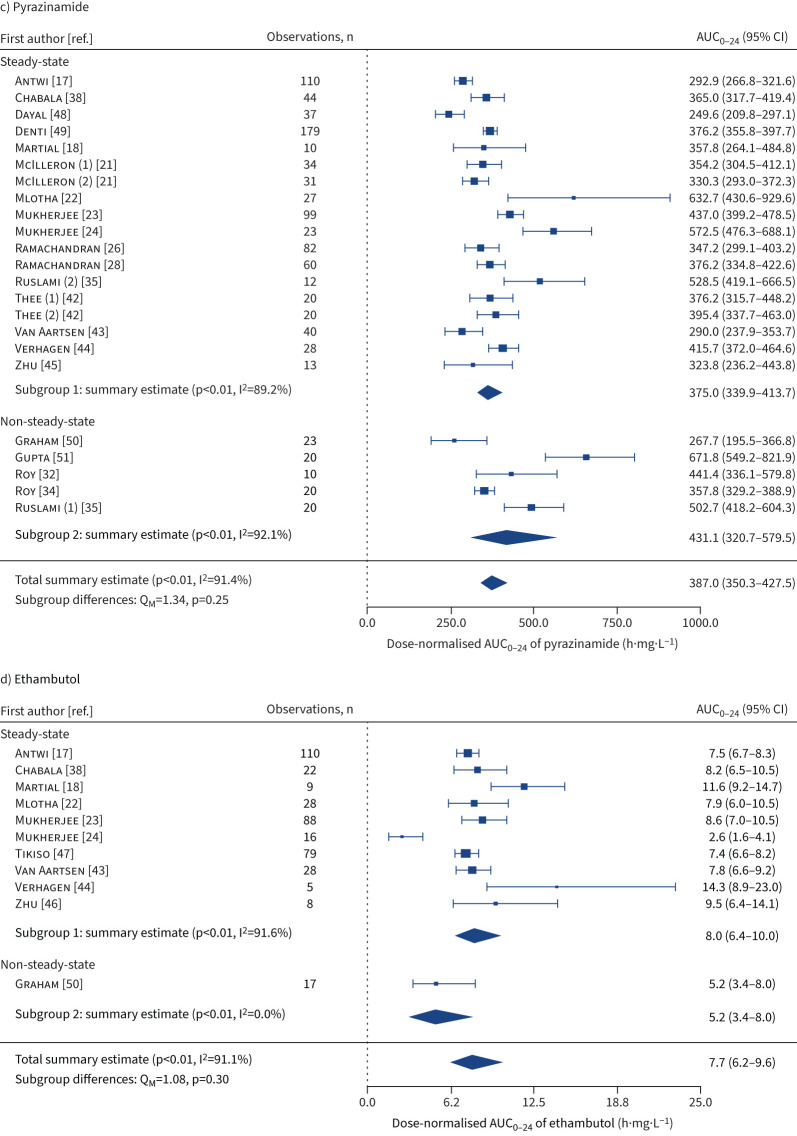
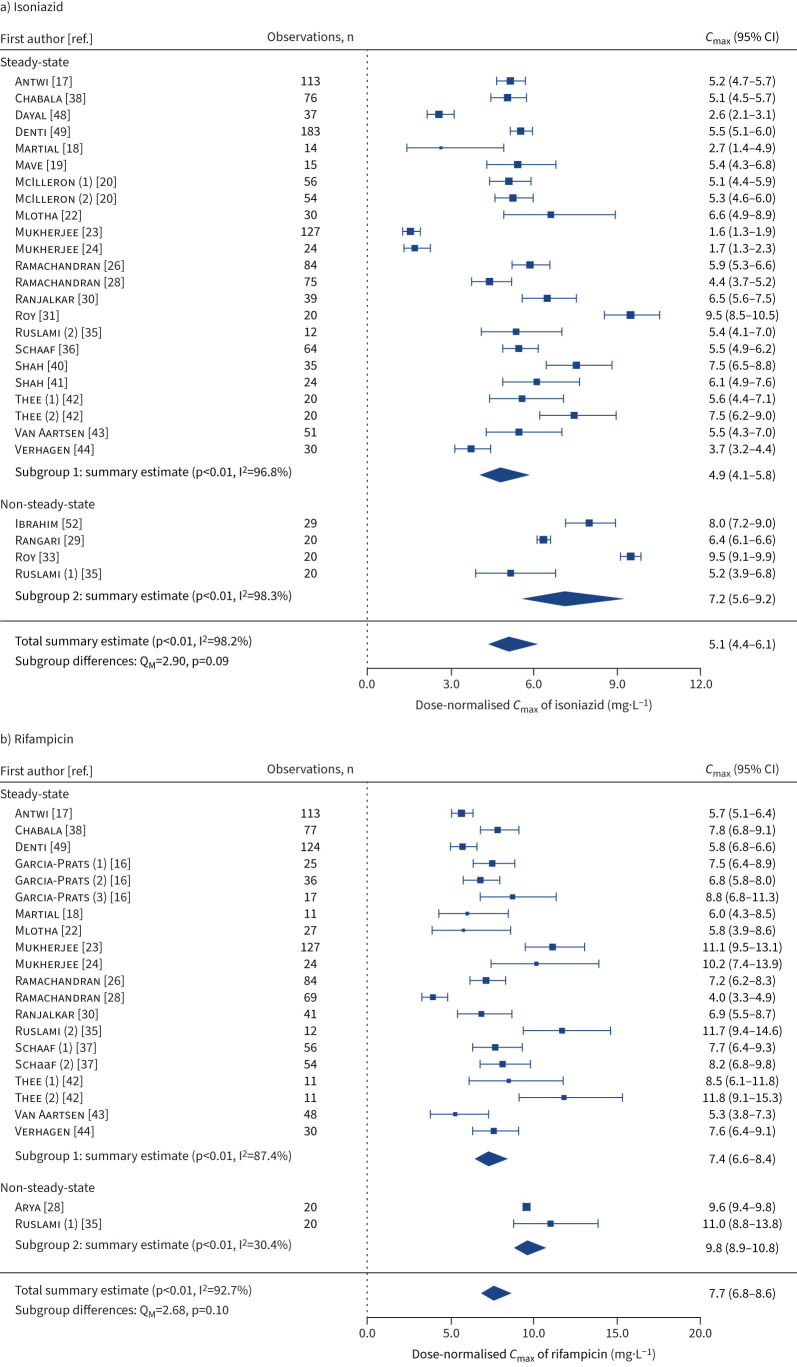
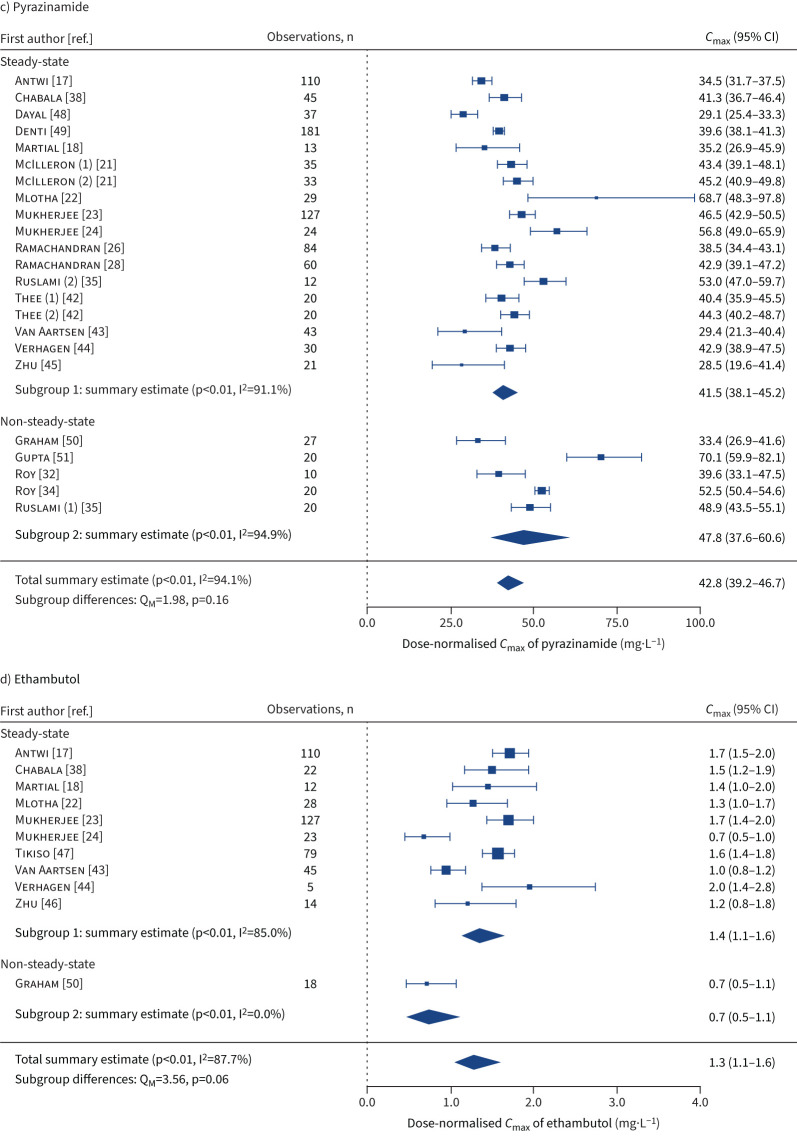
Results: Of 55 eligible studies, individual patient data were available for 39 (71%), including 1628 participants from 12 countries. Geometric means of steady-state AUC0-24 were summarised for isoniazid (18.7 (95% CI 15.5-22.6) h·mg·L-1), rifampicin (34.4 (95% CI 29.4-40.3) h·mg·L-1), pyrazinamide (375.0 (95% CI 339.9-413.7) h·mg·L-1) and ethambutol (8.0 (95% CI 6.4-10.0) h·mg·L-1). Our multivariate models indicated that younger age (especially <2 years) and HIV-positive status were associated with lower AUC0-24 for all first-line anti-TB drugs, while severe malnutrition was associated with lower AUC0-24 for isoniazid and pyrazinamide. N-acetyltransferase 2 rapid acetylators had lower isoniazid AUC0-24 and slow acetylators had higher isoniazid AUC0-24 than intermediate acetylators. Determinants of C max were generally similar to those for AUC0-24.
Conclusions: This study provides the most comprehensive estimates of plasma exposures to first-line anti-TB drugs in children and adolescents. Key determinants of drug exposures were identified. These may be relevant for population-specific dose adjustment or individualised therapeutic drug monitoring.
Copyright ©The authors 2023.
Conflict of interest statement
Conflict of interest: H.S. Schaaf reports grants from the NIH/IMPAACT; and honoraria from Ann Lake publications (sponsored by Johnson & Johnson) for an educational publication on the management of MDR-TB in children. A. Bekker reports grants from IMPAACT, UNITAID; lecture honoraria from Sandoz; support for attending PENTA PIM meeting; and received generic LPV/r, 3TC and ABC for the PETITE study. D.J. Bell reports support for attending a meeting from ViiV pharmaceuticals; and attendance fees for an advisory board meeting from ViiV pharmaceuticals. L. Choo reports grants from the UKRI MRC DFID Wellcome NIHR Joint Global Health Trials, TB Alliance Support for trial drug purchase and UKRI COVID-19 Grant Extension Allocation Award. P. Denti reports a grant for WHO expert review for TB drugs in children. S.M. Graham reports participation on a data safety monitoring board for the TB CHAMP trial; and leadership roles as a co-chair for the Guidelines Development Committee of the WHO updated recommendations and consolidated guidelines on child and adolescent TB, and as a core member for the WHO Child and Adolescent TB Working Group. S.K. Heysell reports grants from the NIH, DANIDA and EDTCP; royalties or licences from UpToDate; and honoraria for lectures from Henry Stewart Talks. A. Kwara reports a grant from the NIH/NICHD. V. Mave reports grants from the NIH and CDC. C.A. Peloquin reports a grant from the NIH. V. Roy reports a grant from the Delhi State TB Association; and leadership roles as a member of the Delhi State TB Association and the MAMC TB Committee. E.M. Svensson reports grants from the NWO personal Veni, IMI UNITE4TB consortium, TB Alliance, UNITAID BenefitKids consortium, WHO expert review, NIH support for IMPAACT studies, Blueprint, Probex, ACTG study Clo-FAST, Janssen Pharmaceuticals, EDCTP support PanTB-HM and Legochem; and leadership or fiduciary roles in the ISOP DI&E committee and BenNeLux PMX organising committee. U. Thatte reports participation on a data safety monitoring board for an ICMR TB trial. T.A. Thomas reports grants from the NIH and the University of Virginia. D.J. Touw reports a grant from Chiesi; consulting fees from Pure IMS and Sanguin; and participation on a data safety monitoring board for the FORMAT trial. A. Turkova reports grants from the UKRI MRC DFID Wellcome NIHR Joint Global Health Trials and MRC Grants for core funding of the Medical Research Council Clinical Trials Unit at the UCL; and TB Alliance Support for SHINE trial drug purchase. All of this work was declared by the authors to be outside the submitted work. All other authors declare no competing interests.
Figures
Comment in
-
Children and TB pharmacokinetics: no longer in infancy?Eur Respir J. 2023 Mar 9;61(3):2202003. doi: 10.1183/13993003.02003-2022. Print 2023 Mar. Eur Respir J. 2023. PMID: 36894189 No abstract available.
References
-
- World Health Organization . Global tuberculosis report 2021. 2021. www.who.int/publications/i/item/9789240037021 Date last accessed: 11 August 2022.
-
- World Health Organization . Roadmap towards ending TB in children and adolescents, 2nd ed. 2018. https://apps.who.int/iris/handle/10665/275422 Date last accessed: 11 August 2022.
Publication types
MeSH terms
Substances
Grants and funding
- MR/L004445/1/MRC_/Medical Research Council/United Kingdom
- MC_UU_12023/27/MRC_/Medical Research Council/United Kingdom
- MC_UU_12023/26/MRC_/Medical Research Council/United Kingdom
- U01 AI115594/AI/NIAID NIH HHS/United States
- WT_/Wellcome Trust/United Kingdom
- R01 HD069175/HD/NICHD NIH HHS/United States
- 001/WHO_/World Health Organization/International
- R01 AI037845/AI/NIAID NIH HHS/United States
- R01 HD071779/HD/NICHD NIH HHS/United States
- R01 AI137080/AI/NIAID NIH HHS/United States
- M01 RR000051/RR/NCRR NIH HHS/United States
- K23 AI097197/AI/NIAID NIH HHS/United States
- MC_UU_00004/04/MRC_/Medical Research Council/United Kingdom
LinkOut - more resources
Full Text Sources