. 2022 Nov:41:63-75.
doi: 10.1016/j.jare.2022.01.004. Epub 2022 Jan 11.

Mechanical overloading induces GPX4-regulated chondrocyte ferroptosis in osteoarthritis via Piezo1 channel facilitated calcium influx

Affiliations

Mechanical overloading induces GPX4-regulated chondrocyte ferroptosis in osteoarthritis via Piezo1 channel facilitated calcium influx

Shaoyi Wang et al. J Adv Res. 2022 Nov.

Abstract

Introductions: Excessive mechanical stress is closely associated with cell death in various conditions. Exposure of chondrocytes to excessive mechanical loading leads to a catabolic response as well as exaggerated cell death. Ferroptosis is a recently identified form of cell death during cell aging and degeneration. However, it's potential association with mechanical stress remains to be illustrated.

Objectives: To identify whether excessive mechanical stress can cause ferroptosis. To explore the role of mechanical overloading in chondrocyte ferroptosis.

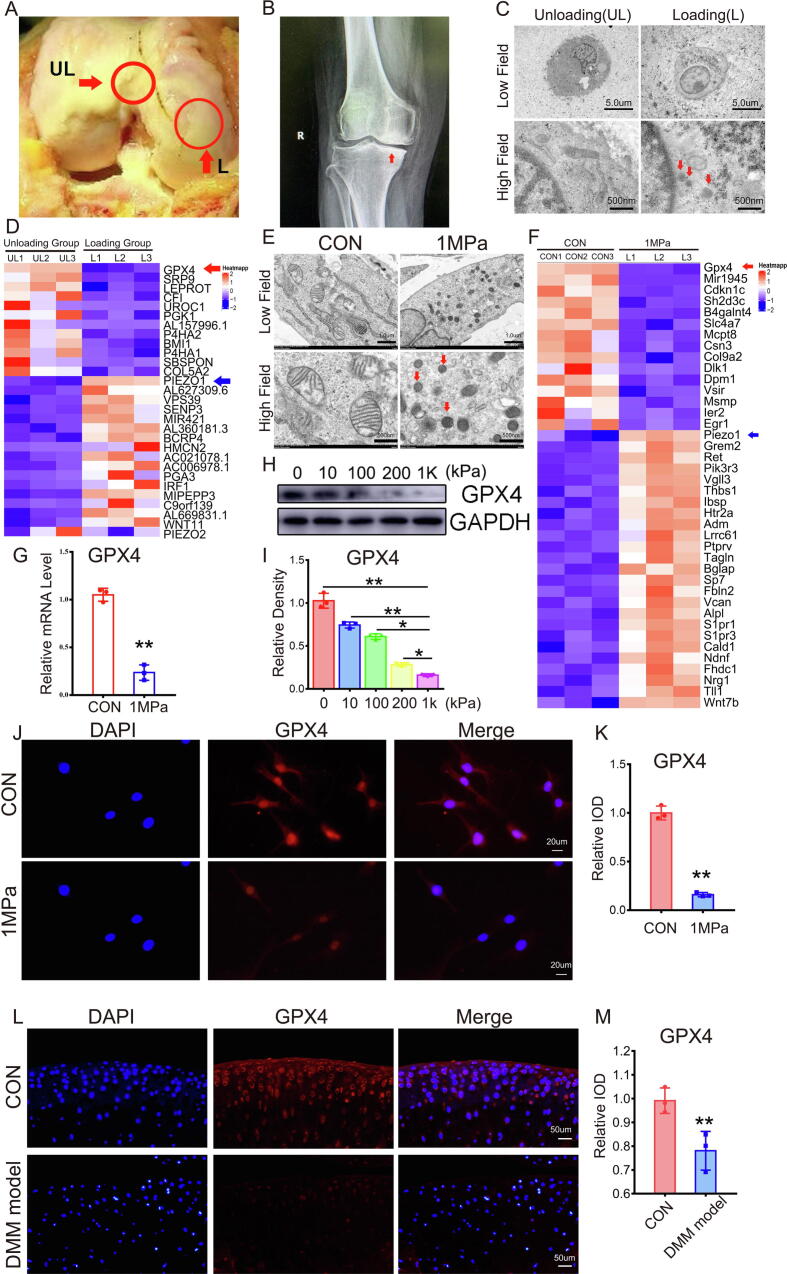
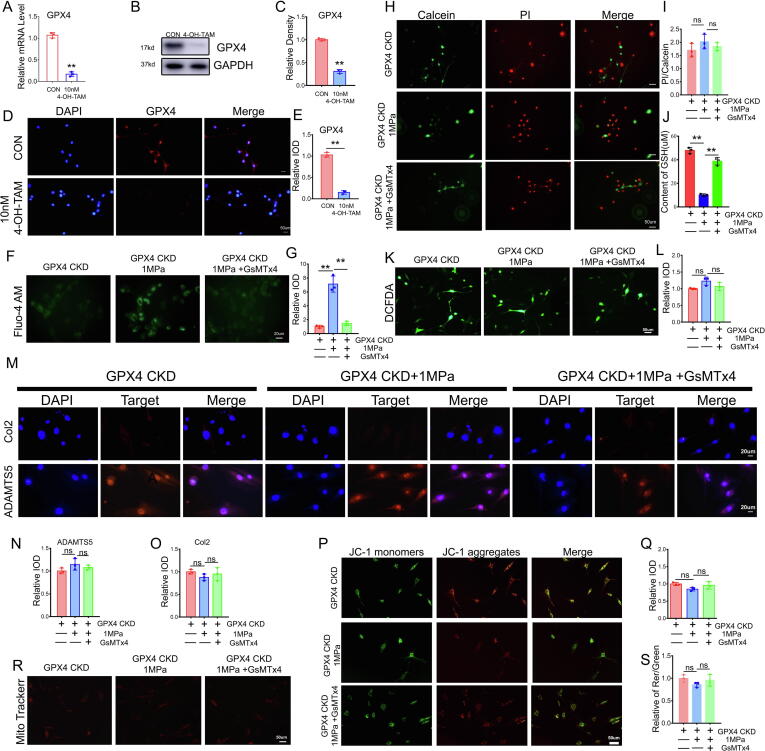
Methods: Chondrocytes were collected from loading and unloading zones of cartilage in patients with osteoarthritis (OA), and the ferroptosis phenotype was analyzed through transmission electron microscope and microarray. Moreover, the relationship between ferroptosis and OA was analyzed by GPX4-conditional knockout (Col2a1-CreERT: GPX4flox/flox) mice OA model and chondrocytes cultured with high strain mechanical stress. Furthermore, the role of Piezo1 ion channel in chondrocyte ferroptosis and OA development was explored by using its inhibitor (GsMTx4) and agonist (Yoda1). Additionally, chondrocyte was cultured in calcium-free medium with mechanical stress, and ferroptosis phenotype was tested.

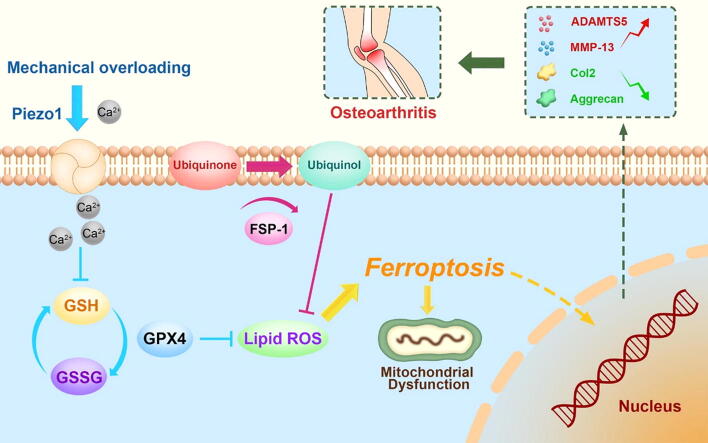
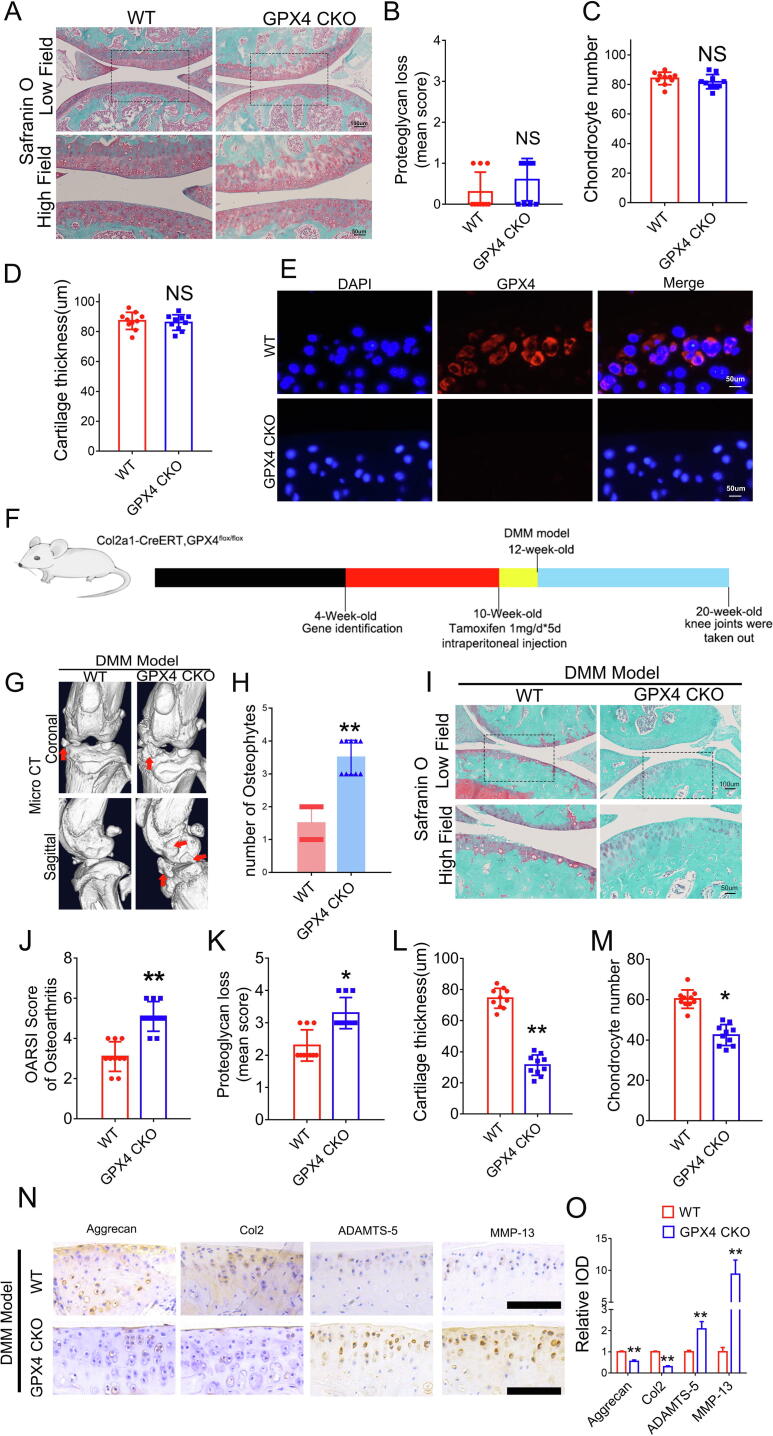
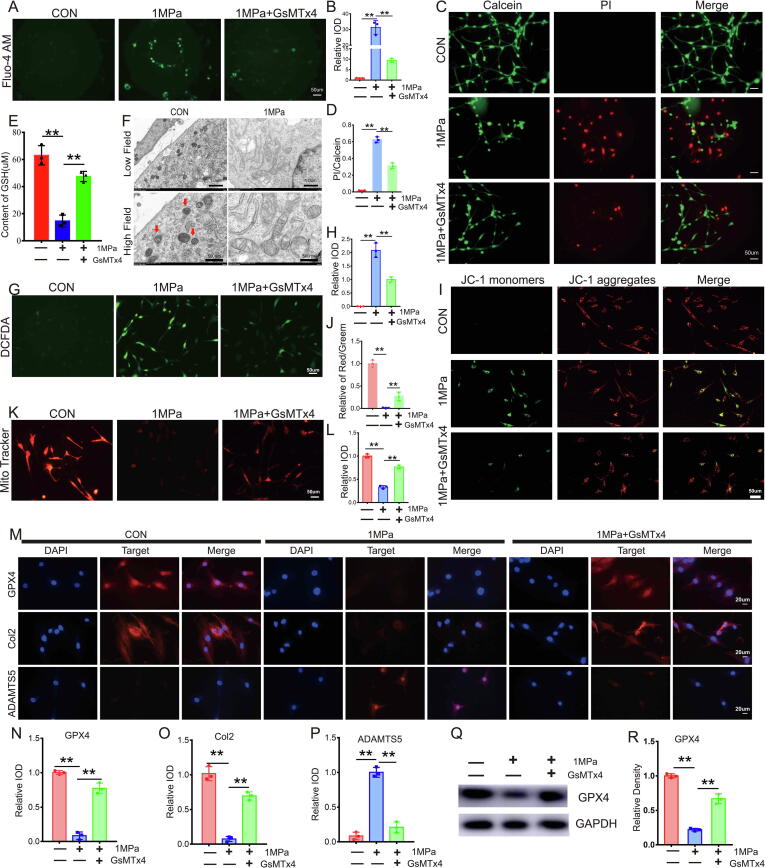
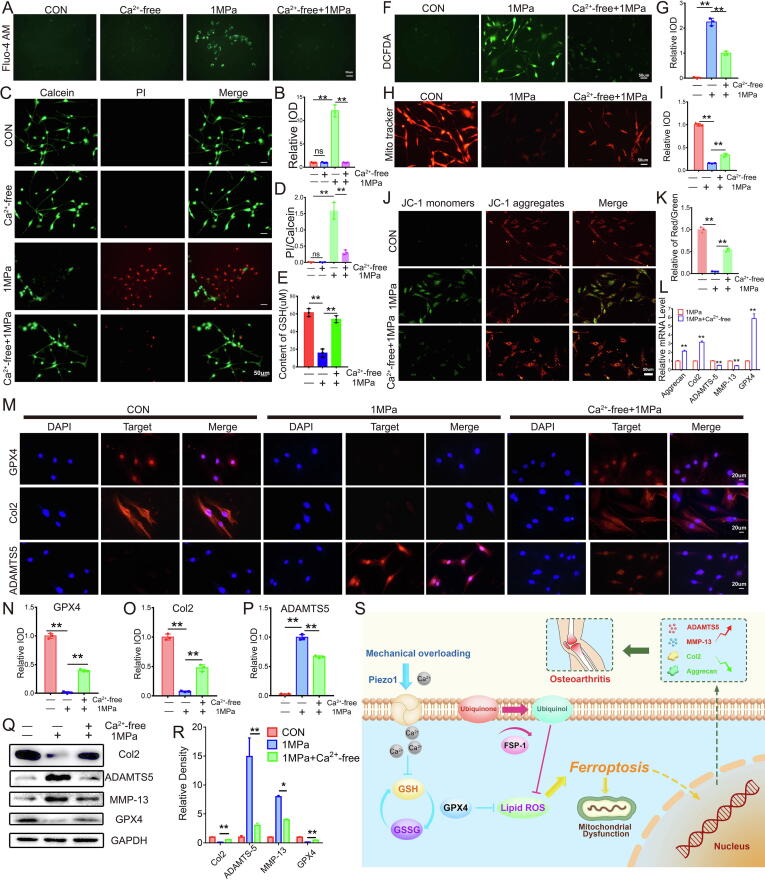
Results: Human cartilage and mouse chondrocyte experiments revealed that mechanical overloading can induce GPX4-associated ferroptosis. Conditional knockout of GPX4 in cartilage aggravated experimental OA process, while additional treatment with ferroptosis suppressor protein (FSP-1) and coenzyme Q10 (CoQ10) abated OA development in GPX4-CKO mice. In mouse OA model and chondrocyte experiments, inhibition of Piezo1 channel activity increased GPX4 expression, attenuated ferroptosis phenotype and reduced the severity of osteoarthritis. Additionally, high strain mechanical stress induced ferroptosis damage in chondrocyte was largely abolished by blocking calcium influx through calcium-free medium.

Conclusions: Our findings show that mechanical overloading induces ferroptosis through Piezo1 activation and subsequent calcium influx in chondrocytes, which might provide a potential target for OA treatment.

Keywords: Chondrocytes; Ferroptosis; Mechanical stress; Osteoarthritis; Piezo1.


Conflict of interest statement

Declaration of Competing Interest The authors declare that they have no known competing financial interests or personal relationships that could have appeared to influence the work reported in this paper.

Figures

None
Graphical abstract
Fig. 1
Fig. 1
Excessive stress loading leads to ferroptosis in chondrocytes. (A) The unloading (UL) and loading (L) zone from the articular cartilage of patients with OA. (B) X-ray of the knee joints from patients with OA, and red arrow indicates concentrated loading in the medial part of knee joints. (C) Representative TEM images of chondrocytes from the UL and L zones (n = 3 for each group). Arrows show the shrunken mitochondria. Scale bars, 5 μm (Low field), 500 nm (High field). (D) Microarray heatmap of the indicated groups. (E). Representative TEM images of wild-type mice chondrocytes from the CON group and 1 MPa group (n = 3 for each group). Arrows show the shrunken mitochondria. Scale bars, 1 μm (low field), 500 nm (high field). (F). Microarray heatmap of the indicated groups. (G). Real-time PCR of GPX4 (n = 3 for each group). (H). Western blot (WB) analysis of GPX4 under different pressure conditions. (I). Quantification of WB analysis (n = 3 for each group). (J). Immunofluorescence analysis of GPX4. Scale bars, 20 μm. (K). Quantification of immunofluorescence analysis (n = 3 for each group). (L). Immunofluorescence analysis of GPX4. Scale bars, 50 μm. (M). Quantification of immunofluorescence analysis (n = 3 for each group). Data were presented as the mean ± SD. *P < 0.05, **P < 0.01.
Fig. 2
Fig. 2
GPX4-associated ferroptosis exacerbates OA development. (A). Representative images of safranin O staining of cartilage in 12-week-old GPX4 CKO (Col2a1-CreERT, GPX4flox/flox) mice and Wild type (WT, GPX4+/+) littermates. Scale bars, 100 μm (low field), 50 μm (high field). (B-D). Evaluation of proteoglycan loss, cartilage thickness and chondrocyte number in articular cartilage based on safranin O staining (n = 10 for each group). (E). Immunofluorescence of GPX4. Scale bars, 50 μm. (F). Flowchart of animal experiment. (G). Representative images of Micro-CT of GPX4 CKO mice and WT littermates after DMM model (n = 10 for each group). Arrows show the formation of osteophytes. (H). Osteophyte number assay based on Micro-CT (n = 10 for each group). (I). Representative images of safranin O staining. Scale bars, 100 μm (low field), 50 μm (high field). (J-M). Osteoarthritis Research Society International (OARSI) grade, evaluation of proteoglycan loss, cartilage thickness and chondrocyte number based on safranin O staining (n = 10 for each group). (N). Immunohistochemical assay of Aggrecan, Col2, ADAMTS-5 and MMP-13 in articular cartilage of each group. (O). Quantification of immunohistochemical analysis (n = 3 for each group). Scale bars 50 μm. Data were presented as the mean ± SD. *P < 0.05, **P < 0.01.
Fig. 3
Fig. 3
Mechanical overloading induced ferroptosis in chondrocytes through the Piezo 1 ion channel. (A). Calcium influx was tested by Fluo-4 AM. Scale bar = 50 μm. (B). Quantitative analysis of fluorescence intensity (n = 3 for each group). (C). The cell death ratio of chondrocytes was tested by cell death/live analysis. Scale bar = 50 μm. (D). The cell number of PI (red fluorescence)/calcein (green fluorescence) reflected the cell death ratio (n = 3 for each group). (E). The expression of GSH in chondrocytes was detected by ELISA (n = 3 for each group). (F). Representative TEM images of the indicated groups (n = 3 for each group). Arrows showed shrunken mitochondria. Scale bars, 1 μm (low field), 500 nm (high field). (G). Representative images of ROS levels in chondrocytes. Scale bar = 50 μm. (H). Quantitative analysis of fluorescence intensity (n = 3 for each group). (I). Mitochondrial membrane potential was detected by JC-1 assay. Scale bar = 50 μm. (J). The relative IOD ratio of red fluorescence to green fluorescence was used for quantitative analysis (n = 3 for each group). (K). Representative fluorescence images of mitochondria in chondrocytes. Scale bar = 50 μm. (L). Quantitative analysis of fluorescence intensity (n = 3 for each group). (M). Representative immunofluorescence images of GPX4, Col2 and ADAMTS-5 in chondrocytes. Scale bars 20 μm. (N-P). Quantification of immunofluorescence analysis (n = 3 for each group). (Q). Western blot (WB) analysis of GPX4. (R). Quantification of WB analysis (n = 3 for each group). Data were presented as the mean ± SD. *P < 0.05, **P < 0.01.
Fig. 4
Fig. 4
Suppression of Piezo1 attenuated cartilage aging in a DMM osteoarthritis model. (A). Flowchart of animal experiment. (B). Representative images of Micro-CT of the PBS group and GsMTx4 group after DMM model (n = 10). Arrows show the formation of osteophytes. (C). Osteophyte number assay based on Micro-CT (n = 10 for each group). (D). Representative images of safranin O fast green staining of the PBS group and GsMTx4 group. Scale bars, 100 μm (low field), 50 μm (high field). (E). Osteoarthritis Research Society International (OARSI) score of OA based on the results of safranin O staining (n = 10 for each group). (F). Representative immunofluorescence images of GPX4 in articular cartilage of the indicated group. (G). Quantification of immunofluorescence analysis (n = 3 for each group). (H). Immunohistochemical assay of Aggrecan, Col2, ADAMTS-5 and MMP-13 in articular cartilage of the indicated group. Scale bars 50 μm. (I). Quantification of immunohistochemical analysis (n = 3 for each group). Data were presented as the mean ± SD. *P < 0.05, **P < 0.01.
Fig. 5
Fig. 5
Suppression of the Piezo1 channel failed to reverse mechanical overload-induced chondrocyte damage in GPX4-deficient mice. (A). Real-time PCR analysis of GPX4 (n = 3 for each group). (B). Western blot (WB) analysis of GPX4. (C). Quantification of WB analysis (n = 3 for each group). (D). Representative immunofluorescence images of GPX4 in chondrocytes. Scale bars 50 μm. (E). Quantification of immunofluorescence analysis (n = 3 for each group). (F). Calcium influx in chromocytes was tested by Fluo-4 AM of chondrocytes in each indicated group. Scale bars 50 μm. (G). Quantitative analysis of fluorescence intensity (n = 3 for each group). (H). Cell death ratio of chondrocytes in each indicated group. Scale bar = 50 μm. (I). The cell number of PI (red fluorescence)/calcein (green fluorescence) reflected the cell death ratio (n = 3 for each group). (J). The expression of GSH in chondrocytes (n = 3 for each group). (K). Representative images of ROS levels in chondrocytes. Scale bar = 50 μm. (L). Quantitative analysis of fluorescence intensity (n = 3 for each group). (M). Representative immunofluorescence images of Col2 and ADAMTS-5 in chondrocytes. Scale bars 20 μm. (N-O). Quantification of immunofluorescence analysis (n = 3 for each group). (P). JC-1 assay of chondrocytes. Scale bar = 50 μm. (Q). The relative IOD ratio of red fluorescence to green fluorescence was used for quantitative analysis (n = 3 for each group). (R). Representative fluorescence images of mitochondria in chondrocytes. Scale bar = 50 μm. (S). Quantitative analysis of fluorescence intensity (n = 3 for each group). Data were presented as the mean ± SD. *P < 0.05, **P < 0.01.
Fig. 6
Fig. 6
Calcium influx was required for mechanical stimulus-induced ferroptosis in chondrocytes. (A). Calcium influx in chromocytes was tested by Fluo-4 AM of chondrocytes in each indicated group. Scale bars 50 μm. (B). Quantitative analysis of fluorescence intensity (n = 3 for each group). (C). Cell death ratio of chondrocytes in each indicated group. Scale bar = 50 μm. (D). The cell number of PI (red fluorescence)/calcein (green fluorescence) reflected the cell death ratio (n = 3 for each group). (E). The expression of GSH in chondrocytes (n = 3 for each group). (F). Representative images of ROS levels in chondrocytes in each indicated group. Scale bar = 50 μm. (G). Quantitative analysis of fluorescence intensity (n = 3 for each group). (H). Representative fluorescence images of mitochondria in chondrocytes. Scale bar = 50 μm. (I). Quantitative analysis of fluorescence intensity (n = 3 for each group). (J). JC-1 assay of chondrocytes in each indicated group. Scale bar = 50 μm. (K). The relative IOD ratio of red fluorescence to green fluorescence was used for quantitative analysis (n = 3 for each group). (L). Real-time PCR analysis of GPX4, Aggrecan, Col2, ADAMTS-5 and MMP-13 in chondrocytes (n = 3 for each group). (M). Representative immunofluorescence images of GPX4, Col2 and ADAMTS-5 in chondrocytes. Scale bars 20 μm. (N-P). Quantification of immunofluorescence analysis (n = 3 for each group). (Q). Western blot (WB) analysis of GPX4, Col2, ADAMTS-5 and MMP-13 in chondrocytes. (R). Quantification of WB analysis (n = 3 for each group). (S). Schematic diagram of mechanical overloading induced ferroptosis in chondrocyte. Data were presented as the mean ± SD. *P < 0.05, **P < 0.01.

References

    1. Lewko B., Stepinski J. Hyperglycemia and mechanical stress: targeting the renal podocyte. J Cell Physiol. 2009;221(2):288–295. doi: 10.1002/jcp.21856. - DOI - PubMed
    1. Scott A., Khan K., Heer J., Cook J., Lian O., Duronio V. High strain mechanical loading rapidly induces tendon apoptosis: an ex vivo rat tibialis anterior model. Br J Sports Med. 2005;39(5) doi: 10.1136/bjsm.2004.015164. - DOI - PMC - PubMed
    1. Nava M.M., Miroshnikova Y.A., Biggs L.C., Whitefield D.B., Metge F., Boucas J., et al. Heterochromatin-Driven Nuclear Softening Protects the Genome against Mechanical Stress-Induced Damage. Cell. 2020;181(4):800–817.e22. doi: 10.1016/j.cell.2020.03.052. - DOI - PMC - PubMed
    1. Zhang X., Jing Y., Qin C., Liu C., Yang D., Gao F., et al. Mechanical stress regulates autophagic flux to affect apoptosis after spinal cord injury. J Cell Mol Med. 2020;24(21):12765–12776. doi: 10.1111/jcmm.15863. - DOI - PMC - PubMed
    1. Tang J., Liu C., Li B., Hong S., Li Q., Wang L., et al. Protective Role of Nuclear Factor Erythroid-2-Related Factor 2 against Mechanical Trauma-Induced Apoptosis in a Vaginal Distension-Induced Stress Urinary Incontinence Mouse Model. Oxid Med Cell Longevity. 2019;2019:1–10. doi: 10.1155/2019/2039856. - DOI - PMC - PubMed

Publication types