. 2022 Nov 3;13(1):6615.
doi: 10.1038/s41467-022-34260-2.

Immunomodulatory fecal metabolites are associated with mortality in COVID-19 patients with respiratory failure

Affiliations

Immunomodulatory fecal metabolites are associated with mortality in COVID-19 patients with respiratory failure

Matthew R Stutz et al. Nat Commun. .

Abstract

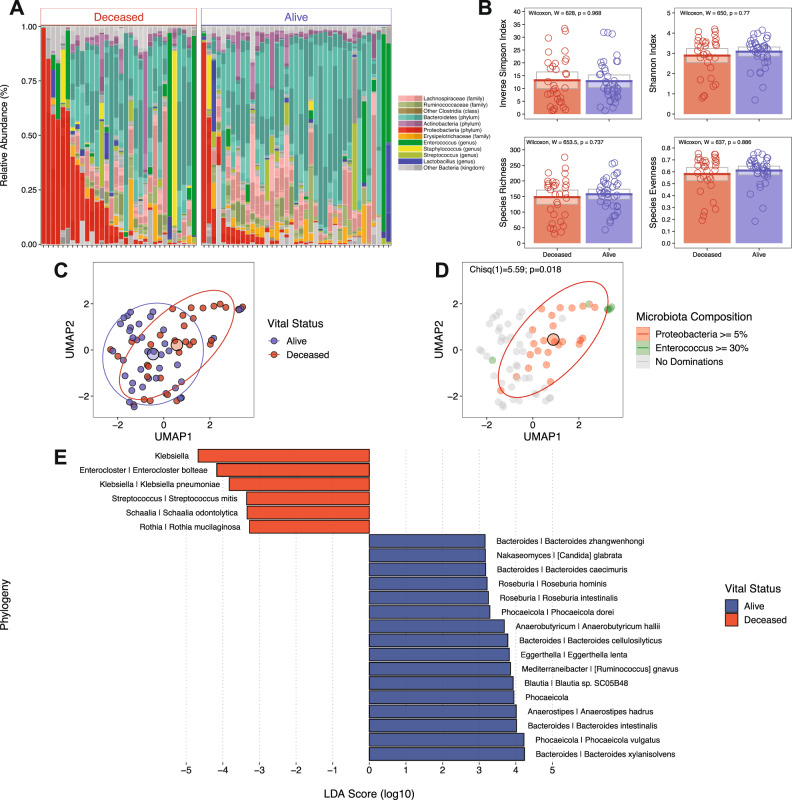
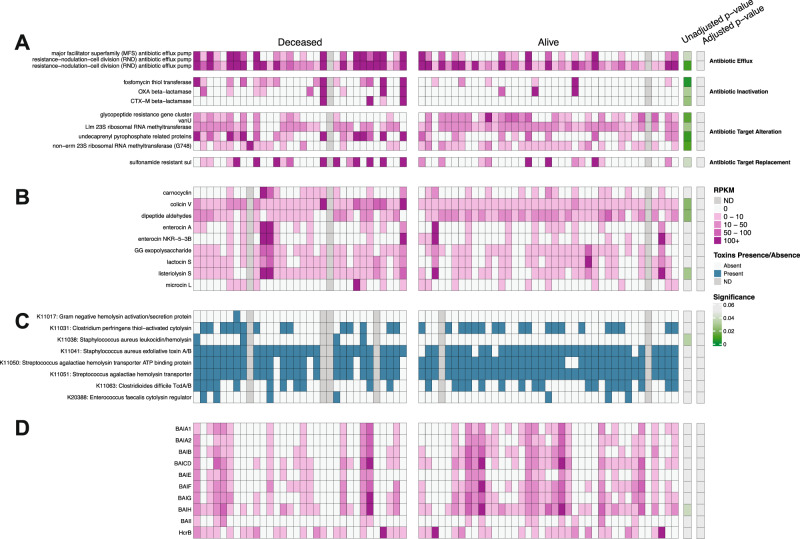
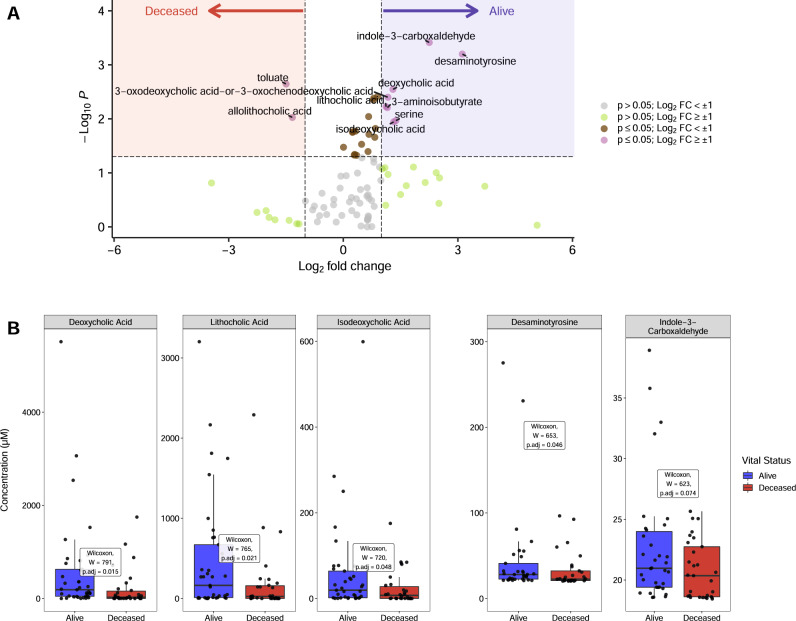
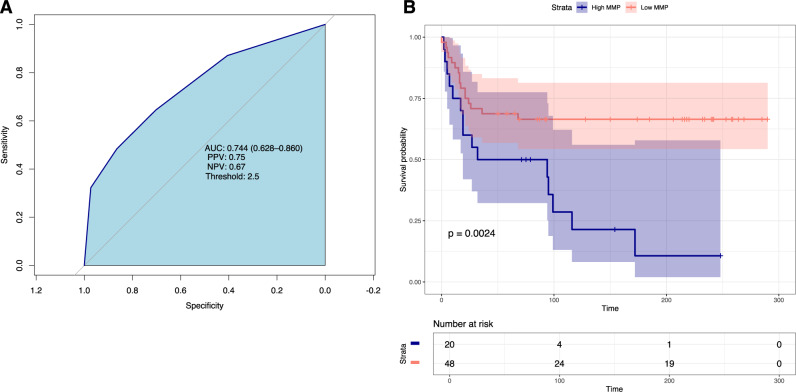
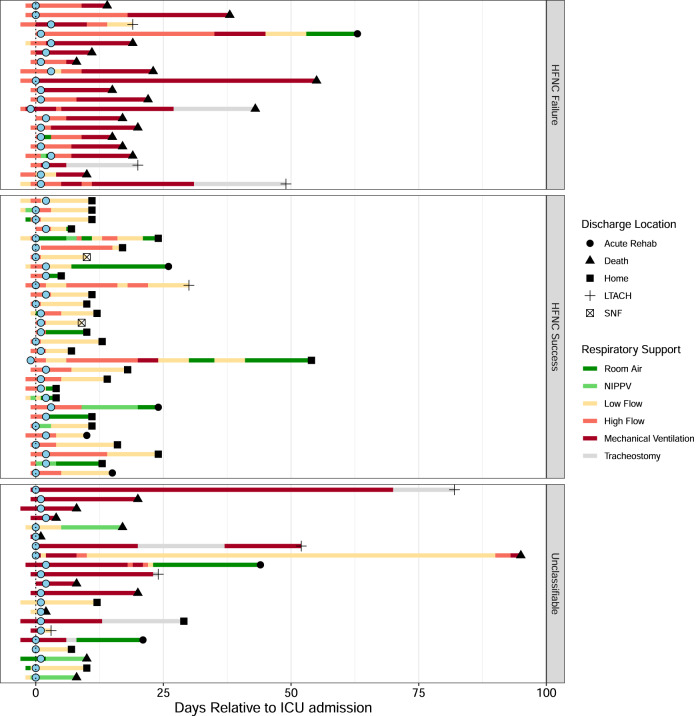
Respiratory failure and mortality from COVID-19 result from virus- and inflammation-induced lung tissue damage. The intestinal microbiome and associated metabolites are implicated in immune responses to respiratory viral infections, however their impact on progression of severe COVID-19 remains unclear. We prospectively enrolled 71 patients with COVID-19 associated critical illness, collected fecal specimens within 3 days of medical intensive care unit admission, defined microbiome compositions by shotgun metagenomic sequencing, and quantified microbiota-derived metabolites (NCT #04552834). Of the 71 patients, 39 survived and 32 died. Mortality was associated with increased representation of Proteobacteria in the fecal microbiota and decreased concentrations of fecal secondary bile acids and desaminotyrosine (DAT). A microbiome metabolic profile (MMP) that accounts for fecal secondary bile acids and desaminotyrosine concentrations was independently associated with progression of respiratory failure leading to mechanical ventilation. Our findings demonstrate that fecal microbiota composition and microbiota-derived metabolite concentrations can predict the trajectory of respiratory function and death in patients with severe SARS-Cov-2 infection and suggest that the gut-lung axis plays an important role in the recovery from COVID-19.


Conflict of interest statement

The authors declare no competing interests.

Figures

Fig. 1
Fig. 1. Fecal microbiome composition in patients with severe COVID-19 stratified by mortality.
A Shotgun metagenomics-based taxonomy plots stratified by survival where taxa are shaded to biologically relevant levels (legend to the right). B Alpha diversity (Inverse Simpson and Shannon Index) plots and Species Richness and Evenness stratified by survival where colored bars represent the average value for survival (blue bars: alive, red bars: deceased) while gray boxes denote 95% confidence intervals. Wilcoxon rank-sum, two-tailed tests were implemented and p-values were adjusted via the Benjamini-Hochberg method. C Uniform Manifold Approximation and Projection (UMAP) from shotgun metagenomics-based taxonomy, colored by survival (blue points: alive and red points: deceased) with centroids and 95% CI ellipses. D UMAP colored by expansion of Enterococcus (green), Proteobacteria (red), both Enterococcus and Proteobacteria (red and green halves), and no expansions (gray) with centroids and 95% CI ellipse. A two-tailed, chi-squared test was used to compare expansions to vital outcomes. E A Linear discriminant analysis effect size (LEfSe) showing the significant (Wilcoxon rank-sum, two-tailed, p ≤ 0.05) effect sizes of taxa between survival groups (blue bars: alive, red bars: deceased). A linear discriminant analysis was performed in lieu of adjusting for multiple comparisons. n = 71 independent samples from patients.
Fig. 2
Fig. 2. Representation of genes encoding antibiotic resistance, toxins and metabolite production stratified by Mortality.
Panel A displays genes encoding for antibiotic resistance. Panel B displays genes encoding for bacteriocins. Panel C displays genes encoding for toxins/hemolysins/cytolysins. Panel D displays the genes responsible for bile acid conversion, as well as butyrate-related enzymes and desaminotyrosine. Genes in Panels A, B, D were quantified using RPKM values (shades of pink) while toxin genes in Panel C were determined as presence/absence (blue/white). Gray boxes show missing data. P-values and adjusted p-values (via Benjamini-Hochberg method) were obtained from Wilcoxon rank-sum, two-tailed tests (A, B, D) and a two-tailed, chi-squared test (C) and are shown as shading from non-significant (gray) to statistically significant (green). n = 71 independent samples from patients.
Fig. 3
Fig. 3. Qualitative and quantitative fecal metabolomic analyses.
A Volcano plot of normalized metabolite concentrations, where values above the horizontal line (Wilcoxon rank-sum, two-tailed, unadjusted p-value > 0.05) and log2 fold-change values >= 1 were used to identify metabolites associated with survival. Red shading shows compounds more abundant in the deceased population while blue shading displays compounds that were more abundant in the alive population. Gray points denote p-values > 0.05 and log2 fold-change values < ±1; green points denote p-values > 0.05 and log2 fold-change values >± 1; brown points denote p-values < 0.05 and log2 fold-change values < ±1; and purple points denote p-values < 0.05 and log2 fold-change values > ±1. B Metabolites identified in panel A for survival groups (blue: alive and red: deceased) were subsequently quantified in fecal extracts by LC-MS and are shown as boxplots and compared using Wilcoxon rank-sum, two-tailed tests with p-values adjusted for multiple comparisons via the Benjamini-Hochberg method (n = 68 independent samples from patients). Bile acids, desaminotyrosine and indole-3-carboxaldehyde are in units of µM. Boxes show interquartile ranges (IQR) where the center black line represents the median and the whiskers (vertical black lines) extend to 1.5 × IQR or to the minimum and maximum value, whichever is closest to the median.
Fig. 4
Fig. 4. A Microbiome Metabolite Profile (MMP) predicts mortality in patients with severe COVID-19.
A Area under the curve (AUC) for the microbiome metabolite profile and mortality. AUC = 0.744. Positive predictive value (PPV) = 0.75 and negative predictive value (NPV = 0.67). B Kaplan–Meier survival curves stratified by low MMP scores (0–1, red shading) versus high MMP score (2–4, blue shading) are plotted. Time in days is presented on the X-axis. Log-rank test was used to assess significant differences. n = 68 independent samples from patients.
Fig. 5
Fig. 5. Progression of Respiratory Failure Stratified by Trajectory.
Each row represents an individual patient course. Blue dots represent initial fecal samples collected within 3 days of ICU admission. Figure is stratified by patients who transitioned from high flow nasal cannula to low flow nasal cannula versus those who progressed to endotracheal intubation and received mechanical ventilation. Patients in whom a transition could not be identified were labeled unclassifiable. Shapes are denoted as the discharge location while colored bars denote the type of respiratory support. LTACH long term acute care hospital, SNF skilled nursing facility.

References

    1. World Health Organization COVID-19 Dashboard. https://covid19.who.int/.
    1. D’Agnillo F, et al. Lung epithelial and endothelial damage, loss of tissue repair, inhibition of fibrinolysis, and cellular senescence in fatal COVID-19. Sci. Transl. Med. 2021;13:eabj7790. doi: 10.1126/scitranslmed.abj7790. - DOI - PMC - PubMed
    1. Nienhold R, et al. Two distinct immunopathological profiles in autopsy lungs of COVID-19. Nat. Commun. 2020;11:5086. doi: 10.1038/s41467-020-18854-2. - DOI - PMC - PubMed
    1. Channappanavar R, et al. IFN-I response timing relative to virus replication determines MERS coronavirus infection outcomes. J. Clin. Invest. 2019;129:3625–3639. doi: 10.1172/JCI126363. - DOI - PMC - PubMed
    1. Xu Z, et al. Pathological findings of COVID-19 associated with acute respiratory distress syndrome. Lancet Respir. Med. 2020;8:420–422. doi: 10.1016/S2213-2600(20)30076-X. - DOI - PMC - PubMed

Publication types