. 2022 Nov 3;13(1):6586.
doi: 10.1038/s41467-022-34188-7.

UniTVelo: temporally unified RNA velocity reinforces single-cell trajectory inference

Affiliations

UniTVelo: temporally unified RNA velocity reinforces single-cell trajectory inference

Mingze Gao et al. Nat Commun. .

Abstract

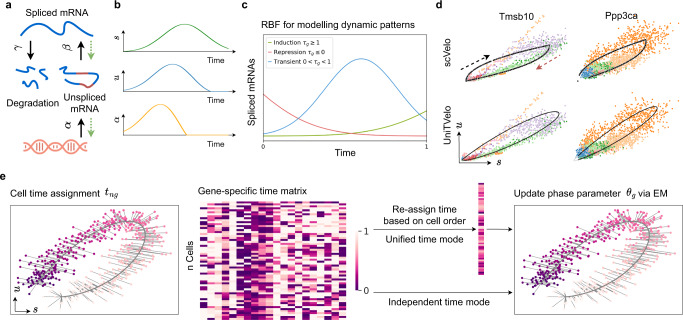
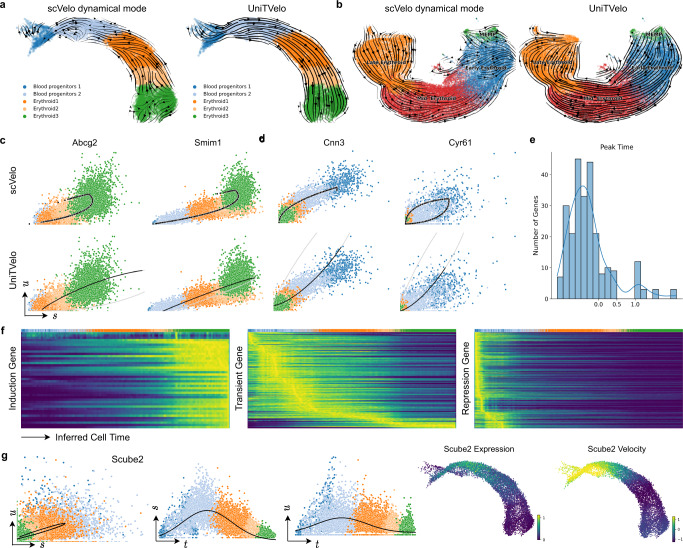
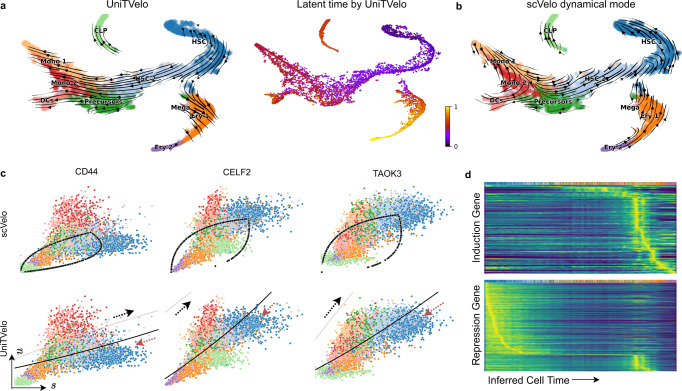
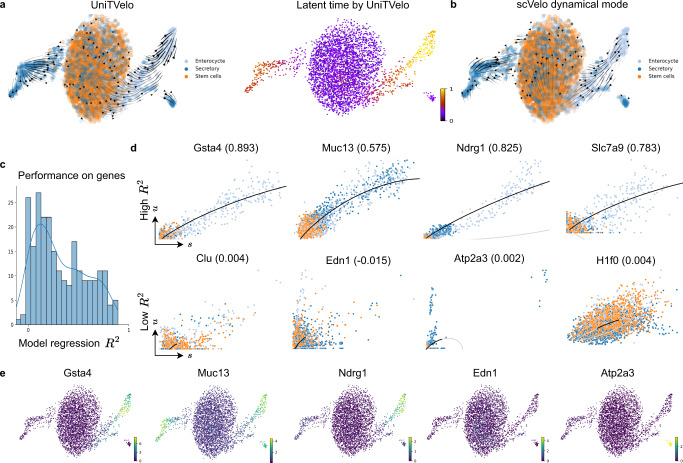
The recent breakthrough of single-cell RNA velocity methods brings attractive promises to reveal directed trajectory on cell differentiation, states transition and response to perturbations. However, the existing RNA velocity methods are often found to return erroneous results, partly due to model violation or lack of temporal regularization. Here, we present UniTVelo, a statistical framework of RNA velocity that models the dynamics of spliced and unspliced RNAs via flexible transcription activities. Uniquely, it also supports the inference of a unified latent time across the transcriptome. With ten datasets, we demonstrate that UniTVelo returns the expected trajectory in different biological systems, including hematopoietic differentiation and those even with weak kinetics or complex branches.


Conflict of interest statement

The authors declare no competing interests.

Figures

Fig. 1
Fig. 1. Illustration of UniTVelo for modelling of transcription dynamics and RNA velocity.
a Illustration of transcriptional process which involves transcription rate α, splicing rate β, and degradation rate γ. Green dotted line indicates that parameters are inferred reversely. b Paradigm of the model in a with time as independent variable, showing predicted changes of α with regards to measured expression profile. c RBF for modeling patterns of induction, repression, and transient dynamics of each gene, where τg represents the peak time. Latent time of this model is rescaled and truncated between 0 and 1. d Example of phase portraits (can be splitted to induction and repression stages from the middle, shown in black and red arrows respectively) of two dynamical genes modeled by both scVelo and UniTVelo, Tmsb10 and Ppp3ca, showing RBF kernel has a similar ability to recover gene’s dynamic information. Colors indicate various cell types. e The inference of UniTVelo which tries to recover genes’ dynamic process via two sets of parameters: (1) gene-specific parameters θg which define how transcriptome of each gene changes along time and the relationship between un/spliced mRNA in progression. (2) cell-specific time points tng. By iteratively updating the gene-specific parameters using gradient descent, cell time points are assigned by minimizing the euclidean distance to phase trajectory. Specifically, besides directly using gene-specific time matrix in optimization, UniTVelo also supports a unified-time assignment for each cell based on cell ordering. This enables the discrepancy between genes’ directionality to be minimized.
Fig. 2
Fig. 2. UniTVelo correctly identifies trajectory of both mouse and human erythroid haematopoiesis lineages.
a Velocities derived from scVelo’s dynamical mode (left) and UniTVelo (right) of mouse erythroid lineage. b RNA velocity is also tested on a human erythroid dataset starting from progenitor cells, illustrating scVelo’s dynamical mode (left) could not find the correct directionality compared with UniTVelo. c, d Four example genes are selected from the mouse erythroid dataset to demonstrate phase portraits depicted from both methods. Abcg2 and Simi1 are induction genes whilst Cnn3 and Cyr61 are repression genes, the former two are also considered as MURK genes with transcriptional boosting. Upper panel: scVelo. Lower panel: UniTVelo, both gray and black lines are part of phase portraits whilst only black part is used by the model. The direction of the curve is the same as Fig. 1d. e A histogram showing the distribution of peak time of each gene in the mouse erythroid dataset, indicating a large proportion of genes' activity is inhibited during differentiation. f Genes can be coarsely classified into three types according to peak time. Heatmap along with inferred cell time shows a clear and accurate separation between each type, e.g., induction genes tend to be active at the end of cellular process whilst repression genes behave oppositely. g An example of transient genes, Scube2, shows misleading time assignments if only one phase portrait is used. However, unified time suggests a clear transient pattern for both unspliced and spliced counts.
Fig. 3
Fig. 3. UniTVelo correctly identifies differentiation trajectory of human bone marrow development.
a UMAP coordinates of the velocity field shown in streamlines (left) and predicted latent time (right) from UniTVelo. b Estimated RNA velocity field in streamlines by scVelo. c Cd44, Celf2, and Taok3 are selected as examples, illustrating UniTVelo could accurately capture cell states and directionality whilst scVelo failed to capture the relative cell states using almond shape phase portraits. Upper panel: Regression result by scVelo. Lower panel: Inferred cell state by UniTVelo, gray and black line demonstrates part of induction and repression phase of RBF kernel respectively and the black part is used by the model. Red arrows show the correct directionality of cellular dynamics. d Heatmaps of predicted induction and repression gene expressions are resolved along the inferred cell time, showing a clear separation in temporal space. Entities are smoothed spliced counts.
Fig. 4
Fig. 4. Delineating cell fate transitions in intestinal organoid.
a Intestinal organoid differentiation dataset is acquired with scEU-seq. Without metabolic labeling knowledge, UniTVelo clearly reveals two differentiation branches to secretory and enterocyte lineage from stem cells in both velocity field (left) and inferred latent time (right). b On the contrary, scVelo reveals a distorted or reversed directionality under same data inputs. c Histogram of the distribution of model regression R2 from UniTVelo on each gene of dataset. d Example genes with higher R2 and lower R2 are shown respectively. Better-fitted genes tend to have a more evident expression trend in certain lineage, which could presumably be used to interpret the inferred trajectory. Poorly fitted genes tend to exhibit less obvious traits or less abundant. Colors for each cell type are in accordance with a. e Examples of expression profiles on genes with high R2 or low R2.

References

    1. Wagner DE, Klein AM. Lineage tracing meets single-cell omics: opportunities and challenges. Nat. Rev. Genet. 2020;21:410–427. doi: 10.1038/s41576-020-0223-2. - DOI - PMC - PubMed
    1. Ding, J., Sharon, N. & Bar-Joseph, Z. Temporal modelling using single-cell transcriptomics. Nat. Rev. Genet.23, 355–368 (2022). - PMC - PubMed
    1. Saelens W, Cannoodt R, Todorov H, Saeys Y. A comparison of single-cell trajectory inference methods. Nat. Biotechnol. 2019;37:547–554. doi: 10.1038/s41587-019-0071-9. - DOI - PubMed
    1. Setty M, et al. Wishbone identifies bifurcating developmental trajectories from single-cell data. Nat. Biotechnol. 2016;34:637–645. doi: 10.1038/nbt.3569. - DOI - PMC - PubMed
    1. Haghverdi L, Büttner M, Wolf FA, Buettner F, Theis FJ. Diffusion pseudotime robustly reconstructs lineage branching. Nat. Methods. 2016;13:845–848. doi: 10.1038/nmeth.3971. - DOI - PubMed

Publication types