. 2022 Nov 4;12(11):149.
doi: 10.1038/s41408-022-00745-y.

GATA-3 is a proto-oncogene in T-cell lymphoproliferative neoplasms

Affiliations

GATA-3 is a proto-oncogene in T-cell lymphoproliferative neoplasms

Xiangrong Geng et al. Blood Cancer J. .

Abstract

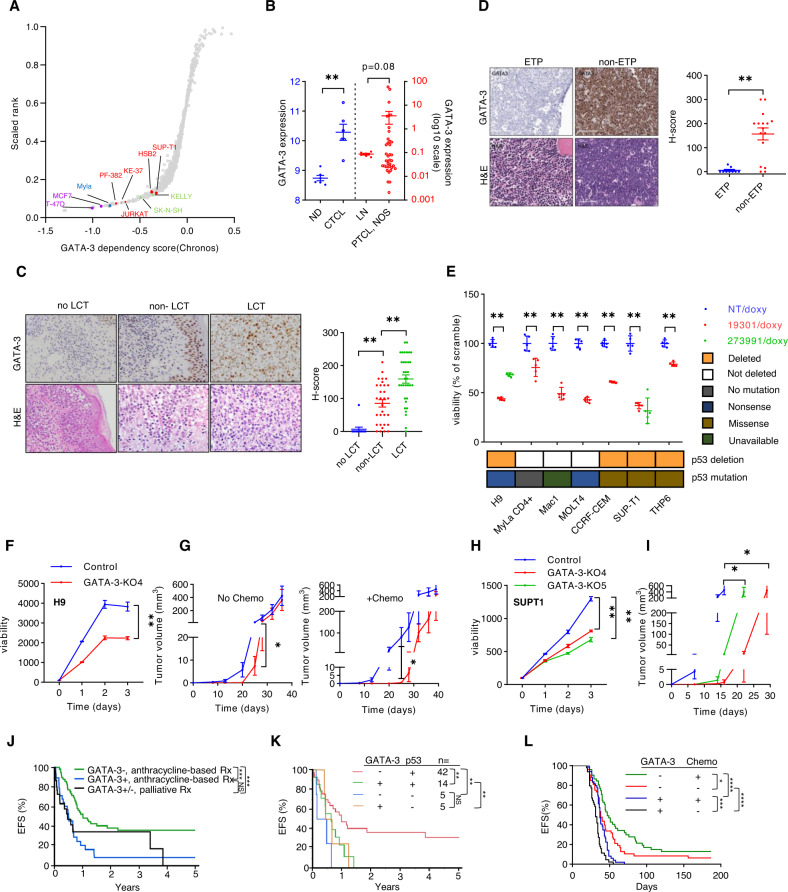
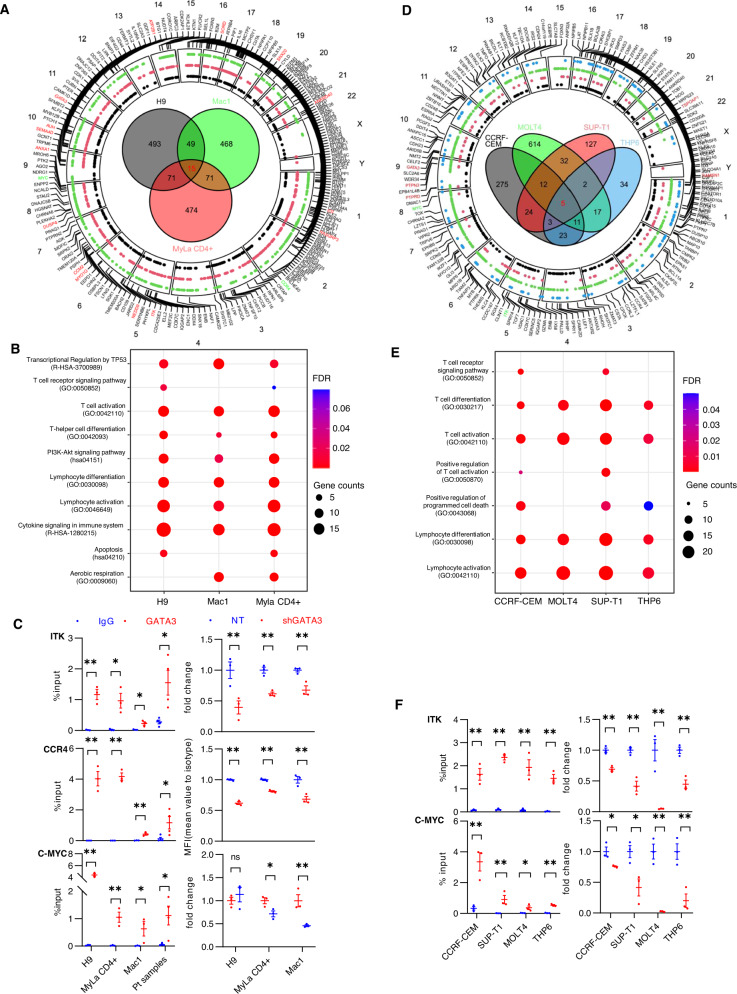
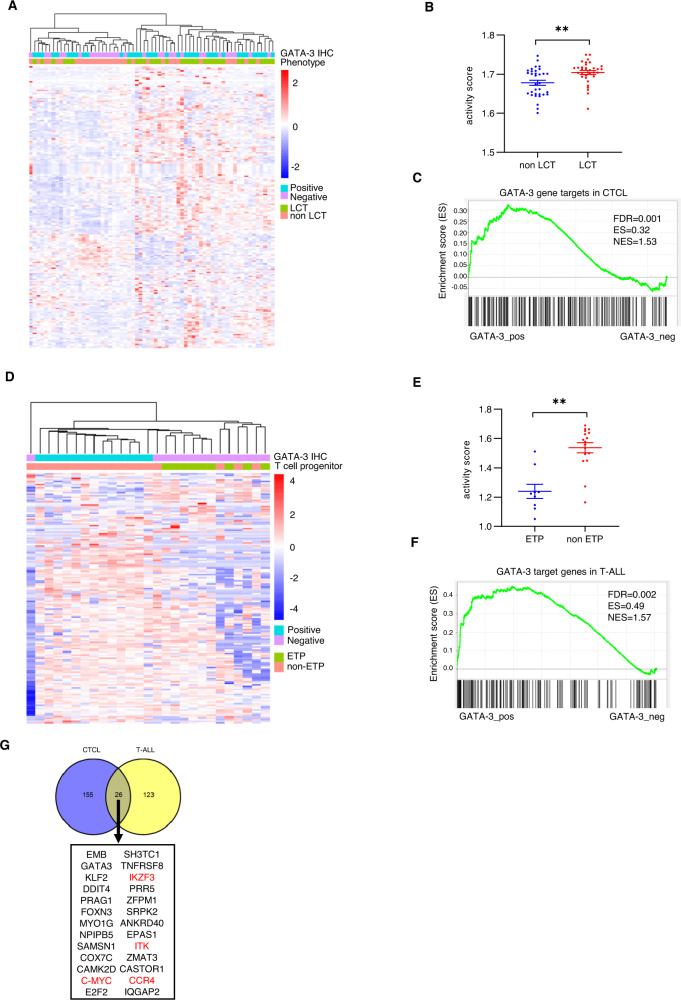
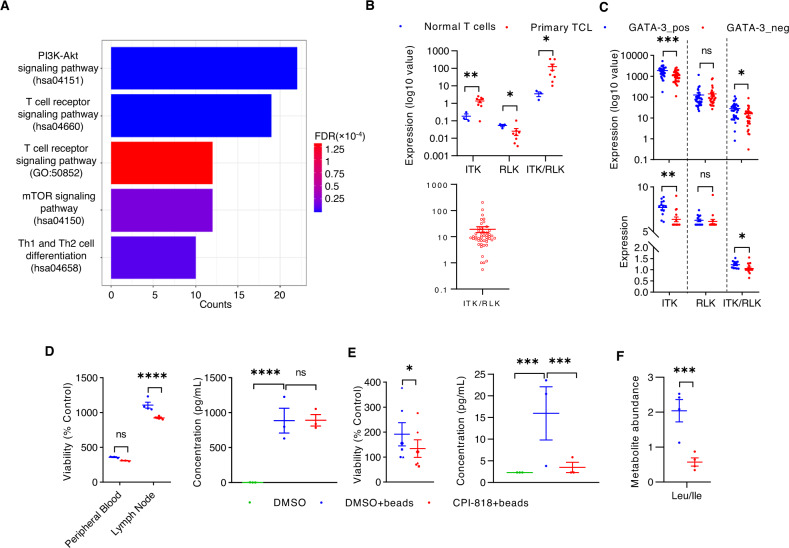
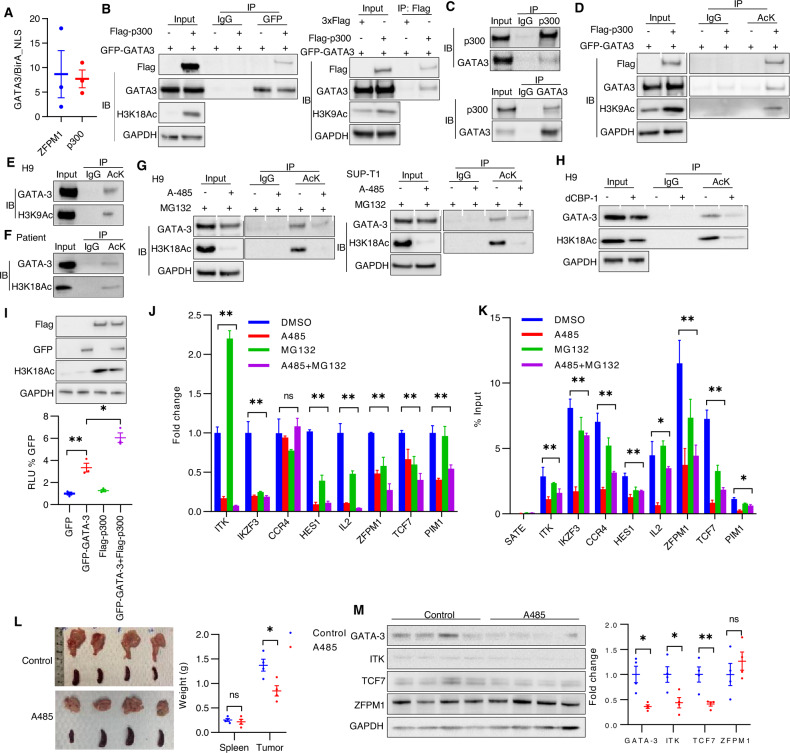
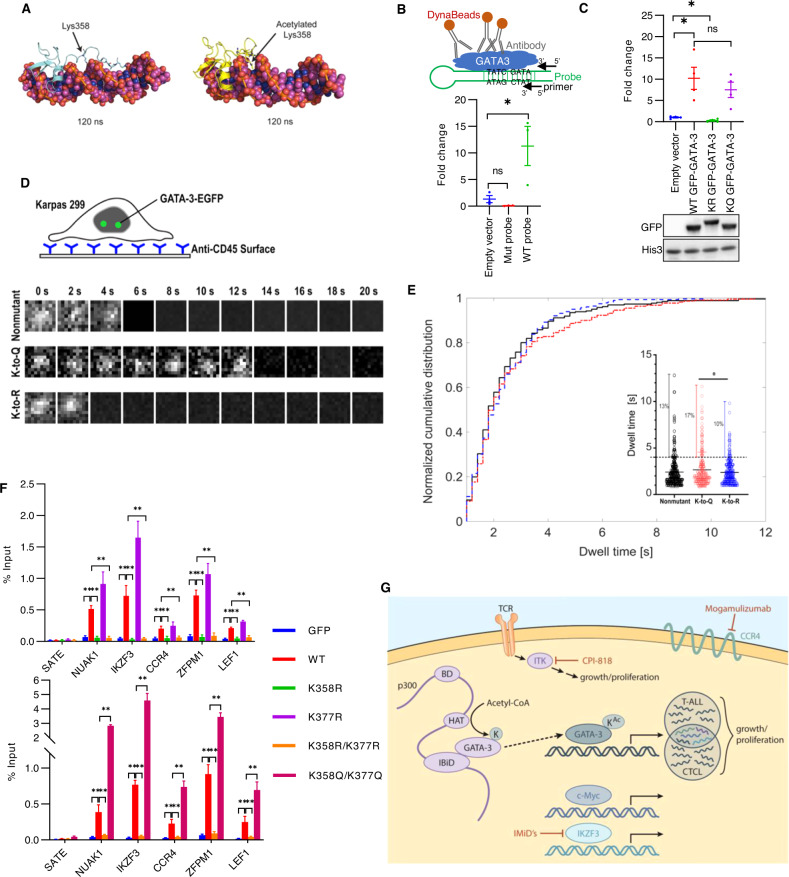
Neoplasms originating from thymic T-cell progenitors and post-thymic mature T-cell subsets account for a minority of lymphoproliferative neoplasms. These T-cell derived neoplasms, while molecularly and genetically heterogeneous, exploit transcription factors and signaling pathways that are critically important in normal T-cell biology, including those implicated in antigen-, costimulatory-, and cytokine-receptor signaling. The transcription factor GATA-3 regulates the growth and proliferation of both immature and mature T cells and has recently been implicated in T-cell neoplasms, including the most common mature T-cell lymphoma observed in much of the Western world. Here we show that GATA-3 is a proto-oncogene across the spectrum of T-cell neoplasms, including those derived from T-cell progenitors and their mature progeny, and further define the transcriptional programs that are GATA-3 dependent, which include therapeutically targetable gene products. The discovery that p300-dependent acetylation regulates GATA-3 mediated transcription by attenuating DNA binding has novel therapeutic implications. As most patients afflicted with GATA-3 driven T-cell neoplasms will succumb to their disease within a few years of diagnosis, these findings suggest opportunities to improve outcomes for these patients.


Conflict of interest statement

The authors declare no competing interests.

Figures

Fig. 1
Fig. 1. GATA-3 dependency in T-cell lymphoproliferative neoplasms.
A A scatter plot showing relative dependency on GATA-3 in T-cell acute lymphoblastic leukemia (T-ALL) cell lines (n = 5, in red), a mature T-cell lymphoma cell line (n = 1, in blue), and 1048 additional cell lines, including breast cancer (in purple) and neuroblastoma (in green) cell lines, for which GATA-3 is a known dependency. The Y-axis shows the GATA-3 dependency rank and the X-axis shows the GATA-3 dependency score from Chronos (21Q3) for each individual cell line. B Expression of GATA-3 transcripts were collected from three microarray datasets. Two datasets from Normal donors (ND) and Sézary syndrome (CTCL) patient samples are shown at left (in Gene Expression Omnibus database, accession number: GSE131738 and GSE39041), and a dataset including reactive lymph nodes (LN) and PTCL, NOS biopsies is shown at right (accession number: GSE36172). C GATA-3 immunohistochemistry and hematoxylin and eosin (H&E) staining was performed in skin biopsies obtained from CTCL patients with limited-stage (patch/plaque) disease that never developed large cell transformation with clinical follow-up (no LCT, n = 12), and in paired biopsies obtained from patients before (non-LCT, n = 31) and after LCT (LCT, n = 34). Representative examples are shown (at left) and the data summarized (at right). D GATA-3 immunohistochemistry was similarly performed in a cohort of T-ALL biopsies, including early thymocyte progenitor (ETP, n = 9) and non-ETP specimens (n = 16). Representative images are shown (at left) and the data summarized (at right). E CTCL and T-ALL cell lines were transduced with doxycycline-inducible constructs expressing GATA-3 (19301, 273991) or non-targeting (NT) shRNA. Relative cell viability was determined 7 days after GATA-3 knockdown. As comparable results were achieved with two independent shRNA in H9 and SUPT-1 cells, the remaining cell lines were transduced with the GATA-3 targeting shRNA (19301, in red) associated with the most significant GATA-3 knockdown. P53 deletions and mutations are prevalent in these cell lines, and are indicated below. F CRISPR/cas9-mediated GATA-3 knockout (KO) was achieved in H9 cells (KO4), and cell proliferation and viability determined by RealTime-Glo. Y-axis demonstrates luminescence intensity. G NSG mice were injected subcutaneously with control and GATA-3 KO H9 cells, and mice treated with cyclophosphamide and vincristine (or vehicle control) on days 24 and 31 (n = 10). Tumor volumes, stratified by treatment, are shown. H, I Cell proliferation and viability was similarly determined in two independent GATA-3 KO SUP-T1 subclones (H) and tumor volumes (I) measured in NSG mice bearing control (n = 8) and GATA-3 KO xenografts (n = 6). Y-axis demonstrates luminescence intensity. J, K A cohort of PTCL, NOS patients was stratified by GATA-3 expression and treatments received, and event-free survival (EFS) examined (J). Loss of the p53 locus (17p13.1) was determined by FISH in the subset of cases for which tissue had not been exhausted, and EFS similarly examined (K). l Event-free survival (EFS) from Splenocytes from lymphoma-bearing GATA-3fl/fl (n = 9) and GATA-3+/+ or fl/+ (n = 10) SNF5fl/fl, CD4-Cre mice were adoptively transferred to B6 recipients (n = 4–5/biologic replicate) and were treated with cyclophosphamide and vincristine (or vehicle control) every 7 days for 2–3 weeks, and EFS determined. Data are represented as mean ± s.e.m. (standard error of the mean). *p < 0.05, **p < 0.01, ***p < 0.001, ****p < 0.0001.
Fig. 2
Fig. 2. GATA-3 target genes identified in CTCL and T-ALL regulate cell growth and viability.
A Circus plot showing GATA-3 target genes and chromosome location in CTCL cell lines. Target gene names identified in Mac1 (green), MyLa CD4 + (red), H9 (black), respectively, are indicated with the dots shown. Venn diagram of GATA-3 target genes in each cell line is shown, and target genes shared across all three cell lines are shown in red. Target genes used for validation are also shown in green. B Dot plots of representative pathways enriched with GATA-3 target genes in CTCL are indicated. C GATA-3 ChIP and binding enrichment at selected GATA-3 target genes (ITK, CCR4, and c-MYC) is shown (at left) for the 3 CTCL cell lines indicated, and for malignant T cells obtained from Sezary syndrome patients (n = 4). Gene expression upon GATA-3 knockdown (at right) was determined by qRT-PCR for ITK (top) and C-MYC (bottom). CCR4 expression was determined by flow cytometry and ∆MFI reported. Percent input (%input) was used as Y-axis in binding enrichment. Fold change was normalized to total GAPDH levels. D Circus plot showing GATA-3 target genes and chromosome location in T-ALL cell lines. Target gene names identified in THP6 (blue), SUPT1 (red), MOLT4 (green) CRF-CEM (black), respectively, are indicated with the dots shown. Venn diagram of GATA-3 target genes in each cell line is shown, and target genes shared across all four cell lines are show in red. Target genes used for validation are also shown in green. E Dot plots of representative pathways enriched with GATA-3 target genes in T-ALL are indicated. F GATA-3 ChIP and binding enrichment at selected GATA-3 target genes (ITK and c-MYC) is shown (at left) for the 4 T-ALL cell lines indicated. Gene expression upon GATA-3 knockdown (at right) was determined by qRT-PCR for ITK (top) and C-MYC (bottom). Percent input (%input) was used as Y-axis in binding enrichment. Fold change was normalized to total GAPDH levels. Data are represented as mean ± s.e.m (standard error of the mean). *p < 0.05, **p < 0.01.
Fig. 3
Fig. 3. GATA-3 targets genes are highly regulated in CTCL and T-ALL cohorts.
A Unsupervised hierarchical clustering was performed using GATA-3 target genes identified in CTCL cell lines in a cohort of CTCL biopsy specimens, including those with and without large cell transformation (LCT), as indicated. Immunohistochemistry for GATA-3 was performed, and cases stratified by GATA-3 expression, as indicated. B Scatter plot showing GATA-3 target gene activity score for non-LCT (n = 31) and LCT (n = 34) CTCL specimens is shown. C GSEA analysis of CTCL cohorts for GATA-3 target genes in CTCL. D Unsupervised hierarchical clustering was performed using GATA-3 target genes identified in T-ALL cell lines in a cohort of T-ALL biopsy specimens, including those with and without early thymocyte progenitor (ETP), as indicated. Immunohistochemistry for GATA-3 was performed, and cased stratified by GATA-3 expression, as indicated. E Scatter plot showing GATA-3 target gene activity score for non-ETP (n = 16) and ETP (n = 9) T-ALL specimens is shown. F GSEA analysis of T-ALL cohorts for GATA-3 target genes in T-ALL. G Venn diagram showing overlapping target genes between CTCL and T-ALL. Target genes identified in two out of three CTCL cell lines and in two out of four T-ALL cell lines were included for analysis. GATA-3 target genes of therapeutic interest are highlighted in red. Data are represented as mean ± s.e.m. (standard error of the mean). **p < 0.01.
Fig. 4
Fig. 4. ITK is a therapeutic vulnerability.
A Signaling pathways enriched with GATA-3 dependent kinases (n = 207) are shown. B ITK and RLK expression was determined in normal and malignant T cells (at top). The ITK/RLK ratio is also calculated and shown in an independent Nanostring dataset (at bottom). C ITK and RLK expression from CTCL (at top) and T-ALL (at bottom) biopsy specimens are summarized and stratified by GATA-3 expression as determined by immunohistochemistry. D, E Cell viability (left) and IL-10 production (right) are evaluated in normal T cells (D) and malignant T cells (E) isolated from peripheral blood. T cells were treated with anti-CD3/CD28 beads and CPI-818 (1 μM), or vehicle control (DMSO), as indicated. F Leucine/isoleucine abundance was quantified by mass spectrometry in similarly treated malignant T cells. Data are represented as mean ± s.e.m. (standard error of the mean). *p < 0.05, **p < 0.01, ***p < 0.001, ****p < 0.0001.
Fig. 5
Fig. 5. p300 interacts with and acetylates GATA-3.
A Bio-ID identified P300 and ZFPM1 as GATA-3 binding partners. The ratio of biotinylated P300 and ZFPM1 peptides identified in GATA-3-BirA and control BirA-NLS transduced Jurkat cells is shown on the y-axis. B GFP-tagged GATA-3 and Flag-tagged P300 are expressed in HEK293T cells. Anti-GFP (or isotype control) immunoprecipitation (IP) is performed, and cell lysates immunoblotted (IB) for P300 (Flag) and GATA-3 (GFP), as indicated. H3K18 acetylation, as a surrogate for P300 acetyltransferase activity, was examined in the input, as indicated. C Endogenous GATA-3 and P300 are co-immunoprecipitated, as indicated, in H9 cells. D HEK293T cells transfected with GFP-tagged GATA-3 and Flag-tagged P300 are utilized and acetylated proteins immunoprecipitated, and GATA-3 identified in cell lysates by IB, as indicated. E, F Acetylation of endogenous GATA-3 is similarly examined by IP/IB in H9 cells (E) and malignant T cells obtained from a patient with Sezary syndrome (F). G GATA-3 acetylation is examined by IP/IB in H9 and SUP-T1 cells treated for 6 h with the acetyltransferase inhibitor A-485 and the proteosome inhibitor MG132, as indicated. H GATA-3 acetylation is similarly examined by IP/IB in H9 cells treated with dCBP-1, a P300 PROTAC. I Relative luciferase activity in HEK293T cells transfected with GFP-tagged GATA-3 and/or Flag-tagged P300, as indicated. Protein expression is examined by IB, and the corresponding blots are shown. J, K Analysis of representative GATA-3 target genes in H9 cells treated with A485 or/and MG132 by qRT-PCR (J) and GATA-3 DNA-binding by ChIP-qPCR (K), respectively. L The size of the spleen and tumor in PDX-bearing NSG mice randomly treated with A485 (100 mg/kg, i.p, consecutive 4 days) or vehicle control. Mice were euthanized on day 5 post-treatment. M Cell lysates are generated from individual PDX and GATA-3, ITK, TCF7 and ZFPM1 expression are examined by IB. Fold change is normalized to total GAPDH level and is summarized at right. Each symbol represents one mouse. Data are mean ± s.e.m. (standard error of the mean). ns, not significant, *p < 0.05, **p < 0.01.
Fig. 6
Fig. 6. GATA-3 acetylation is required for DNA binding.
A Molecular dynamics simulations are performed comparing GATA-3 that is unacetylated at K358 (left) or acetylated at K358 (right). B Schematic of the in silico GATA-3 DNA-binding assay is shown. GFP antibody recognizes GATA-3-DNA probe complex, which is immunoprecipitated using DynaBeads. Primers specific for the DNA probe are used to quantify the immunoprecipitated DNA probe in complex with GATA-3. GFP-tagged GATA-3 specifically binds to DNA probes containing a palindromic consensus GATA binding motif (WT probe), but not a DNA probe in which the GATA binding motif has been mutated (Mut probe). C Quantification of GATA DNA probe (WT probe) binding to wild type- (WT), K358R/K377R mutated- (KR), and K358Q/K377Q- mutated (KQ) GATA-3 expressed in HEK293T cells. A representative immunoblot from 4 independent experiments is shown. D Schematic of the immobilization of Karpas299 using anti-CD45 antibodies on a glass coverglass for stable single-molecule imaging. Representative time-lapsed single-molecule images of GFP-tagged WT, gain-of-function (GOF, K358Q/K377Q), and loss-of-function (LOF, K358R/K377R) GATA-3 are shown. E Distribution of GATA-3 dwell times (>1 s) measured by single-molecule microscopy in the wild type (black), GOF (K-to-Q, shown in red), and LOF mutant (K-to-R, shown in blue) Karpas299 cells. The insert shows the distribution of individual GATA-3 dwell times (s) for each cell line. Dashed line separates GATA-3 binding events that are at least 4 s long from shorter events. Fraction of events longer than 4 s: 13% for the wild type, 17% for the K-to-Q mutant, and 10% for the K-to-R mutant. F Analysis of GATA-3 binding to representative target genes in Karpas299 cells overpressing GFP alone, GFP-tagged WT-, K358R-, K377R-, K358R/K377R-, and K358Q/K377Q GATA-3 by GATA-3 ChIP-qPCR. G Model of GATA-3 acetylation and transcriptional regulation of therapeutically relevant target genes. Data are mean ± s.e.m. (standard error of the mean). ns not significant. *p < 0.05, **p < 0.01.

References

    1. Wang T, Feldman AL, Wada DA, Lu Y, Polk A, Briski R, et al. GATA-3 expression identifies a high-risk subset of PTCL, NOS with distinct molecular and clinical features. Blood. 2014;123:3007–15. - PMC - PubMed
    1. Iqbal J, Wright G, Wang C, Rosenwald A, Gascoyne RD, Weisenburger DD, et al. Gene expression signatures delineate biological and prognostic subgroups in peripheral T-cell lymphoma. Blood. 2014;123:2915–23. - PMC - PubMed
    1. Wang T, Lu Y, Polk A, Chowdhury P, Zamalloa CM, Fujiwara H, et al. T-cell receptor signaling activates an ITK/NF-kappaB/GATA-3 axis in T-cell lymphomas facilitating resistance to chemotherapy. Clin Cancer Res. 2017;23:2506–15.. - PMC - PubMed
    1. Chen Y, Bates DL, Dey R, Chen PH, Machado AC, Laird-Offringa IA, et al. DNA binding by GATA transcription factor suggests mechanisms of DNA looping and long-range gene regulation. Cell Rep. 2012;2:1197–206. - PMC - PubMed
    1. Bates DL, Chen Y, Kim G, Guo L, Chen L. Crystal structures of multiple GATA zinc fingers bound to DNA reveal new insights into DNA recognition and self-association by GATA. J Mol Biol. 2008;381:1292–306. - PMC - PubMed

Publication types

Substances