. 2022 Nov 3;13(1):6589.
doi: 10.1038/s41467-022-34298-2.

Spatially resolved phosphoproteomics reveals fibroblast growth factor receptor recycling-driven regulation of autophagy and survival

Affiliations

Spatially resolved phosphoproteomics reveals fibroblast growth factor receptor recycling-driven regulation of autophagy and survival

Joanne Watson et al. Nat Commun. .

Abstract

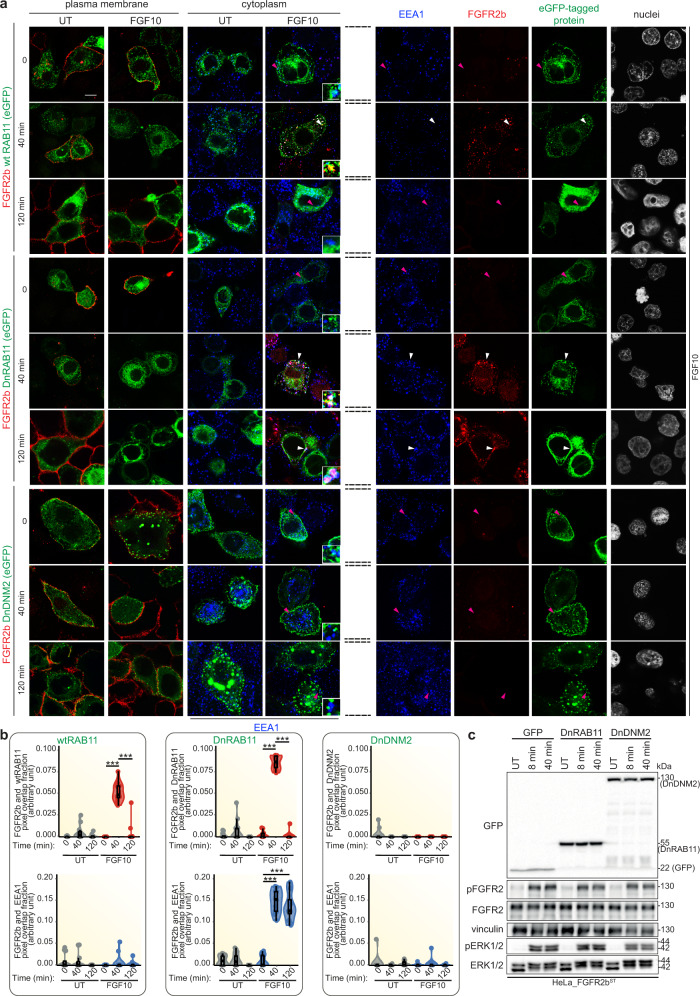
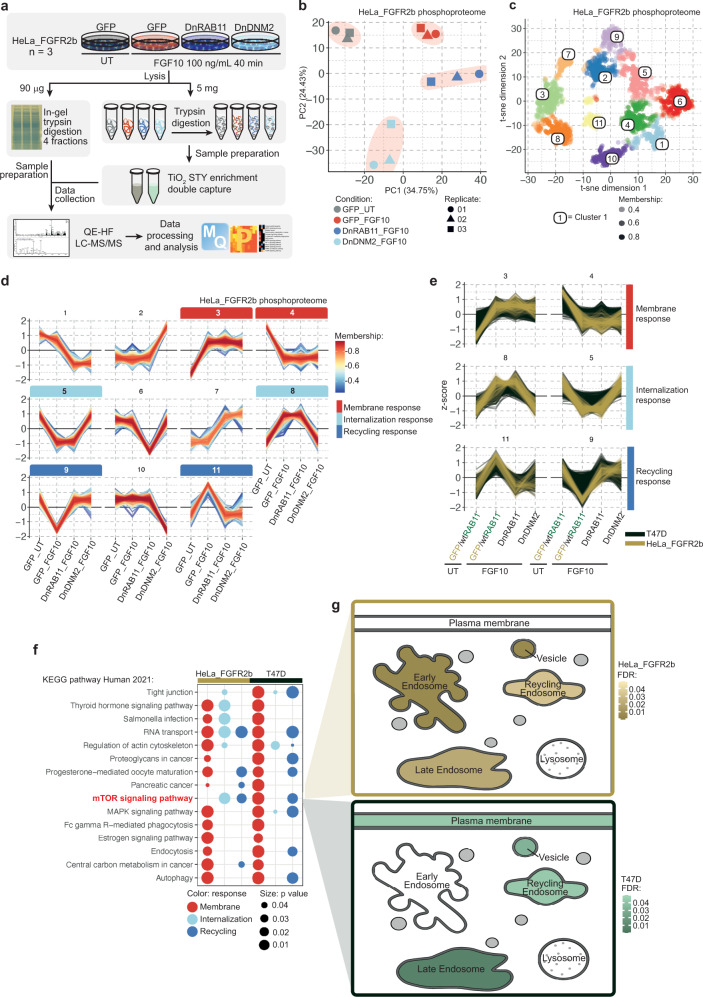
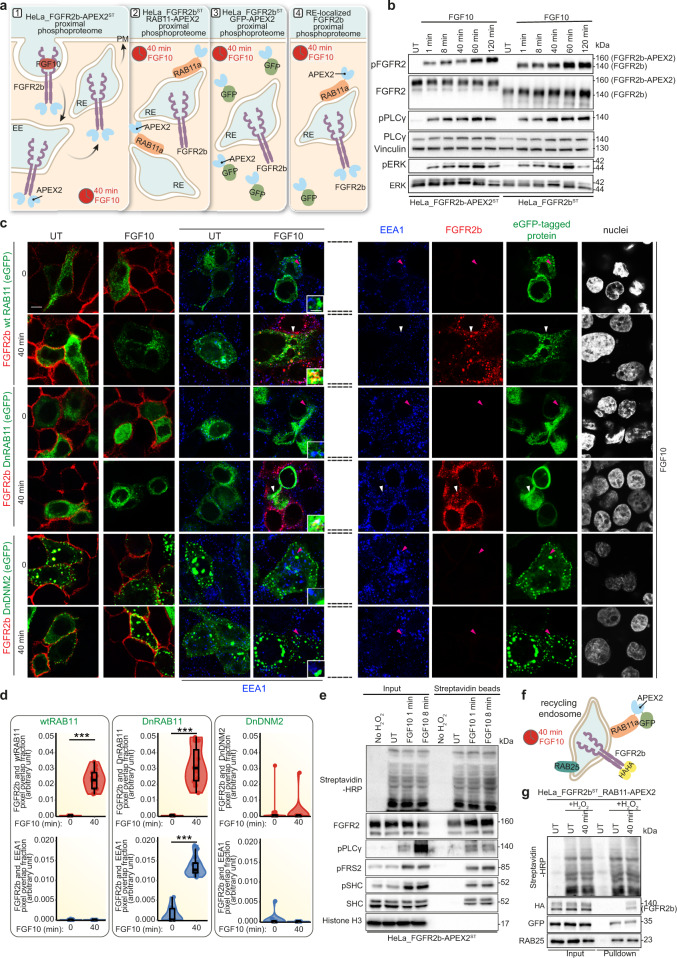
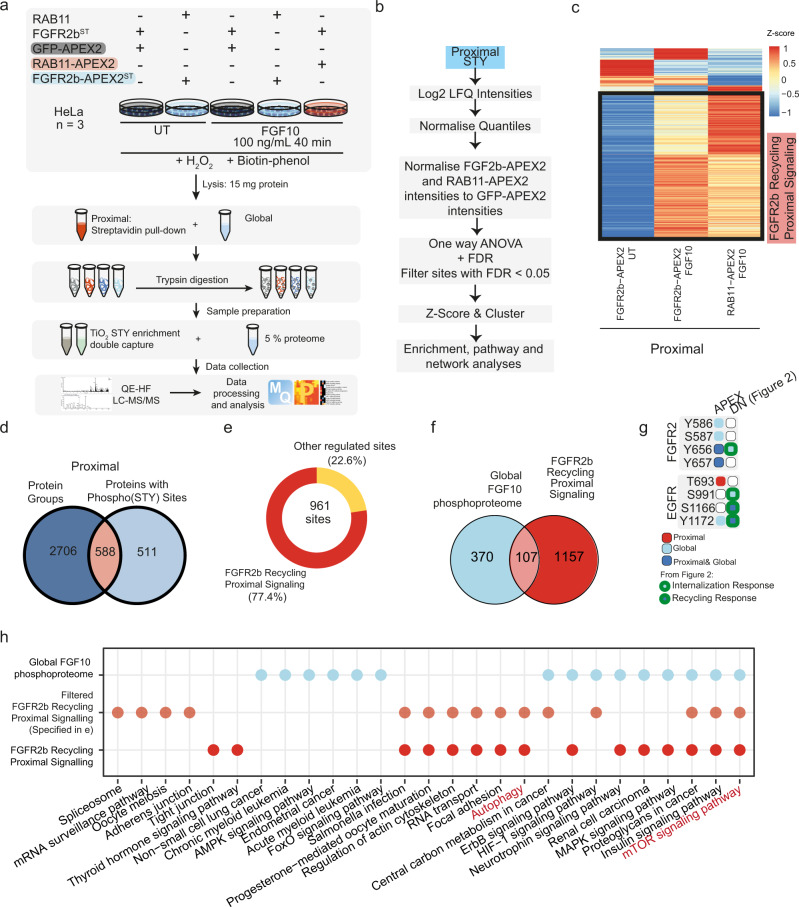
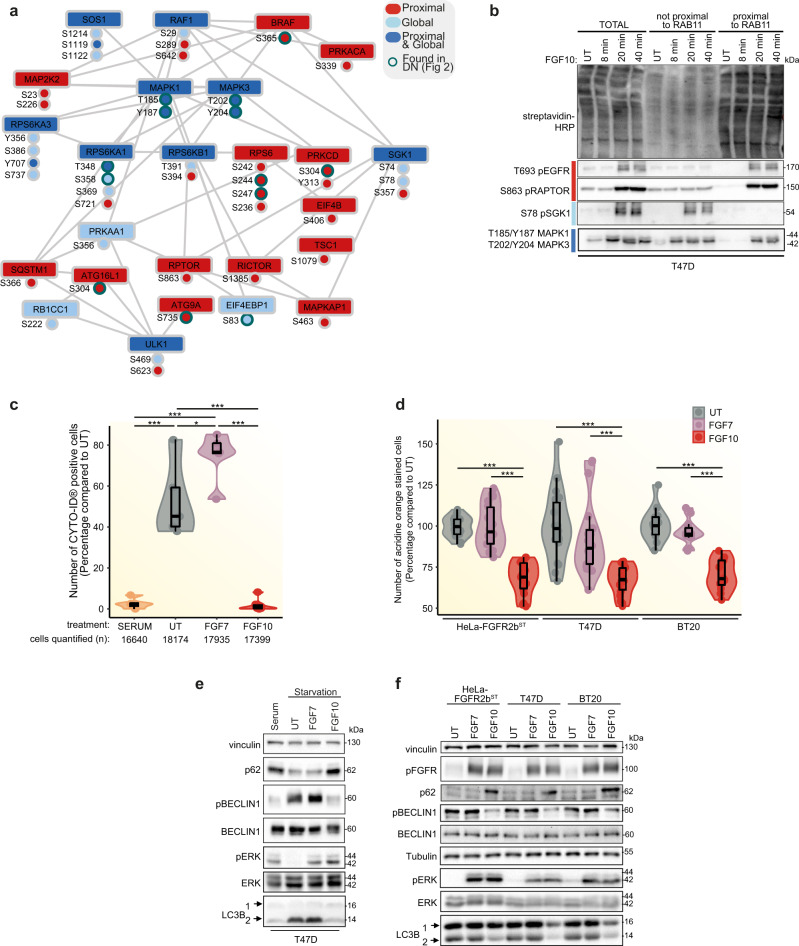
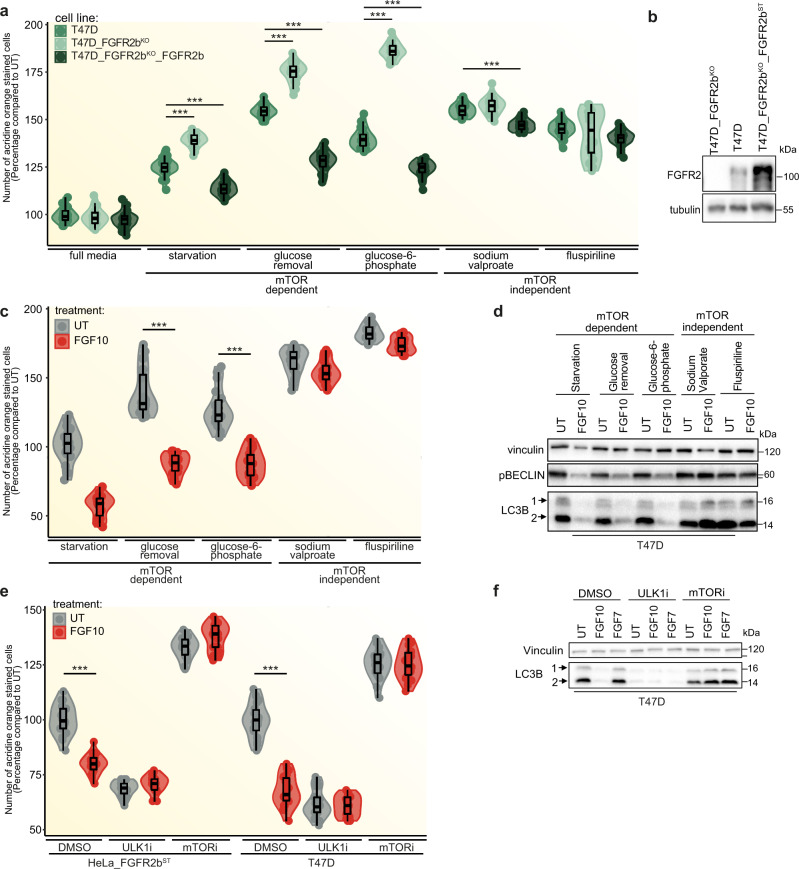
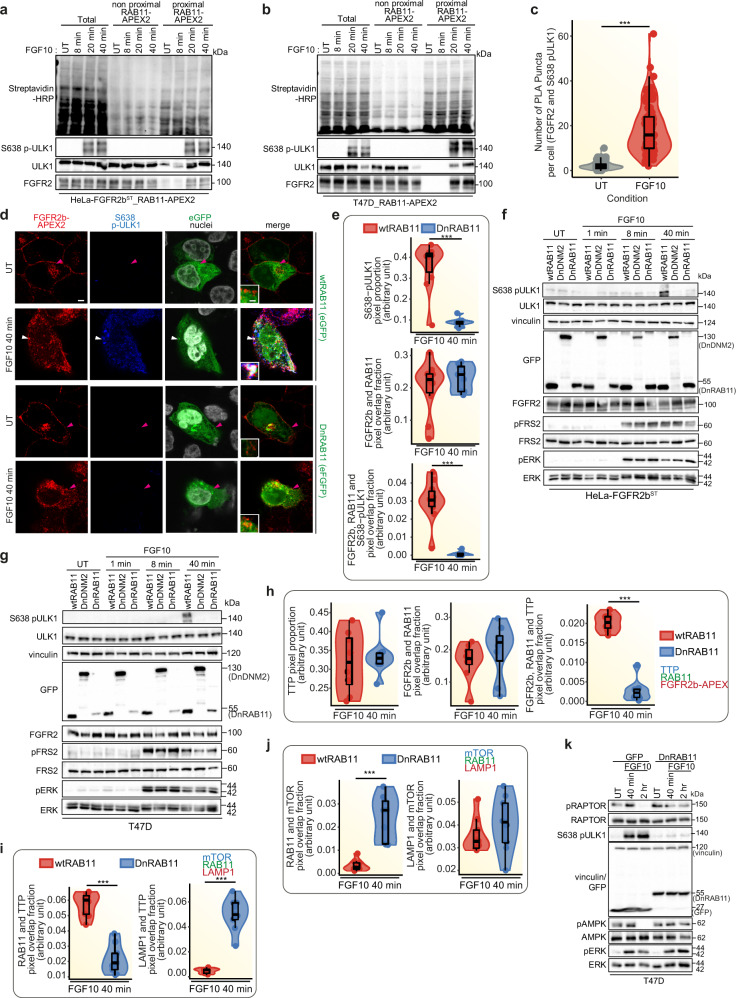
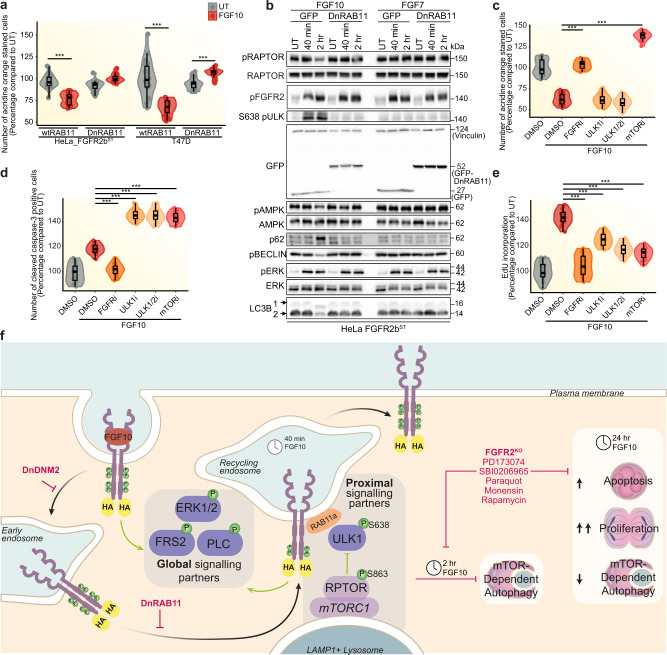
Receptor Tyrosine Kinase (RTK) endocytosis-dependent signalling drives cell proliferation and motility during development and adult homeostasis, but is dysregulated in diseases, including cancer. The recruitment of RTK signalling partners during endocytosis, specifically during recycling to the plasma membrane, is still unknown. Focusing on Fibroblast Growth Factor Receptor 2b (FGFR2b) recycling, we reveal FGFR signalling partners proximal to recycling endosomes by developing a Spatially Resolved Phosphoproteomics (SRP) approach based on APEX2-driven biotinylation followed by phosphorylated peptides enrichment. Combining this with traditional phosphoproteomics, bioinformatics, and targeted assays, we uncover that FGFR2b stimulated by its recycling ligand FGF10 activates mTOR-dependent signalling and ULK1 at the recycling endosomes, leading to autophagy suppression and cell survival. This adds to the growing importance of RTK recycling in orchestrating cell fate and suggests a therapeutically targetable vulnerability in ligand-responsive cancer cells. Integrating SRP with other systems biology approaches provides a powerful tool to spatially resolve cellular signalling.


Conflict of interest statement

The authors declare no competing interests.

Figures

Fig. 1
Fig. 1. FGFR2b activation is not affected by receptor subcellular localisation.
a Representative confocal image of the presence of FGFR2b (red) in the cytoplasm and of FGFR2b recycling to the plasma membrane in HeLa cells stably transfected with FGFR2b-HA (HeLa_FGFR2bST), expressing eGFP-RAB11a (wtRAB11), dominant negative eGFP-RAB11a_S25N (DnRAB11), or dominant negative dynamin-2_K44A-eGFP (DnDNM2) (green), and treated with FGF10 for 40 and 120 min. UT, treatment with vehicle as control). Early endosome antigen 1 (EEA1), blue. Scale bar, 5 μm. Zoomed images of the regions indicated by the arrowheads (scale bar, 50 μm) and single channels for FGF10-stimulated cells for 0, 40 and 120 min. are shown in the inset and on the right after the broken lines, respectively. White arrowheads indicate co-localisation and pink arrowheads indicate a lack of co-localisation. b Quantification of the co-localisation of stimulated FGFR2b (red pixels) with GFP-tagged proteins (green pixels) indicated by red-green pixel overlap fraction (left panel). Quantification of the co-localisation of FGFR2b (red pixels) with EEA1 (blue pixels) indicated by red-blue pixel overlap fraction (right panel). Representative images are shown in 1a. Values represent median ± SD from N = 3 independent biological replicates where we analysed between 2 and 5 cells for each N; ***p value <0.0005 (one-sided students t-test). c Immunoblot analysis (N ≥ 3 independent biological replicates) with the indicated antibodies of HeLa_FGFR2bST cells expressing GFP, DnRAB11 or DnDNM2 treated with FGF10 for 8- and 40-min. UT, treatment with vehicle as control. Source data are provided as Source Data file.
Fig. 2
Fig. 2. Phosphoproteomics analysis identifies FGFR2b internalisation- and recycling-dependent signalling pathways.
a Workflow of the phosphoproteomics experiment in HeLa cells transiently expressing FGFR2b (HeLa_FGFR2b) and either GFP, DnRAB11 or DnDNM2 and treated with FGF10 for 40 min. UT, treatment with vehicle as control. b Principal component analysis (PCA) of the HeLa phosphoproteome from 2a showed small variation between technical replicates and separated samples based on experimental conditions. c t-distributed stochastic neighbour embedding (t-sne) analysis identified 11 clusters corresponding to phosphorylated peptides differentially regulated among four conditions. Colour corresponds to the cluster with the highest membership score, determined using fuzzy c-means clustering based on the median z-score of the four conditions. Each cluster is identified by a unique colour and corresponding number. Opacity corresponds to the membership score assigned to each phosphorylated site within its most likely cluster. Membership scores and t-sne coordinates are available in Source Data File. d Plots of the median z-scored intensities of phosphorylated sites based on the 11 clusters from Fig. 2c identified membrane response (red; clusters 3 and 4), internalisation response (light blue; clusters 5 and 8), and recycling response (dark blue; clusters 9 and 11). Colour key indicates membership value assigned by Fuzzy c-means clustering. e Plots of the median z-scored intensities of phosphorylated sites based on the three main clusters identified in Fig. 2d. HeLa_FGFR2b (yellow) and T47D (dark green) were treated as in Fig. 2a and Supplementary Fig. 2h, respectively. f KEGG pathway enrichment (calculated with Fisher’s exact test and FDR adjustment) between HeLa_FGFR2b and T47D phosphorylated proteins within the membrane (red), internalisation (light blue) and recycling (dark blue) responses (Fig. 2d) identified mTOR signalling as associated with FGFR2b recycling. The size of dot indicates statistical significance based on p value. g Visualisation of the subcellular localisation of the phosphorylated proteins belonging to the mTOR signalling pathway KEGG term in HeLa_FGFR2b (yellow) and T47D (green) using SubCellularVis.
Fig. 3
Fig. 3. APEX2 tagged-FGFR2b and RAB11a identifies compartment-specific signalling partners upon FGF10 stimulation.
a Schematic underlying the spatially resolved phosphoproteomics (SRP) approach. b Immunoblot analysis (N ≥ 3 independent biological replicates) with the indicated antibodies of HeLa_FGFR2bST (right) or HeLa_FGFR2b-APEX2ST (left) stimulated with FGF10 for 1, 8, 40, 60 or 120 min. UT, treatment with vehicle as control. c Representative confocal images of FGFR2b (red) internalisation in the cytoplasm and FGFR2b recycling to the plasma membrane in HeLa_FGFR2b-APEX2ST, expressing eGFP-RAB11a (wtRAB11), dominant negative eGFP-RAB11a_S25N (DnRAB11) or dominant negative dynamin-2_K44A-eGFP (DnDNM2) (green), and treated with FGF10 for 40 min. UT, treatment with vehicle as control. Early endosome antigen 1 (EEA), blue. Scale bar, 5 μm. Zoomed images of the region indicated by the arrowheads (scale bar, 50 μm) and single channels for FGF10-stimulated cells for 0 and 40 min. are shown in the inset and on the right after the broken lines, respectively. White arrowheads indicate co-localisation and pink arrowheads indicate a lack of co-localisation. d Quantification of the co-localisation of stimulated FGFR2b (red pixels) with GFP-tagged proteins (green pixels) indicated by red-green pixel overlap fraction (top panel). Quantification of the co-localisation of FGFR2b (red pixels) with EEA1 (blue pixels) indicated by red-blue pixel overlap fraction (bottom panel). Representative images are shown in 3c. Values represent median ± SD from N = 3 independent biological replicates where we analysed between 2 and 5 cells for each N; ***p value <0.0005 (one-sided students t-test). e Immunoblot analysis (N ≥ 3 independent biological replicates) with the indicated antibodies of input or biotinylated proteins enriched with Streptavidin beads from HeLa_FGFR2b-APEXST treated with vehicle (UT), with H2O2, or with FGF10 for 1 and 8 min. f Schematic of FGFR2b localised at RAB11-positive recycling endosomes upon 40 min stimulation with FGF10. g Immunoblot analysis (N ≥ 3 independent biological replicates) with the indicated antibodies of input or biotinylated proteins enriched with Streptavidin beads from HeLa_FGFR2bST_RAB11-APEX2 stimulated with either H2O2 or with FGF10 for 40 min. UT, treatment with vehicle as control. Source data are provided as a Source Data file.
Fig. 4
Fig. 4. Spatially resolved proteomics and phosphoproteomics reveal FGFR2b-dependent regulation of mTOR signalling and autophagy.
a Workflow of the spatially resolved proteomics and phosphoproteomics experiments in HeLa cells expressing the indicated constructs. b Summarised data analysis pipeline of proximal phosphoproteome data. c Cluster analysis of the proximal phosphoproteome from the indicated conditions normalised to the proximal phosphoproteome of HeLa_FGFR2bST GFP-APEX2 for each time point. Phosphorylated sites upregulated at 40 min stimulation with FGF10 in both HeLa_FGFR2bST RAB11-APEX2 and HeLa_FGFR2b-APEX2ST RAB11 are marked as the FGFR2b Recycling Proximal Signalling Cluster. d Overlap of proteins and phosphorylated proteins detected in the proximal proteome and phosphoproteome samples, respectively. e Distribution of the phosphorylated sites, 77,4% of which were found in the FGFR2b Recycling Proximal Signalling Cluster. f Overlap between the phosphorylated sites upregulated in the global phosphoproteome upon FGF10 stimulation and the phosphorylated sites upregulated in the FGFR2b Recycling Proximal Signalling cluster from the proximal phosphoproteome (Fig. 4c). g Phosphorylated sites identified on FGFR2 and EGFR in the global (blue light) or in the proximal phosphoproteome (red) or in both (blue), and in the phosphoproteome from HeLa_FGFR2bST cells expressing GFP, GFP-DnRAB11 or GFP-DnDNM2 (Fig. 2a). Light blue with green border indicates phosphorylated sites found in internalisation response clusters and dark blue with green border indicates sites found in recycling response clusters (Fig. 2d). h KEGG pathway enrichment (calculated with Fishers Exact Test and FDR adjustment with FDR <0.005) of the phosphorylated sites found in the FGF10 global phosphoproteome (blue light), FGFR2b Recycling Proximal Signalling Cluster (red) and among the phosphorylated sites on proteins quantified at the proteome level from 4e (orange). Source data are provided as a Source Data file.
Fig. 5
Fig. 5. FGFR2b regulates mTOR signalling and autophagy from the recycling endosomes.
a Subnetwork of proteins annotated to mTOR pathway or autophagy based on KEGG analysis from Fig. 4h. Node colouring indicates whether the phosphorylated protein or the phosphorylated sites from the KEGG term ’autophagy’ were found in global, proximal phosphoproteome or both. Sites from Fig. 2d have a green border. b Immunoblot analysis (N = 3 independent biological replicates) with indicated antibodies of candidate phosphorylated proteins from the subnetwork (Fig. 5a). T47D were transfected with RAB11-APEX2 (T47D_RAB11-APEX2) stimulated with FGF10 for the indicated time points. UT, treatment with vehicle as control. Non proximal and proximal samples represent the supernatant and the pulldown following enrichment of biotinylated samples with streptavidin beads, respectively, and run against total lysates (total). c Autophagy measured using fluorescence-activated cell sorting (FACS) of T47D cells in serum, treated with vehicle (UT), FGF7 or FGF10 for 2 h. Representative images and gating are shown in Supplementary Fig. 6b–c. The number of cells counted is indicated below the graph. N = 3 independent biological replicates. p value <0.05 *, p value <0.0005 *** (one-way ANOVA with Tukey test). d Autophagy (measured by staining of autolysosomes with acridine orange) of HeLa_FGFR2bST, T47D and BT20 treated with vehicle (UT), FGF7 or FGF10. N = 3 independent biological replicates where at least six treated wells of cells were counted for each N. p value <0.001*** (one-way ANOVA with Tukey test). e Immunoblot analysis (N ≥ 3 independent biological replicates) with the indicated antibodies of the effect of serum starvation and FGF treatment on autophagic markers in T47D. LC3B 2 is the lipidated form of LC3B. Cells were treated with vehicle (UT), FGF7 or FGF10. f Immunoblot analysis (N ≥ 3 independent biological replicates) with the indicated antibodies of HeLa_FGFR2bST, T47D and BT20 treated or not with FGF7 or FGF10 for 2 h. Source data are provided as a Source Data file.
Fig. 6
Fig. 6. FGF10 regulates autophagy via FGFR2b, mTOR and ULK1.
a Autophagy measured by acridine orange staining after 2 h treatment in the indicated conditions. N = 3 independent biological replicates where at least six treated wells of cells were counted. P value <0.001*** (one-way ANOVA with Tukey test). b Immunoblot analysis (N ≥ 3 independent biological replicates) of FGFR2 expression in T47D, T47D_FGFR2bKO and T47D_FGFR2KO_FGFR2bST. c Autophagy measured by acridine orange staining after 2 h treatment of T47D cells in the indicated conditions. N = 3 independent biological replicates where at least six treated wells of cells were counted. p value <0.001*** (one-way ANOVA with Tukey test). d Immunoblot analysis (N ≥ 3 independent biological replicates) with the indicated antibodies of T47D treated for 2 h in the indicated conditions. e Autophagy measured by acridine orange staining after 2 h treatment of HeLa_FGFR2bST and T47D cells in the indicated conditions. N = 3 independent biological replicates where at least six treated wells of cells were counted. p value <0.001*** (one-way ANOVA with Tukey test). f Immunoblot analysis (N ≥ 3 independent biological replicates) with the indicated antibodies of T47D cells treated for 2 h, as indicated. Source data are provided as a Source Data file.
Fig. 7
Fig. 7. Phosphorylated ULK1 is recruited at the recycling endosomes.
a, b, f, g, k Immunoblot analysis with the indicated antibodies of HeLa_FGFR2bST_RAB11-APEX2 (a), T47D transfected with RAB11-APEX2 (T47D_RAB11-APEX2) (b), HeLa_FGFR2bST (f) or T47D (g) transfected either with wtRAB11, DnRAB11 or DnDNM2 (f, g), T47D transfected with GFP or DnRAB11 (k) stimulated with FGF10 for the indicated time points. Non proximal and proximal samples represent the supernatant and the pulldown following enrichment of biotinylated samples with streptavidin beads, respectively, and run against total lysates (total) (a, b). N ≥ 3 independent biological replicates. UT, treatment with vehicle as control. c Quantification of proximity ligation assay (PLA) puncta between FGFR2b and S638 pULK1 in HeLa_FGFR2bST cells treated with vehicle (UT) or FGF10 for 40 min.; p value <0.0005 *** (one-sided Students t-test). N = 9 independent biological replicates. d Representative confocal images of co-localisation between FGFR2b-APEX2 (red) and phosphorylated ULK1 on S638 (blue) in T47D_FGFR2KO_FGFR2b-APEXST transfected with RAB11 or GFP-DnRAB11 (green) and stimulated with FGF10 for 40 min. Scale bar, 5 µm. Inset, zoomed images of the region indicated by the arrowheads (scale bar, 50 μm). The white arrowhead indicates co-localisation, and the pink arrowheads indicate a lack of co-localisation. e, h, j, i Quantification of the presence (pixel proportion) and of the co-localisation (pixel overlap fraction) of the indicated proteins. Values represent median ± SD from N = 3 independent biological replicates where we analysed between 2 and 5 cells for each N. ***p value <0.0005 (one-sided Student t-test). Representative images are shown in Fig. 7d (e), Supplementary Fig. 7f (h), Supplementary Fig. 7g (i) and Supplementary Fig. 7h (j). Source data are provided as a Source Data file.
Fig. 8
Fig. 8. FGFR2b recycling regulates autophagy and the balance between proliferation and cell death.
a Autophagy measured by acridine orange staining of HeLa_FGFR2bST (left) or T47D (right) transfected either with wtRAB11, DnRAB11 or DnDNM2 and incubated or not with FGF10 for 2 h. N = 3 independent biological replicates where at least six treated wells of cells were counted. p value ≤ 0.001*** (one-way ANOVA with Tukey test). b Immunoblot analysis (N = 3 independent biological replicates) with the indicated antibodies of HeLa_FGFR2bST transfected either with GFP or DnRAB11 and treated with vehicle (UT) or with FGF7 and FGF10 for different time points. Measurement of autophagy by acridine orange staining (c), cell proliferation by EdU incorporation (d) and apoptosis by cleaved caspase 3 activated dye (e), in T47D treated with the FGFR inhibitor (FGFRi: PD173074), ULK1 inhibitor (ULKi: ULK101), ULK1/2 inhibitor (ULK1/2i: SBI0206965) or mTOR inhibitor (mTORi: Rapamycin), stimulated or not with FGF10 for 2 h. Data were presented as percentage compared to untreated cells. N = 3 independent biological replicates where at least six treated wells of cells were counted. p value ≤ 0.001*** (one-way ANOVA with Tukey test). f Model of FGFR2b global and proximal signalling partners during recycling to the plasma membrane. Long-term responses are indicated based on the data of this study. The black arrow indicates FGFR2b trafficking. The green arrow indicates events activated by FGFR2b regardless of its subcellular localisation. Source data are provided as a Source Data file.

References

    1. Cullen PJ, Steinberg F. To degrade or not to degrade: mechanisms and significance of endocytic recycling. Nat. Rev. Mol. Cell Biol. 2018;19:679–696. - PubMed
    1. Goh LK, Sorkin A. Endocytosis of receptor tyrosine kinases. Cold Spring Harb. Perspect. Biol. 2013;5:a017459. - PMC - PubMed
    1. MacDonald E, Savage B, Zech T. Connecting the dots: combined control of endocytic recycling and degradation. Biochem. Soc. Trans. 2020;48:2377–2386. - PMC - PubMed
    1. Hsu VW, Bai M, Li J. Getting active: protein sorting in endocytic recycling. Nat. Rev. Mol. Cell Biol. 2012;13:323–328. - PubMed
    1. Sigismund S, Lanzetti L, Scita G, Di Fiore PP. Endocytosis in the context-dependent regulation of individual and collective cell properties. Nat. Rev. Mol. Cell Biol. 2021;22:625–643. - PubMed

Publication types

MeSH terms

Substances