. 2022 Nov 3;12(1):18628.
doi: 10.1038/s41598-022-21249-6.

Increased autophagy leads to decreased apoptosis during β-thalassaemic mouse and patient erythropoiesis

Affiliations

Increased autophagy leads to decreased apoptosis during β-thalassaemic mouse and patient erythropoiesis

Pornthip Chaichompoo et al. Sci Rep. .

Abstract

β-Thalassaemia results from defects in β-globin chain production, leading to ineffective erythropoiesis and subsequently to severe anaemia and other complications. Apoptosis and autophagy are the main pathways that regulate the balance between cell survival and cell death in response to diverse cellular stresses. Herein, the death of erythroid lineage cells in the bone marrow from both βIVS2-654-thalassaemic mice and β-thalassaemia/HbE patients was investigated. Phosphatidylserine (PS)-bearing basophilic erythroblasts and polychromatophilic erythroblasts were significantly increased in β-thalassaemia as compared to controls. However, the activation of caspase 8, caspase 9 and caspase 3 was minimal and not different from control in both murine and human thalassaemic erythroblasts. Interestingly, bone marrow erythroblasts from both β-thalassaemic mice and β-thalassaemia/HbE patients had significantly increased autophagy as shown by increased autophagosomes and increased co-localization between LC3 and LAMP-1. Inhibition of autophagy by chloroquine caused significantly increased erythroblast apoptosis. We have demonstrated increased autophagy which led to minimal apoptosis in β-thalassaemic erythroblasts. However, increased PS exposure occurring through other mechanisms in thalassaemic erythroblasts might cause rapid phagocytic removal by macrophages and consequently ineffective erythropoiesis in β-thalassaemia.


Conflict of interest statement

The authors declare no competing interests.

Figures

Figure 1
Figure 1
Elevated PS-bearing basophilic erythroblasts with no increased apoptosis in β-thalassaemic mice. Apoptotic markers were examined in bone marrow erythroid cells from β-thalassaemic mice (654) and wild type mice (WT). (AE) Whole bone marrow samples were analysed for apoptotic markers in erythroid cells using flow cytometry. (A) Definition of flow cytometric erythroblast subsets. Bone marrow cells labeled with monoclonal antibodies specific to TER119 and CD71 and further analysed with respect to their forward scatter (FSC-H) (Supplementary Table 1). TER119+ erythroid cells in the R1 region were divided into two subpopulations TER119dimCD71+ erythroblasts (R2 region, proerythroblasts as majority as demonstrated in previous study) and TER119high erythroid cells (R3 region). Subsequently the R3 region was divided into a R4 region (basophilic erythroblasts as the majority cell type), a R5 region (polychromatophilic erythroblasts as the majority cell type), a R6 region (orthochromic erythroblasts and reticulocytes as the majority cell types) and an R7 region (red blood cells as the majority cell type) using CD71/FSC-H. The percentages of erythroid differentiation were analysed using a BD FACSCalibur flow cytometer and CellQuest Pro™ software (BD Biosciences). Percentages of (B) PS exposure (annexin V+ cells), (C) mitochondrial transmembrane potential (DiOC6(3)+ cells), (D) activated caspase 9, measured by Red-LEHD-FMK staining in living cells, and (E) activated caspase 8, measured by FITC-IETD-FMK staining in living cells, in each erythroblast subpopulation were examined (Supplementary Figs. S1 and S2). Unstained murine bone marrow cells were examined as a negative control. Hydrogen peroxide (H2O2)-treated K562 erythroleukemic cells were used as a positive control. Data are presented as mean ± S.D. *Significant difference when compared to wild type mice at P < 0.05, using Mann–Whitney U test. (F) Western blot analysis of cleaved caspase 3 in CD45-CD71+ bone marrow erythroblasts (Supplementary Fig. S3). The purity of CD45-CD71+ bone marrow erythroblasts was 73–91% as measured by flow cytometry. Cisplatin-treated CD45-CD71+ bone marrow erythroblasts were used as a positive control.
Figure 2
Figure 2
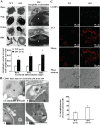
Elevated autophagy in β-thalassaemic erythroblasts. (A) Increased autophagic vacuoles in murine β-thalassaemic erythroblasts. Ultrastructural analysis of murine CD45 bone marrow erythroid cells from β-thalassaemic mice (654, middle column) and wild type mice (WT, left column) were evaluated for autophagic vacuoles (arrow) in erythroid subpopulations using transmission electron microscope. High magnification of electron micrographs from basophilic erythroblasts of β-thalassaemic mice is shown in the right-column. The illustration was captured and analysed for the area of the individual autophagic vacuole and total cytoplasmic area using Scion Image software. Quantitative analysis of autophagic vacuole area per total cytoplasmic area ratio is presented as mean ± SEM. *Significantly different when compared to wild type mice at P < 0.05, using T-test. N, nucleus; M, mitochondria; Baso, basophilic erythroblasts; Poly, polychromatophilic erythroblasts; Ortho, orthochromatic erythroblasts and RBC; red blood cells. (B) Localization of LC3 in autophagosomes as determined by immunogold electron microscope. CD45 bone marrow erythroid cells from β-thalassaemic mice were stained with LC3 using an immunogold assay to determine LC3 (arrow) in the membrane of autophagosomes in (a) unstained CD45 bone marrow cells, (b) basophilic erythroblasts, (c) polychromatophilic erythroblasts and (d) RBC. N; nucleus, M; mitochondria. (C) Increased autophagy in murine β-thalassaemic erythroblasts was determined by confocal microscopy. Analysis of LAMP-1 (green) and LC3 (red) in CD45 bone marrow erythroid cells from β-thalassaemic mice (654, right-column) and wild type mice (WT, left-column) was undertaken using a confocal microscope. Number of autophagosomes positive erythroblasts was determined by LC3 puncta and calculated as percentages of autophagic cells in total erythroid cells (Supplementary Fig. S4). Data are presented as mean ± S.D. *Significantly different when compared to wild type mice at P < 0.05, using T-test.
Figure 3
Figure 3
Inhibition of autophagy accelerates apoptotic cell death. CD45CD71+bone marrow erythroblasts from β-thalassaemic mice (654) and wild type mice (WT) were incubated with or without the presence of 100 μM chloroquine (CQ) to inhibit autophagic flux at 37 °C, 5% CO2. Untreated CD45CD71+ bone marrow erythroblasts were cultured in IMDM media supplemented with 20%FBS at 37 °C, 5% CO2 for 3 and 24 h as a control. (A) Increased LC3-II levels after inhibiting autophagic flux with chloroquine. LC3-I and LC3-II expression in untreated and chloroquine-treated CD45CD71+ bone marrow erythroblasts at 3 h. after treatment were determined using western blot analysis (Supplementary Fig. S5). LC3-I and LC3-II expression were normalised with β-actin, then, the ratio of LC3-I and LC3-II was calculated. (B) Inhibition of autophagic flux leads to increased cleavage of caspase 3. Cleaved caspase 3 and procaspase 3 at 3 h. after chloroquine treatment of CD45CD71+ bone marrow erythroblasts were determined by western blot analysis (Supplementary Fig. S6). Cleaved caspase 3 expression was normalised with β-actin, then the ratio of cleaved caspase 3 in chloroquine-treated erythroblasts was normalised with the individual untreated erythroblasts. (C) Increased annexin V+ erythroblasts after autophagic flux inhibition. The percentages of PS-bearing CD45CD71+ bone marrow erythroblasts were determined at 24 h after chloroquine treatment using fluorochrome conjugated annexin V and flow cytometry. Data are presented as mean ± S.D. *Significantly different when compared between groups at P < 0.01, using T-test. **Significantly different when compared between groups at P < 0.05, using T-test.
Figure 4
Figure 4
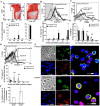
Elevated PS-bearing erythroblasts and autophagy without increased apoptosis in bone marrow of β-thalassaemia/HbE patients. (AD) Apoptotic markers were examined in whole bone marrow erythroid cells from β-thalassaemia/HbE patients using flow cytometry. (A) Definition of flow cytometric erythroblast subsets. Bone marrow cells were labeled with monoclonal antibodies specific to glycophorin A (GPA, an erythroid cell marker) and CD71 and further analysed with respect to their forward scatter (FSC-H) (Supplementary Table 1). GPA+ erythroid cells in the R1 region were divided into two subpopulations as GPAdimCD71+ erythroblasts in the R2 region (proerythroblasts as the majority cell type) and GPAhigh erythroid cells (R3 region). Then, the R3 region was divided into a R4 region (basophilic erythroblasts as the majority cell type), a R5 region (polychromatophilic erythroblasts as the majority cell type), a R6 region (orthochromic erythroblasts and reticulocytes as the majority cell types) and a R7 region (red blood cells as the majority cell type) using CD71/FSC-H. The percentages of erythroid differentiation were analysed using a BD FACSCalibur flow cytometer and CellQuest Pro™ software. Percentages of (B) PS exposure (annexin V+ cells), (C) mitochondrial transmembrane potential (TMRE+ cells) were determined, and (D) activated caspase 3, as assessed by intracellular staining using a PE conjugated anti-human active caspase 3 antibody, in each erythroblast subpopulation was determined (Supplementary Fig. S7). Unstained human bone marrow cells were used as a negative control to determine annexin V and TMRE signal. Human bone marrow cells were treated with 100 μM carbonyl cyanide 3-chlorophenylhydrazone (CCCP) for 30 min at 37 °C, 5% CO2 to directly disrupt mitochondrial transmembrane potential. Human bone marrow cells treated with 193.8 mM hydrogen peroxide (H2O2) for 15 min at 37 °C, 5% CO2 were used as a positive control for activated caspase 3. Human bone marrow cells stained with an isotype control were used as a negative control for determining activated caspase 3. (E) Co-localization of LC3 (red) and LAMP-1 (green) in CD45 human bone marrow erythroblasts was analyzed. DAPI (blue) was used as nucleus marker. The purity of human CD45 bone marrow erythroblasts was 45–70% as measured by flow cytometry. The LAMP1 unstained cells were lymphocytes, which were excluded from the analysis (Supplementary Fig. S8). (F) The percentages of autophagic cells as Pearson’s correlation coefficient between LC3 and LAMP-1 at cut-off ≥ 0.5 were calculated (Supplementary Fig. S9). The data are presented as mean ± S.D. *Significantly different when compared to wild type mice at P < 0.01, using Mann–Whitney U test. **Significantly different when compared to wild type mice at P < 0.05, using Mann–Whitney U test.

References

    1. Taher AT, Musallam KM, Cappellini MD. β-Thalassemias. N. Engl. J. Med. 2021;384:727–743. - PubMed
    1. Pootrakul P, et al. A correlation of erythrokinetics, ineffective erythropoiesis, and erythroid precursor apoptosis in thai patients with thalassemia. Blood. 2000;96:2606–2612. - PubMed
    1. Centis F, et al. The importance of erythroid expansion in determining the extent of apoptosis in erythroid precursors in patients with β-thalassemia major. Blood. 2000;96:3624–3629. - PubMed
    1. Mathias LA, et al. Ineffective erythropoiesis in β-thalassemia major is due to apoptosis at the polychromatophilic normoblast stage. Exp. Hematol. 2000;28:1343–1353. - PubMed
    1. Yuan J, et al. Accelerated programmed cell death (apoptosis) in erythroid precursors of patients with severe β-thalassemia (Cooley's anemia) Blood. 1993;82:374–377. - PubMed

Publication types