. 2022 Nov 3;12(1):18580.
doi: 10.1038/s41598-022-14510-5.

Effects of vessel traffic and ocean noise on gray whale stress hormones

Affiliations

Effects of vessel traffic and ocean noise on gray whale stress hormones

Leila S Lemos et al. Sci Rep. .

Abstract

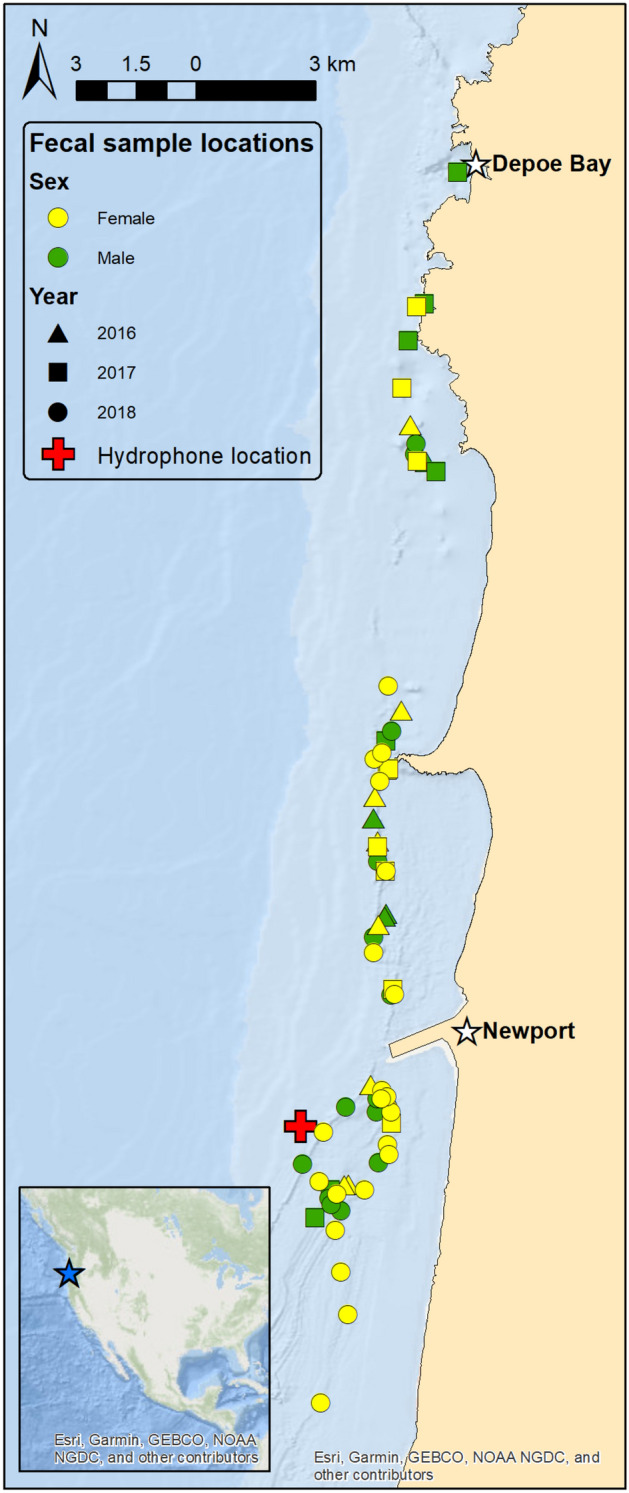
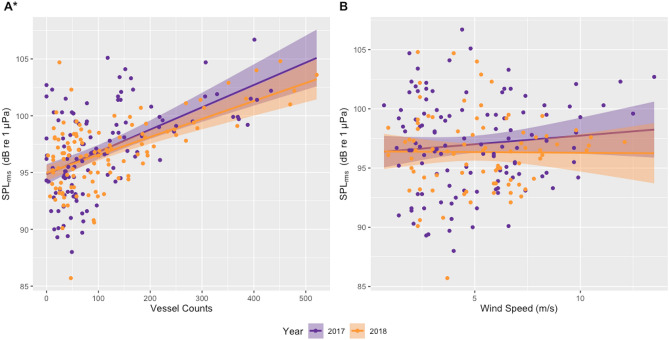
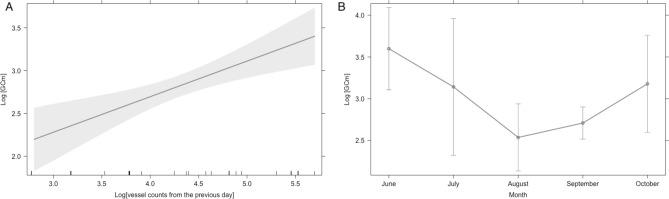
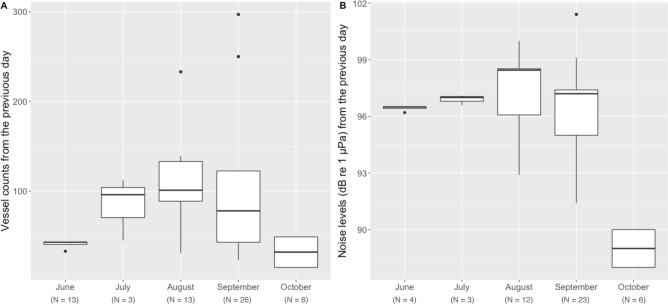
Human use of marinescapes is rapidly increasing, especially in populated nearshore regions where recreational vessel traffic can be dense. Marine animals can have a physiological response to such elevated human activity that can impact individual health and population dynamics. To understand the physiological impacts of vessel traffic on baleen whales, we investigated the adrenal stress response of gray whales (Eschrichtius robustus) to variable vessel traffic levels through an assessment of fecal glucocorticoid metabolite (fGC) concentrations. This analysis was conducted at the individual level, at multiple temporal scales (1-7 days), and accounted for factors that may confound fGC: sex, age, nutritional status, and reproductive state. Data were collected in Oregon, USA, from June to October of 2016-2018. Results indicate significant correlations between fGC, month, and vessel counts from the day prior to fecal sample collection. Furthermore, we show a significant positive correlation between vessel traffic and underwater ambient noise levels, which indicates that noise produced by vessel traffic may be a causal factor for the increased fGC. This study increases knowledge of gray whale physiological response to vessel traffic and may inform management decisions regarding regulations of vessel traffic activities and thresholds near critical whale habitats.


Conflict of interest statement

The authors declare no competing interests.

Figures

Figure 1
Figure 1
Location of field site off the central Oregon, USA coast (blue star on inset map), hydrophone deployment site (red cross), and gray whale fecal sample collections symbolized by color and shape to represent sex and year. The ports of Newport and Depoe Bay are represented by white stars. The Newport white star is also representing the anemometer station (NPOW3) from which the wind speed data were retrieved from. Figure created in ArcGIS software (version 10.8).
Figure 2
Figure 2
Linear correlations between noise levels (daily median root mean square [rms] sound pressure level [SPL] in dB [re 1 μPa]; 50–1000 Hz) recorded on a hydrophone deployed outside the Newport harbor entrance during June to October of 2017 and 2018 and (A) vessel counts in Newport and Depoe Bay, Oregon, USA, and (B) daily median wind speed (m/s) from an anemometer station located on South Beach, Newport, Oregon, USA (station NWPO3). Asterisk indicates significant correlations between SPL and vessel counts in both years.
Figure 3
Figure 3
Median noise levels (root mean square sound pressure levels—SPLrms) for each hour of each day recorded on a hydrophone (50–10,000 Hz) deployed outside the Newport harbor entrance during June to October of 2017 (middle plot) and 2018 (upper plot), and hourly median noise level (SPL) against hourly median wind speed (lower plot) from an anemometer station located on South Beach, Newport, Oregon, USA (station NWPO3) over the same time period.
Figure 4
Figure 4
(A) The effect of vessel counts in Newport and Depoe Bay (Oregon, USA) on the day previous to fecal sample collection on gray whale fecal glucocorticoid metabolite (fGC) concentrations, derived from linear mixed model results with whale identification as random effect (Table 2; Model 2). (B) The effect of month on the gray whale fecal glucocorticoid metabolite (fGC) concentrations, also derived from linear mixed model results with whale identification as random effect (Table 2; Model 2). Data collected between May and October of 2016, 2017 and 2018. Asterisk indicates significant correlations between the variables in both A and B. Note difference in axes scales between A and B.
Figure 5
Figure 5
Boxplots displaying the variation in (A) vessel counts in Newport and Depoe Bay (Oregon, USA) on the day previous to fecal sample collection on gray whale fecal glucocorticoid metabolite (fGC), and (B) noise levels (daily median SPLrms, in dB [re 1 μPa]; 50 Hz - 1,000 Hz) recorded on a hydrophone deployed outside the Newport harbor entrance on the day previous to fecal sample collection summarized by month during 2017 and 2018. The boxplot upper and lower limits represent the 25% and 75% quantiles, the mid-lines indicate the medians, the whiskers represent minimum and maximum values (range), and the dots indicate outliers.

References

    1. McDonald MA, Hildebrand JA, Wiggins SM. Increases in deep ocean ambient noise in the Northeast Pacific west of San Nicolas Island, California. J. Acoust. Soc. Am. 2006;120:711–718. - PubMed
    1. Kaplan MB, Solomon S. A coming boom in commercial shipping? The potential for rapid growth of noise from commercial ships by 2030. Mar. Policy. 2016;73:119–121.
    1. McCarthy E. International regulation of underwater sound: establishing rules and standards to address ocean noise pollution. Kluwer Academic Publishers; 2004.
    1. Weilgart LS. The impacts of anthropogenic ocean noise on cetaceans and implications for management. Can. J. Zool. 2007;85:1091–1116.
    1. Bas AA, et al. Marine vessels alter the behaviour of bottlenose dolphins Tursiops truncatus in the Istanbul Strait, Turkey. Endanger. Species Res. 2017;34:1–14.

Publication types

Substances