. 2022 Nov 3;13(1):6614.
doi: 10.1038/s41467-022-34402-6.

Tumor suppressor mediated ubiquitylation of hnRNPK is a barrier to oncogenic translation

Affiliations

Tumor suppressor mediated ubiquitylation of hnRNPK is a barrier to oncogenic translation

Bartosz Mucha et al. Nat Commun. .

Abstract

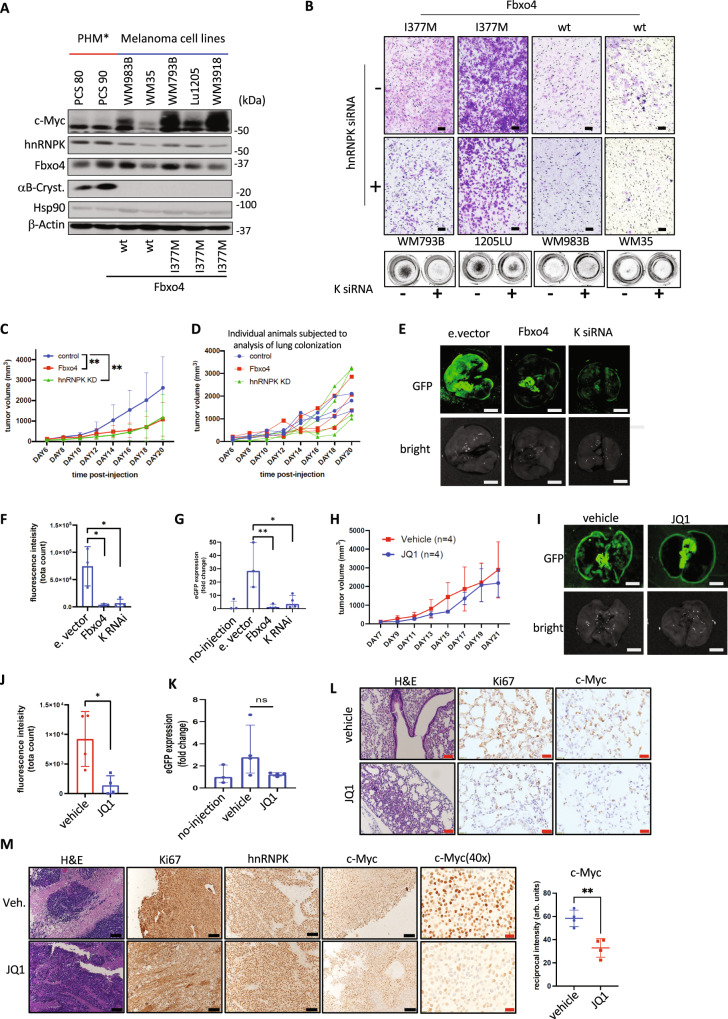
Heterogeneous Nuclear Ribonucleoprotein K (hnRNPK) is a multifunctional RNA binding protein (RBP) localized in the nucleus and the cytoplasm. Abnormal cytoplasmic enrichment observed in solid tumors often correlates with poor clinical outcome. The mechanism of cytoplasmic redistribution and ensuing functional role of cytoplasmic hnRNPK remain unclear. Here we demonstrate that the SCFFbxo4 E3 ubiquitin ligase restricts the pro-oncogenic activity of hnRNPK via K63 linked polyubiquitylation, thus limiting its ability to bind target mRNA. We identify SCFFbxo4-hnRNPK responsive mRNAs whose products regulate cellular processes including proliferation, migration, and invasion. Loss of SCFFbxo4 leads to enhanced cell invasion, migration, and tumor metastasis. C-Myc was identified as one target of SCFFbxo4-hnRNPK. Fbxo4 loss triggers hnRNPK-dependent increase in c-Myc translation, thereby contributing to tumorigenesis. Increased c-Myc positions SCFFbxo4-hnRNPK dysregulated cancers for potential therapeutic interventions that target c-Myc-dependence. This work demonstrates an essential role for limiting cytoplasmic hnRNPK function in order to maintain translational and cellular homeostasis.


Conflict of interest statement

The authors declare no competing interests.

Figures

Fig. 1
Fig. 1. hnRNPK is a SCFFbxo4 target.
A The flow of genomic analysis. B Volcano plots representing genes differentially regulated upon Fbxo4 knock-out at the total mRNA level (RNA) and mRNA protected by ribosomes (RPF), p values were generated by DESeq2 applying the Wald test followed by Benjamini and Hochberg method correction; genes with p < 0.05 and 2<fold upregulated are represented by red dots, genes with p < 0.05 and 2<fold downregulated are represented by green dots, genes with p < 0.05 and 2 > fold up or downregulated represented by blue dots, all remaining genes are represented by black dots. C Genes up or down regulated by twofold change and adj. p value < 0.05 (identified in B) in Fbxo4-deficient MEFs were subjected to analysis of putative RBP-binding site instances with the use of oRNAment tool, D the localization of identified motifs is presented on the wheel graph. E Peptide recovery from mass-spec of RBPs coprecipitated with Fbxo4 performed previously. F summary of oRNAment analysis top scores of KH-domain RBPs. G Fbxo4-dependent RNA and RPF targets were compared with the hnRNPK target reported in the Encyclopedia of RNA Interactome data base (Encori, https://starbase.sysu.edu.cn/; data parameters-—RBP=hnRNPK, genome=human, assembly=GRCh37-hg19, stringency=2). H Endogenous hnRNPK co-purifies with Fbxo4 in HEK293T cells, Fxr1 is presented as a positive control.
Fig. 2
Fig. 2. SCFFbxo4 catalyzes hnRNPK ubiquitylation in vivo and in vitro.
A In vivo and B in vitro polyubiquitylation of hnRNPK is achieved by full-length Fbxo4 but not catalytically deficient Fbxo4 with the deletion of F-box cassette. C In vitro ubiquitylation reaction with the use ubiquitin molecules retaining K48 or K63 only indicates dominant presence of K-63 linked polyubiquitin chains. D In vivo (performed in HEK293T cells) and in vitro ubiquitylation assay with single lysine retaining ubiquitin mutants (K63 or K48) or no-lysine mutant K0 as a background control. E Amino acid sequence alignment between known Fbxo4 target—cyclin D1 and hnRNPK revealed 10 aa fragment that overlaps with the D1 degron cassette. Identified fragment of high similarity and identity is flanked by two lysines. F, G Substitution of hnRNPK K21 and K34 reduced ubiquitylation significantly in vitro in 293T cells (F) and in vivo (G). H In vivo ubiquitylation assay in HEK293T cells after cytosolic/nuclear fractionation. SCFFbxo4-dependent hnRNPK polyubiquitylation is maintained in the cytoplasm.
Fig. 3
Fig. 3. SCFFbxo4–hnRNPK controls c-Myc synthesis and affects the genomic landscape.
A GSEA analysis of mRNA dysregulated in Fbxo4−/− cells reveals c-Myc signature. B Fbxo4−/− MEFs express a high level of c-Myc which is attenuated by hnRNPK depletion. C Re-introduction of Fbxo4 to Fbxo4−/− MEFs rescues c-Myc protein levels. Signal intensity for c-Myc was adjusted to Hsp90. D MEFs were subjected to ribosome profiling and RNAseq in the following genetic conditions: (i) MEFwt, (ii) MEFFbxo4−/−, (iii) MEFwt + hnRNPK RNAi, (iv) MEFFbxo4−/− + hnRNPK RNAi. Conditions ii–iv were compared to (i) MEFwt and summarized as scatter plot to express changes in translation efficiency, number of events occurred were presented in the pie charts. E The SCFFbxo4-hnRNPK dependent targets were selected based on the following criteria: (I) 2-fold up or down regulated in MEF;Fbxo4−/− (II) rescued by >25% in MEFFbxo4−/− + hnRNPK knock-down; (III) regulated in MEFwt + hnRNPK knock-down in the opposite direction to MEFFbxo4−/− or had no effect; blue dots represent c-Myc putative targets (detailed list is presented in Supplementary Data 1). F Regulation of c-Myc in different SCFFbxo4/hnRNPK setting compared to MEFwt. G Comparison of RPF readouts across c-Myc transcript quantified as a normal reads per nucleotide; arrows indicate translation start (green) and stop sites (yellow). HJ Bi-cistronic luciferase reporter system was used to evaluate c-Myc IRES activity (ECMV IRES- luciferase signal positive control; hairpin - negative control) in NIH3T3 cells. K CHX-driven depletion followed by release with proteasome inhibitor to compare c-Myc synthesis rate in MEFFbxo4−/− versus MEFwt. L Subsequent evaluation of hnRNPK ubiquitylation and c-Myc synthesis rate was performed in HEK293T cells. M RNA immunoprecipitation assay followed by qPCR (MEF cells). The data in I, M represents mean ± SD and was analyzed by two-tailed Student’s t test (n = 3). The data in J represents mean ratio (control/Fbxo4) and was compared by ratio paired Student’s t test (n = 4). In E, all selected targets MEFFbxo4−/− versus MEFwt complied with adj. p value <0.05 for either RNA and RPF, the rescue comparisons were included based on the fold change. Data presented in the A, DG is based on the RNA-seq and Ribo-seq data run in biological duplicates. Exact p values from left to right, I p = 0.0084, p = 0.0320; J p = 0.0036, p = 0.0096, p = 0.3182; M p = 0.0034, p = 0.0419.
Fig. 4
Fig. 4. SCFFbxo4 – hnRNPK – c-Myc axis regulates cell invasion and motility.
A, B The population of targets identified in Fig. 3E was subjected to functional analysis by KEGG and Gene Ontology- biological process annotation (GO_BP). Data was evaluated by Fisher’s exact test p < 0.01 are considered significant. C Representative images of cell invasion through extracellular matrix in Fbxo4 deficient cells with or without hnRNPK RNAi depletion; D Boyden chamber images and quantification of invasion assay from C. E Representative images from invasion assay and western blot showing the effect of c-Myc siRNA-mediated knock down on MEFFbxo4−/− cells invasiveness. F Quantification of E expressed as a mean cell number. G, H present tracks of individual cells in cell tracking assay. Red paths indicate on cells moving <0.25 μm/min I Quantification of motility in covered Euclidean distance. The data from invasion experiments (D, F) represents mean ± SD and was analyzed by two-tailed Student’s t test (Dn = 4, Fn = 3). In cell motility assay, 149/150 cells were tracked per condition in three biologically independent experiments (49 or 50 cells/experiment). Data represents median with 95% CI and were compared by two-tailed Student’s t test. *p < 0.05, **p < 0.01, ***p < 0.001, ****p < 0.0001. Scale bars C, E—100 μm. Exact p values from up to down: D p = 0.0006, p = 0.026, p = 0.3892; F p = 0.0023; (I) p = <0.0001 (both).
Fig. 5
Fig. 5. SCFFbxo4-hnRNPK axis contributes to melanoma progression.
A c-Myc protein in multiple melanoma cell lines in comparison to normal primary human melanocytes. B Representative pictures of trans-well invasion assay on melanoma cell lines in the context of Fbxo4 (I377M mutant vs wt) and hnRNPK (hnRNPK vs control siRNA) status. C The average tumor volume increase across the time is in melanoma allograft model with subcutaneously injected B16F10 cells modified by (i) overexpression of Fbxo4/aB-Crystallin, (ii) hnRNPK knock-down or (iii) control cells. D Dynamics of tumor volume increase in mice chosen for lung colonization assessment. E Lung colonization was measured by detection of GFP signal with background normalization to non-injected mice, F fluorescence intensity was quantified by average signal from 3 non-overlapped spots. G Expression of GFP was confirmed by qPCR performed on total mRNA lung extract from lung tissue compared to mRNA isolated from non-injected mice. H Tumor volume increase in B16F10 melanoma allograft model upon transcriptional depletion of c-Myc by administration of BRD2/4 inhibitor, JQ1. I, J show representative pictures of GFP signal presented in and its quantification analogically to E, F. K Quantification of eGFP mRNA level in JQ1 treatment as an indicator of lung colonization compared to mice treated with vehicle. L Representative pictures of Ki67 and c-Myc IHC staining on lung from JQ1 treatment experiment. M Histological analysis of primary tumor from JQ1 treatment experiment; graph represent quantification of DUB signal from c-Myc staining. All data represents mean ±SD and was analyzed by Two-way ANOVA with Geisser–Greenhouse correction (C, H; n = 10 and 4, respectively) or two-way Student’s t test (F, G, I, K), *p < 0.05, **p < 0.01. Analysis of F and J was done on n = 3 for empty vector, n = 3 for Fbxo4 OE, and n = 4 for K RNAi. Analysis of J and K was run on n = 4 for vehicle and JQ1 treated group. C-Myc quantification (M) was done on 3 representative picture ×40 from each staining using ImageJ and reciprocal intensity approach (maximum intensity—measured intensity; arb.units.—arbitrary unit. Scale bars: black—100 μm, red—20 μm. Exact p values from up to down: C p = 0.0098, p = 0.0071; F p = 0.0229, p = 0.0275; G p = 0.0270, p = 0.0088; H p = 0.3519; J p = 0.0365; K p = 0.0552; M p = 0.0033.
Fig. 6
Fig. 6. SCFFbxo4-hnRNPK regulation is impaired in human cancers.
A Fxr1 and Fbxo4 are mutual negative regulators. B GTEx and TCGA data shows increased Fxr1 expression in melanoma. CRYAB expression in TCGA SKCM (n = 558) compared to the normal (n = 461, TCGA and GTEX) generated in the GEPIA2 tool. Both groups were compared by one-way ANOVA. Boxplot center represents median, bounds represent 25 and 75%, and whiskers show the minimum or maximum no further than 1.5 times interquartile range from the bound. C Gene copy variation of CRYAB (αB-Crystallin protein coding) from TCGA database analyzed by NIH Genomic Data Commons Portal v1.28.0 (https://portal.gdc.cancer.gov/). DF Immunohistochemical staining of melanoma and normal skin TMA with anti-Fbxo4, αB-Crystallin, hnRNPK antibodies. G Immunofluorescence staining of melanoma and normal skin TMA presented as a mean fluorescence intensity ±SD from 200 randomly selected cells/individual and statistically compared by two-tailed Student’s t test (normal/cancer n = 15/88). H, I Oncomine data base shows expression and copy number variation of Fxr1 in esophageal squamous cell carcinoma (reported by Su et al. and Hu et al.); JM Immunohistochemical staining of ESCC and adjacent tissue TMA with anti-Fbxo4, and αB-Crystallin, c-Myc, hnRNPK antibodies. In IHC quantification of all TMAs the 0–3 scale was applied (0—negative staining, 1—low, 2—med, 3—high); results were summarized in violin plots presenting distribution of score and analyzed statistically by non-parametric two-tailed Mann–Whitney test (control/cancer; D, E—n = 18/91; F—n = 18/91; J, Mn = 50/50; K, Ln = 50/50). *p < 0.05, **p < 0.01, ***p < 0.001, ****p < 0.0001. Scale bars: black 50 μm; red 200 μm. Exact p values: D p = 0.0023; E p = <0.0001; F p = 0.0296; G p = <0.0001; J p = 0.0092; K p = <0.0001; L p = 0.0006; M p = <0.0001.

References

    1. Mitchell SF, Parker R. Principles and properties of eukaryotic mRNPs. Mol. Cell. 2014;54:547–558. - PubMed
    1. Weisse, J. et al. RNA-binding proteins as regulators of migration, invasion and metastasis in oral squamous cell carcinoma. Int. J. Mol. Sci.21, 6835 (2020). - PMC - PubMed
    1. Geuens T, Bouhy D, Timmerman V. The hnRNP family: insights into their role in health and disease. Hum. Genet. 2016;135:851–867. - PMC - PubMed
    1. Hatakeyama H, et al. Protein clusters associated with carcinogenesis, histological differentiation and nodal metastasis in esophageal cancer. Proteomics. 2006;6:6300–6316. - PubMed
    1. Wen F, et al. Higher expression of the heterogeneous nuclear ribonucleoprotein K in melanoma. Ann. Surg. Oncol. 2010;17:2619–2627. - PMC - PubMed

Publication types

MeSH terms

Substances