

Excess all-cause mortality in the USA and Europe during the COVID-19 pandemic, 2020 and 2021
- PMID: 36329082
- PMCID: PMC9630804
- DOI: 10.1038/s41598-022-21844-7
Excess all-cause mortality in the USA and Europe during the COVID-19 pandemic, 2020 and 2021
Abstract
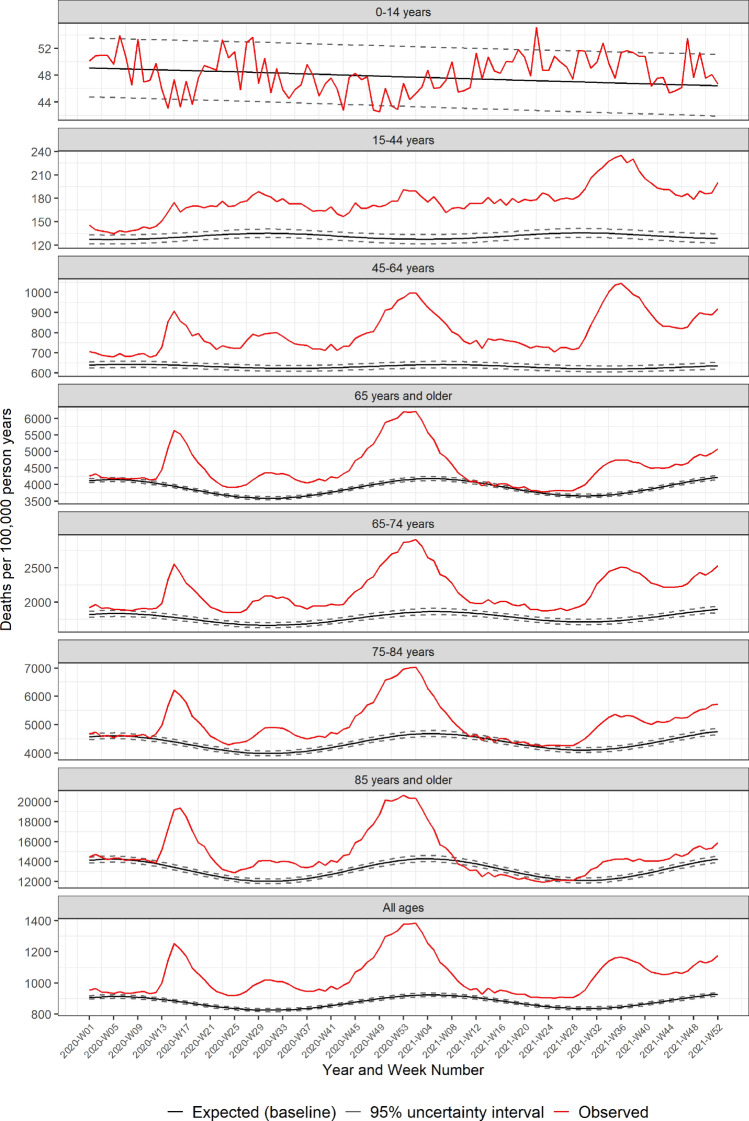
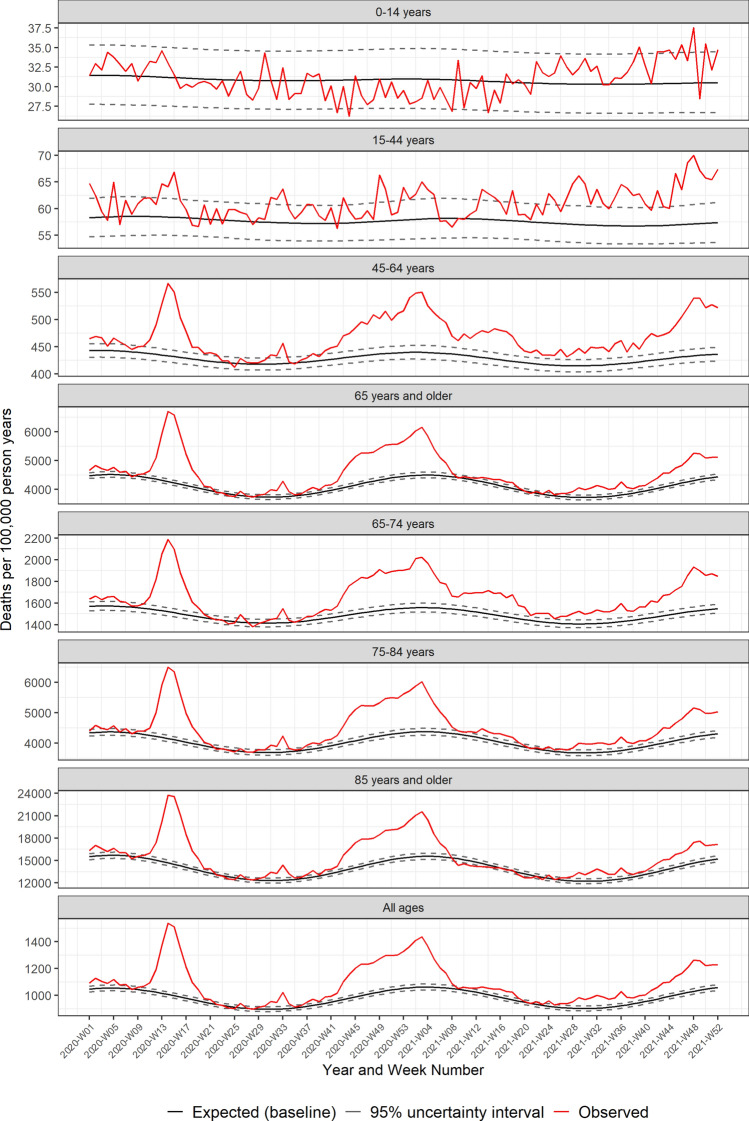
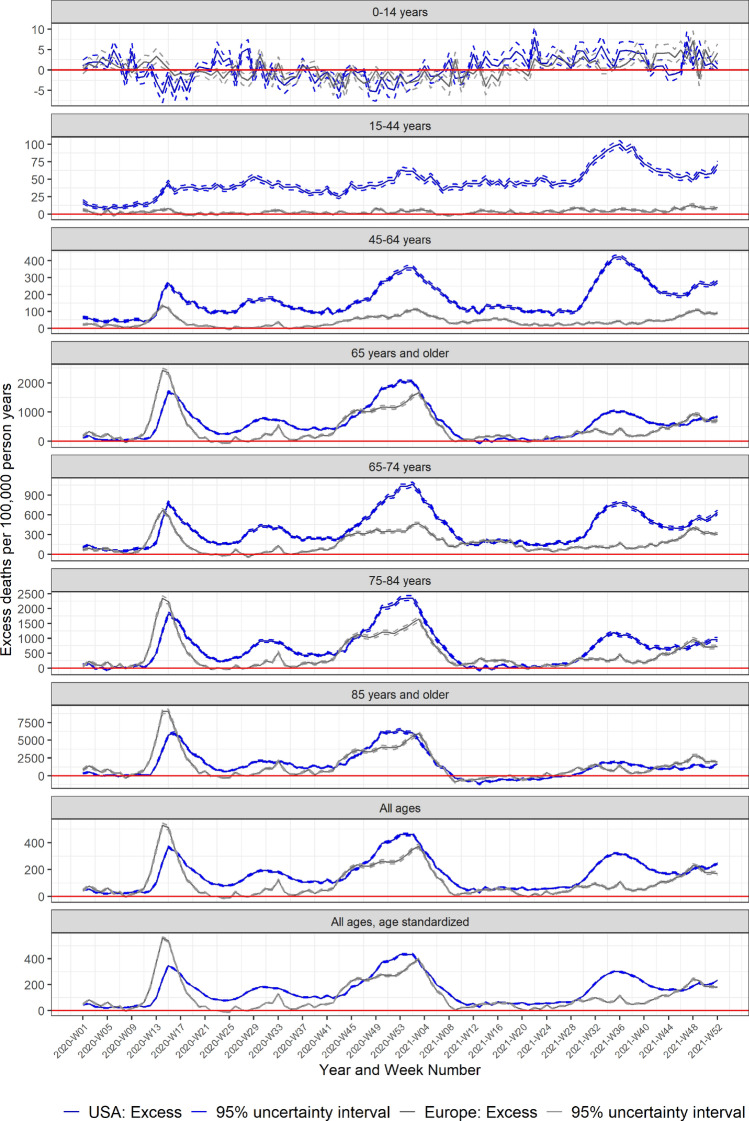
Both the USA and Europe experienced substantial excess mortality in 2020 and 2021 related to the COVID-19 pandemic. Methods used to estimate excess mortality vary, making comparisons difficult. This retrospective observational study included data on deaths from all causes occurring in the USA and 25 European countries or subnational areas participating in the network for European monitoring of excess mortality for public health action (EuroMOMO). We applied the EuroMOMO algorithm to estimate excess all-cause mortality in the USA and Europe during the first two years of the COVID-19 pandemic, 2020-2021, and compared excess mortality by age group and time periods reflecting three primary waves. During 2020-2021, the USA experienced 154.5 (95% Uncertainty Interval [UI]: 154.2-154.9) cumulative age-standardized excess all-cause deaths per 100,000 person years, compared with 110.4 (95% UI: 109.9-111.0) for the European countries. Excess all-cause mortality in the USA was higher than in Europe for nearly all age groups, with an additional 44.1 excess deaths per 100,000 person years overall from 2020-2021. If the USA had experienced an excess mortality rate similar to Europe, there would have been approximately 391 thousand (36%) fewer excess deaths in the USA.
© 2022. This is a U.S. Government work and not under copyright protection in the US; foreign copyright protection may apply.
Conflict of interest statement
The authors declare no competing interests.
Figures
References
Publication types
MeSH terms
LinkOut - more resources
Full Text Sources
Medical
