. 2022 Nov 3;12(1):18639.
doi: 10.1038/s41598-022-23167-z.

Glycosylated clusterin species facilitate Aβ toxicity in human neurons

Affiliations

Glycosylated clusterin species facilitate Aβ toxicity in human neurons

Evangeline M Foster et al. Sci Rep. .

Abstract

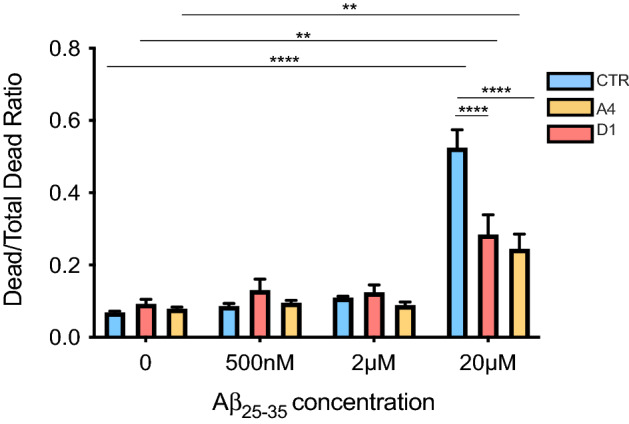
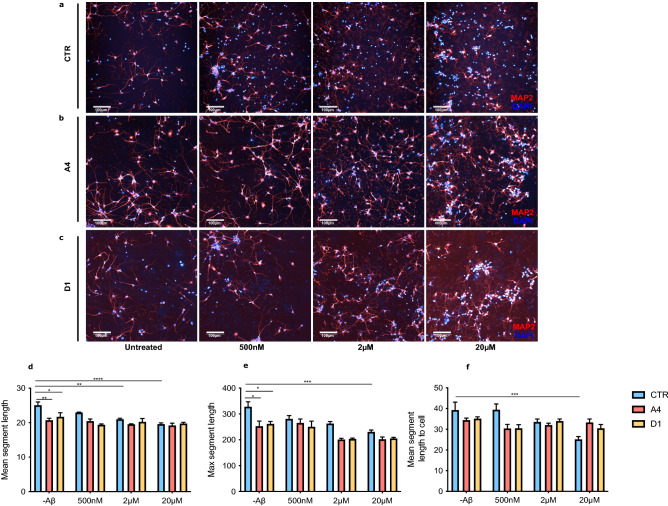
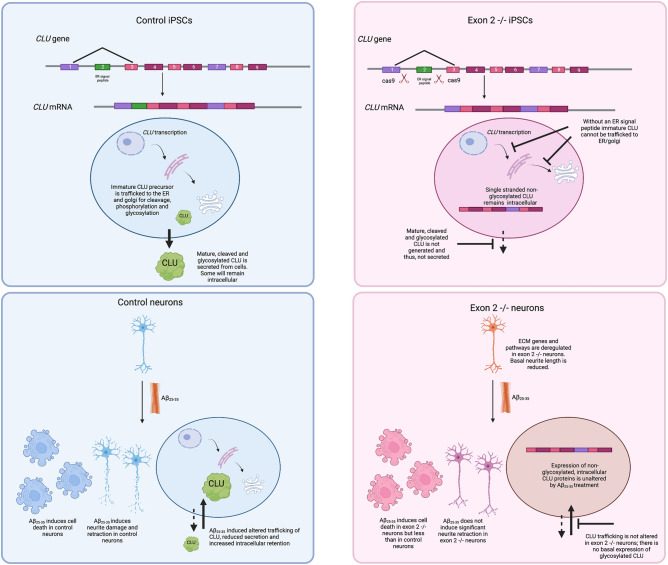
Clusterin (CLU) is one of the most significant genetic risk factors for late onset Alzheimer's disease (AD). However, the mechanisms by which CLU contributes to AD development and pathogenesis remain unclear. Studies have demonstrated that the trafficking and localisation of glycosylated CLU proteins is altered by CLU-AD mutations and amyloid-β (Aβ), which may contribute to AD pathogenesis. However, the roles of non-glycosylated and glycosylated CLU proteins in mediating Aβ toxicity have not been studied in human neurons. iPSCs with altered CLU trafficking were generated following the removal of CLU exon 2 by CRISPR/Cas9 gene editing. Neurons were generated from control (CTR) and exon 2 -/- edited iPSCs and were incubated with aggregated Aβ peptides. Aβ induced changes in cell death and neurite length were quantified to determine if altered CLU protein trafficking influenced neuronal sensitivity to Aβ. Finally, RNA-Seq analysis was performed to identify key transcriptomic differences between CLU exon 2 -/- and CTR neurons. The removal of CLU exon 2, and the endoplasmic reticulum (ER)-signal peptide located within, abolished the presence of glycosylated CLU and increased the abundance of intracellular, non-glycosylated CLU. While non-glycosylated CLU levels were unaltered by Aβ25-35 treatment, the trafficking of glycosylated CLU was altered in control but not exon 2 -/- neurons. The latter also displayed partial protection against Aβ-induced cell death and neurite retraction. Transcriptome analysis identified downregulation of multiple extracellular matrix (ECM) related genes in exon 2 -/- neurons, potentially contributing to their reduced sensitivity to Aβ toxicity. This study identifies a crucial role of glycosylated CLU in facilitating Aβ toxicity in human neurons. The loss of these proteins reduced both, cell death and neurite damage, two key consequences of Aβ toxicity identified in the AD brain. Strikingly, transcriptomic differences between exon 2 -/- and control neurons were small, but a significant and consistent downregulation of ECM genes and pathways was identified in exon 2 -/- neurons. This may contribute to the reduced sensitivity of these neurons to Aβ, providing new mechanistic insights into Aβ pathologies and therapeutic targets for AD.


Conflict of interest statement

The authors declare no competing interests.

Figures

Figure 1
Figure 1
25–35 treatment alters trafficking of glycosylated CLU in human neurons. CTR and exon 2  −/− neurons (A4 and D1) were treated for 24 h with 20 μM Aβ25–35. Concentrated media and total cell lysate samples were collected, ran on a western blot and immunostained for CLU. (a) Western blot analysis of clusterin expression in cell lysate and culture media of untreated and Aβ25–35 treated CTR and A4 neurons (b) and untreated and Aβ25–35 treated CTR and D1 neurons. In both (a) and (b) β-actin were used as a loading control for protein loading of cell lysate samples. The absence of β-actin expression was confirmed in all culture media samples. (c,d) CLU immunoreactivity in cell lysates was normalised to β-actin immunoreactivity for each sample individually. This was then normalised to the immunoreactivity of the untreated CTR samples. (c) Intracellular, glycosylated CLU immunoreactivity was significantly increased (p = 0.0221*) while (d) secreted, glycosylated CLU was significantly decreased in CTR neurons (p = 0.0432*) following treatment with Aβ25–35. Exon 2  −/− neurons were demonstrated to not express glycosylated CLU proteins, either intracellularly or secreted into the media. (e,f) Loss of CLU exon 2 increased immunoreactivity of non-glycosylated CLU proteins in exon 2  −/− neurons at basal conditions (A4: p = 0.0077** and D1: p = 0.0348*) but Aβ25–35 did not alter the immunoreactivity of non-glycosylated, intracellular CLU species in either CTR or exon 2  −/− neurons (CTR: p = 0.09785 and A4: p = 0.7991, CTR: 0.9255 and D1: p = 0.9154). Immunoreactivity is reported as mean ± standard error of the mean (SEM). Mean values were calculated from neuronal samples collected from three independent differentiations of neurons, of which each contained triplicate samples (n = 3). Two-Way ANOVAs were performed for all comparisons (*p < 0.05, **p < 0.01, ***p < 0.001 and ****p < 0.0001). Western blot images used in this figure have been cropped for clarity, all original blots are presented in Supplementary Fig. 5.
Figure 2
Figure 2
Exon 2  −/− neurons exhibit lower cell death rates when treated with Aβ25–35. CTR and exon 2  −/− neurons were treated with a one of three concentrations of Aβ25–35 (500 nM, 2 μM or 20 μM). After 24 h of treatment, cell death induced by Aβ25–35 was quantified. AAF-Glo reagent was added to cultures to measure protease activity released from apoptotic cells, giving a measurement of death induced by Aβ25–35 treatment. Death was then induced in the remaining, live cells by addition of digitonin and AAF-Glo. Death was quantified again giving a measurement of total number of death cells in each culture, representing the total number of cells. For each condition, the Dead/Total Dead Ratio was calculated and compared. Before Aβ25–35 treatment, the ratios of exon 2  −/− and CTR neurons were comparable (p > 0.9999 for all comparisons). 20 μM Aβ25–35 significantly increased the Dead/Total Dead Ratios of both CTR and exon 2  −/− neurons (CTR; p < 0.0001****, A4; p = 0.0200* and D1; p = 0.0254*. The percentage increase in number ratios for each cell line: CTR: 658.67% increase, A4: 208.24% increase and D1: 209.61% increase). 500 nM and 2 μM Aβ25–35 treatments did not induce significant cell death in any culture. Dead/Total Dead Ratios of 20 μM Aβ25–35 treated CTR cultures were significantly higher than the Ratios demonstrated in exon 2  −/− cultures (20 μM Aβ25–35 CTR vs A4: p < 0.0001**** and 20 μM Aβ25–35 CTR vs D1: p < 0.0001****) but were similar between the exon 2  −/− cultures (A4 vs D1: p = 0.9952). This reflects less cell death quantified in exon 2  −/− cultures than in CTR neurons. Dead/Total Dead Ratios are reported as mean ± SEM and Two-Way ANOVAs were performed for all concentrations (*p < 0.05, **p < 0.01, ***p < 0.001 and ****p < 0.0001). Mean values were calculated from samples collected from three independent differentiations of neurons (n = 3), of which each contained 6 replicant samples.
Figure 3
Figure 3
25–35 does not induce neurite retraction in exon 2  −/− neurons. CTR and exon 2  −/− (A4 and D1) neurons were treated for 24 h with one of three concentrations of Aβ25–35. Following treatment, neurons were fixed, immunostained for DAPI (blue) and MAP2 (red) and imaged. Representative images of (a) CTR, (b) A4 and (c) D1 neurons. (df) Changes in length of neuronal processes were then quantified using an automated analysis software pipeline that identified MAP2 positive areas. Before treatment, mean segment length (CTR vs A4: p = 0.0310** and CTR vs D1: p = 0.0379*) and maximum segment length were significantly reduced in exon 2  −/− neurons than CTR neurons (CTR vs A4: p = 0.0161* and CTR vs D1: p = 0.0487*). 20 μM Aβ25–35 induced significant reductions in neurite length parameters in CTR neurons but not in exon 2  −/− neurons (CTR: mean segment length; p < 0.0001****, maximum segment length; p = 0.0009***, mean segment length to cell; p = 0.0010***). Exon 2  −/− neurons did not display evidence of Aβ25–35 induced neurite damage at any concentration of Aβ25–35. Values are reported as mean ± SEM and Two-Way ANOVAs were performed for all time points (*p < 0.05, **p < 0.01, ***p < 0.001 and ****p < 0.0001). Mean values were calculated from samples collected from three independent differentiations of neurons (n = 3), of which each contained 6 replicant samples.
Figure 4
Figure 4
Extracellular matrix (ECM) genes and pathways are downregulated in exon 2  −/− neurons. RNA-Seq analysis of exon 2  −/− and CTR neurons reveal suppression of ECM related genes and pathways in exon 2  −/− neurons. (a) GO (biological process) enrichment analysis reveal downregulation of collagen and ECM genes in exon 2  −/− neurons (res 4 and 5). (b) Heatmap visualisation of top 20 most variable genes clustered with complete hierarchical clustering using z-scored counts. Column annotations represent Aβ25–35 treatment condition and neuron genotype (CTR, A4 or D1). (c) Functional directionality analysis identified focal adhesion and ECM receptor interaction were suppressed in exon 2  −/− neurons, which was not altered by Aβ25–35 treatment. (d) Topology identified a significant suppression of ECM-receptor interaction and PI3K-Akt signalling pathways were suppressed in exon 2  −/− neurons, again unaltered by Aβ25–35. Figure legend outlines comparisons made in this analysis: res1; Aβ25–35 treated vs untreated CTR neurons, res2; Aβ25–35 treated vs untreated A4 neurons, res3; Aβ25–35 treated vs untreated D1 neurons, res4; untreated A4 vs untreated CTR neurons, res5; untreated D1 vs untreated CTR neurons, res6; Aβ25–35 treated A4 vs CTR neurons and res7; Aβ25–35 treated D1 vs CTR neurons. Differential gene expression satisfied thresholds for both fold change (> 1.5) and adjusted p value (< 0.05) were included in this analysis. Numbers of each res represent the number of differentially expressed genes enriched in each pathway for each comparison. Gene set enrichment satisfied adjusted p value (< 0.05). NES (enrichment score normalised to mean enrichment of random samples of the same size). tA the observed total perturbation accumulation in the pathway, pPERT probability to observe a total accumulation more extreme than tA only by chance. pPERT* < 0.05, ** < 0.01 and *** < 0.001.
Figure 5
Figure 5
Summary diagram. Graphic illustration highlighting key results observed in this study. To alter the type and localisation of CLU proteins generated by iPSCs CRISPR/Cas9 gene editing was used; iPSCs lacking CLU exon 2 do not produce mature, glycosylated and cleaved CLU proteins and therefore do not secrete CLU proteins. Instead, exon 2  −/− iPSCs generate single polypeptide CLU protein that does not undergo glycosylated and remains intracellular. Following differentiation of CTR and exon 2  −/− iPSCs into neurons, neurons were treated with Aβ25–35 and phenotypes compared to assess if altered CLU protein production alters the sensitivity of neurons to Aβ25–35 induced toxicity. Aβ25–35 treatment induced significant cell death and neurite damage to control neurons, this was accompanied by an alteration in CLU trafficking resulting in increased intracellular retention and reduced secretion of glycosylated CLU proteins. CLU trafficking was not altered in exon 2  −/− neurons since they do not express glycosylated CLU proteins. In contrast to previous reports, no evidence was found that non-glycosylated CLU protein abundance is increased following induction of stress or cell death. Exon 2  −/− neurons displayed significant cell death following Aβ25–35 treatment but no significant neurite damage was observed. We suggest that the partial protection displayed by exon 2  −/− neurons may be attributed to the altered expression and activity in extracellular matrix genes and pathways as highlighted by RNA-seq analysis. Diagram created with BioRender.com.

Similar articles

Cited by

References

    1. National Institute on Aging. Alzheimer’s Disease Fact Sheet. http://www.nia.nih.gov/health/alzheimers-disease-fact-sheet (2019).
    1. Hardy JA, Higgins GA. Alzheimer’s disease: The amyloid cascade hypothesis. Science. 1992;256:184–185. - PubMed
    1. Musiek ES, Holtzman DM. Three dimensions of the amyloid hypothesis: Time, space, and “wingmen”. Nat. Neurosci. 2015;18:800–806. - PMC - PubMed
    1. Selkoe DJ, Hardy J. The amyloid hypothesis of Alzheimer’s disease at 25 years. EMBO Mol. Med. 2016;8:595–608. - PMC - PubMed
    1. Goate A, et al. Segregation of a missense mutation in the amyloid precursor protein gene with familial Alzheimer’s disease. Nature. 1991;349:704–706. - PubMed

Publication types