. 2022 Nov 3;5(1):1173.
doi: 10.1038/s42003-022-04109-x.

The complexity of the stream of consciousness

Affiliations

The complexity of the stream of consciousness

Peter Coppola et al. Commun Biol. .

Abstract

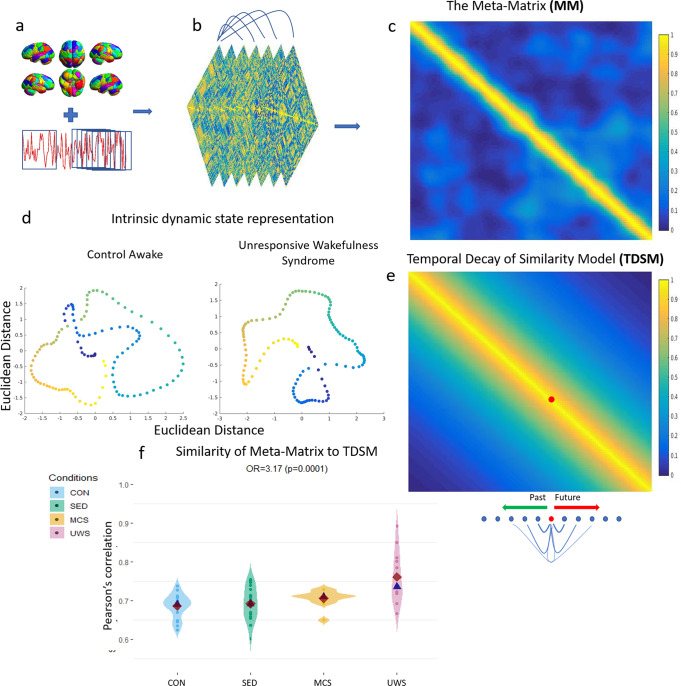
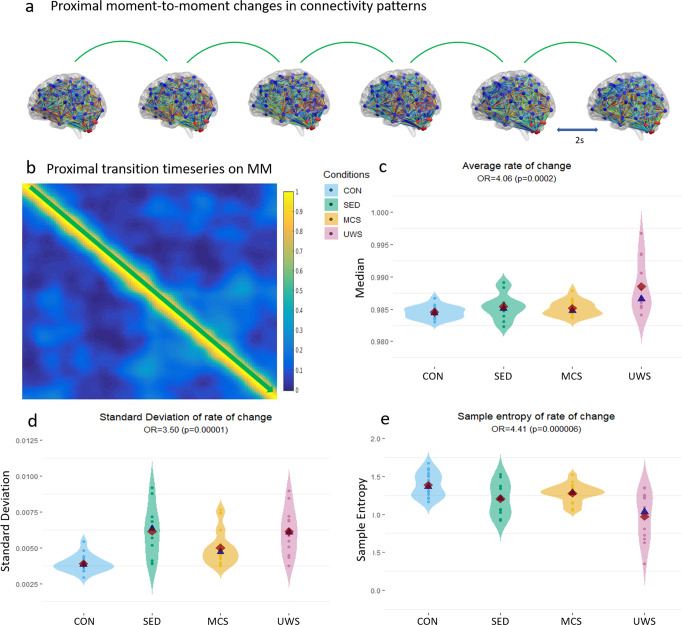
Typical consciousness can be defined as an individual-specific stream of experiences. Modern consciousness research on dynamic functional connectivity uses clustering techniques to create common bases on which to compare different individuals. We propose an alternative approach by combining modern theories of consciousness and insights arising from phenomenology and dynamical systems theory. This approach enables a representation of an individual's connectivity dynamics in an intrinsically-defined, individual-specific landscape. Given the wealth of evidence relating functional connectivity to experiential states, we assume this landscape is a proxy measure of an individual's stream of consciousness. By investigating the properties of this landscape in individuals in different states of consciousness, we show that consciousness is associated with short term transitions that are less predictable, quicker, but, on average, more constant. We also show that temporally-specific connectivity states are less easily describable by network patterns that are distant in time, suggesting a richer space of possible states. We show that the cortex, cerebellum and subcortex all display consciousness-relevant dynamics and discuss the implication of our results in forming a point of contact between dynamical systems interpretations and phenomenology.


Conflict of interest statement

The authors declare no competing interests.

Figures

Fig. 1
Fig. 1. Meta-Matrix formation and predictability of intrinsic dynamics.
a Shows the methodological approach we adopted in this study. We parcellate the data spatially and then temporally using the sliding window approach, where one window is comprised of 24 timepoints and is moved forward by one timepoint. By correlating all parcellated brain regions within each widow we obtain time-varying connectivity matrices (b; see Supplementary Note 2 for alternative methods). By comparing all connectivity matrices to all other sampled ones (by vectorising the upper triangle and correlating them via Pearson’s correlation) we obtain the Meta-Matrix c, also known as functional connectivity dynamics. Each column in the meta matrix represents one connectivity matrix and all the cells within that column represent its similarity to all available past and future connectivity states. Thus, each connectivity pattern is described by its intrinsic relationship to all other connectivity states. By calculating Euclidean distance on these relationships and reducing their dimensions, we can represent the MM on a 2D plane d. In d, each point represents a connectivity state and its vicinity to other points represent its similarity. This may be interpreted as a representation of an individual moving through possible connectivity states as the scan progresses (hotter colour = later in the scan). Noticeable is that the UWS has consecutive states that are closer (more similar to each other). We tested the predictability of the whole MM by comparing the meta-matrix to the temporal decay of similarity model (TDSM) e, in which timepoints that are closer to each other are more similar (three of these models constructed, see methods; first exponential decay model presented in this figure). f We find that the similarity of the meta matrix to the TDSM predicts increasing levels of awareness (control awake > sedation > minimally conscious state > unresponsive wakefulness syndrome) (Odds Ratio = 3.17, p = 0.0001). TDSM = temporal decay of similarity model, Con = control awake n = 18, SED = sedation n = 18; MCS = minimally conscious state n = 11; UWS = unresponsive wakefulness syndrome n = 12. Red rhombi represent the mean, whilst blue triangles, the median.
Fig. 2
Fig. 2. Proximal network transitions; description and analyses.
a Depicts the short-term transitions between each successive connectivity pattern (time = 2s). The distance between these was measured via Pearson’s correlation (see Supplementary Note 2 for alternative distance metrics used). b Shows where in the meta-matrix this information is represented (along the diagonal); shown by a green arrow. On the resulting timeseries, describing the rate of change of connectivity patterns over time, we calculated the average c, the standard deviation d and the sample entropy (e; see Supplementary Note 4 for alternative methods). These measures were inserted as an independent variable in ordinal logistic regression with conditions ordered according to presumed levels of awareness (control awake > sedation > minimally conscious state > unresponsive wakefulness syndrome). CON = control awake n = 18, SED = sedation n = 18; MCS = minimally conscious state n = 11; UWS = unresponsive wakefulness syndrome n = 12. OR = odds ratio. Red rhombi represent the mean, whilst blue triangles, the median.
Fig. 3
Fig. 3. Distal meta-matrix description and analyses.
a Shows the relationship (i.e., distance) of one connectivity pattern to all others that are distal in time. By taking the off-diagonal values of the meta-matrix (represented by a red triangle in b) and mirroring it across the new diagonal we obtain the distal meta-matrix (dMM; c). This represents relationships (Pearson correlation) between connectivity patterns that are distant in time (distances of 13 and 24 timepoints were chosen, as these corresponded to more than half and the entire sliding window [Fig. 1a] respectively; latter distance is displayed here), therefore providing a metric of the definition of connectivity states over longer periods of time. We calculated complexity measures (ETC and sample entropy) on each column of the distal meta-matrix and averaged across these (represented by the red rectangle in c; see Supplementary Note 6 for reproduction). This average complexity measure was inserted in an ordinal logistic regression (d) with conditions ordered according to presumed levels of awareness as the dependent variable (control awake > sedation > minimally conscious state > unresponsive wakefulness syndrome; 13 proximal timepoints removed in this instance). e Shows the shared variance between the distal and proximal measures (spearman correlation; p < 0.001). dMM = distal meta-matrix, Con = control awake n = 18, SED = sedation n = 18, MCS = minimally conscious state n = 11, UWS =  unresponsive wakefulness syndrome n = 12; OR = odds ratio, ETC = Effort-to-compress, SampEn = Sample entropy, SD = standard deviation, prox = of proximal temporal transitions. Red rhombi represent the mean, whilst blue triangles, the median.
Fig. 4
Fig. 4. Complexity of structure-function dynamic relationship.
Illustration of method (a) for the sample entropy of the relationship between functional dynamic and tractography of diffusion tensor imaging data. We measured the similarity (using Pearson’s correlation) of each dynamic functional connectivity state to that of the underlying structural connectivity (measured via tractography). From this we obtained a string of similarity values on which complexity measures (sample entropy and effort to compress) were calculated. This value was then inserted as the predictor variable into an ordinal logistic regression. Conditions, ordered according to presumed level of awareness (control awake > minimally conscious state> unresponsive wakefulness syndrome), were the dependent variable (b). Shown are the results for the whole brain, the cortex, the subcortex and cerebellum. DTI = diffusion tensor imaging, Con = control awake n = 18, MCS = minimally conscious state n = 11, UWS = unresponsive wakefulness syndrome n = 12 (n = 11 for cerebellar results). OLR = ordinal logistic regression. Red diamonds represent the mean while blue triangles the median.

References

    1. Carhart-Harris RL, et al. The entropic brain: a theory of conscious states informed by neuroimaging research with psychedelic drugs. Front. Hum. Neurosci. 2014;8:1–22. - PMC - PubMed
    1. Tononi G, Boly M, Massimini M, Koch C. Integrated information theory: from consciousness to its physical substrate. Nat. Rev. Neurosci. 2016;17:450–461. - PubMed
    1. Tononi G, Edelman GM. Consciousness and complexity. Sci. (80-.) 1998;282:1846–1851. - PubMed
    1. Northoff G, Huang Z. How do the brain’s time and space mediate consciousness and its different dimensions? Temporo-spatial theory of consciousness (TTC) Neurosci. Biobehav. Rev. 2017;80:630–645. - PubMed
    1. Cavanna F, Vilas MG, Palmucci M, Tagliazucchi E. Dynamic functional connectivity and brain metastability during altered states of consciousness. Neuroimage. 2018;180:383–395. - PubMed

Publication types