. 2022 Nov 3;22(1):126.
doi: 10.1186/s12862-022-02081-y.

Population dynamics and demographic history of Eurasian collared lemmings

Affiliations

Population dynamics and demographic history of Eurasian collared lemmings

Edana Lord et al. BMC Ecol Evol. .

Abstract

Background: Ancient DNA studies suggest that Late Pleistocene climatic changes had a significant effect on population dynamics in Arctic species. The Eurasian collared lemming (Dicrostonyx torquatus) is a keystone species in the Arctic ecosystem. Earlier studies have indicated that past climatic fluctuations were important drivers of past population dynamics in this species.

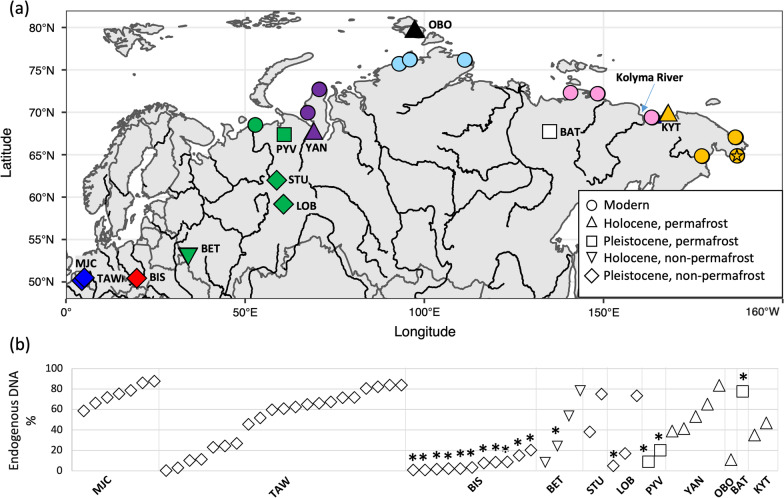
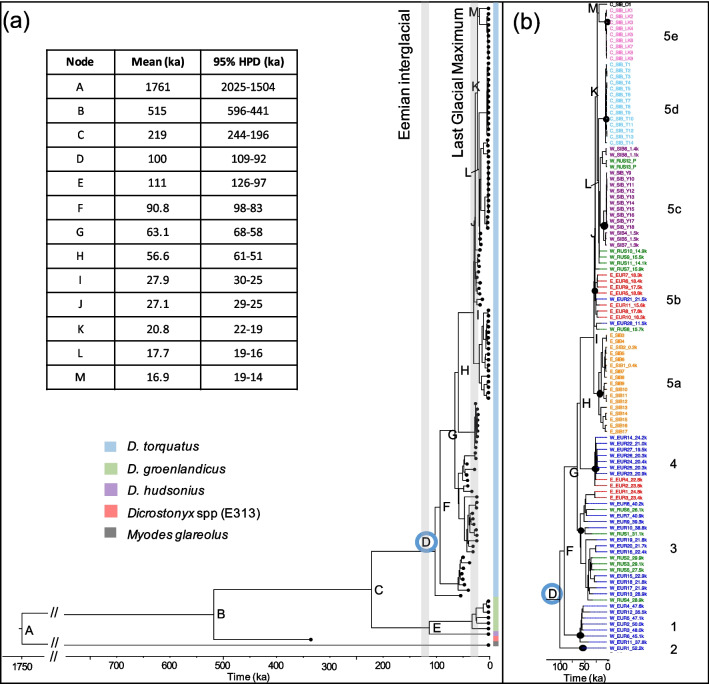
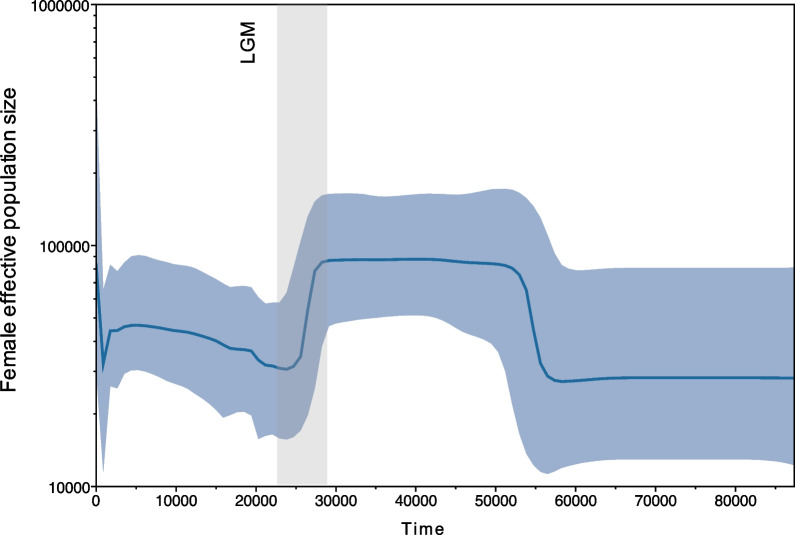
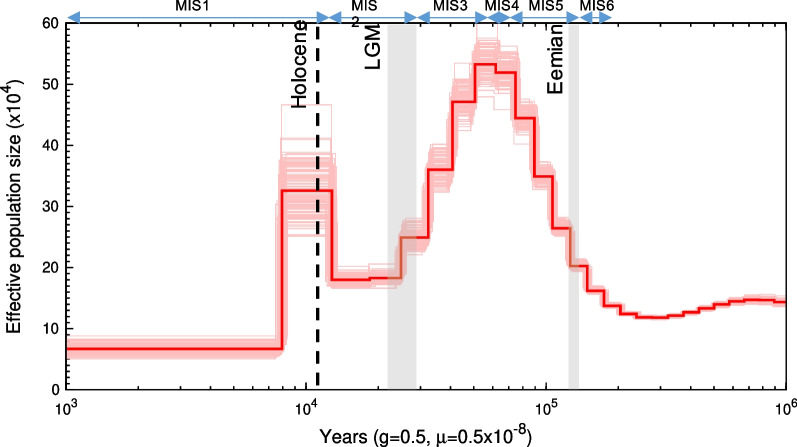
Results: Here, we analysed 59 ancient and 54 modern mitogenomes from across Eurasia, along with one modern nuclear genome. Our results suggest population growth and genetic diversification during the early Late Pleistocene, implying that collared lemmings may have experienced a genetic bottleneck during the warm Eemian interglacial. Furthermore, we find multiple temporally structured mitogenome clades during the Late Pleistocene, consistent with earlier results suggesting a dynamic late glacial population history. Finally, we identify a population in northeastern Siberia that maintained genetic diversity and a constant population size at the end of the Pleistocene, suggesting suitable conditions for collared lemmings in this region during the increasing temperatures associated with the onset of the Holocene.

Conclusions: This study highlights an influence of past warming, in particular the Eemian interglacial, on the evolutionary history of the collared lemming, along with spatiotemporal population structuring throughout the Late Pleistocene.

Keywords: Collared lemming; Demographic history; Palaeogenomics; Population structure.


Conflict of interest statement

The authors declare no competing interests.

Figures

Fig. 1
Fig. 1
Map of sample locations and endogenous DNA content in sites. a Location of samples in the present study and modern samples from Fedorov et al. [14], coordinates can be found in Additional file 1: Tables S2 and S3. The locations of the modern samples represent the current distribution of D. torquatus. Star depicts the location of the modern genome sample. Major rivers displayed in black, with the Kolyma River indicated with an arrow. Site abbreviations are as follows: MJC, Marie-Jeanne Cave; TAW, Trou Al’Wesse; BIS, Bisnik Cave; BET, Betovo; STU, Studennaya; PYV, Pymva Shor; YAN, Yanagana Pe-4; OBO, Ostrov Bolshevik; BAT, Batagaika Crater; KYT, Kyttyk Peninsula. Samples are coloured by geographic location used to group sites in the phylogenetic analyses: western Europe, blue; eastern Europe, red; western Russia, green; western Siberia (east of the Ural mountains), purple; central Siberia (Taimyr), light blue; central Siberia (Yana-Kolyma), light pink; central Siberia (Ostrov Bolshevik), black; eastern Siberia, orange; Batagaika, white. Map was created in R v3.6.1. b Endogenous DNA content of ancient samples that were shotgun sequenced (n = 59), with site abbreviations following above. Asterisks indicate samples that did not undergo bleach and predigestion treatment
Fig. 2
Fig. 2
Mitochondrial phylogeny of collared lemmings (Dicrostonyx spp.) using BEAST v1.10.4. a Whole dataset, including Myodes glareolus as an outgroup. Major nodes are labelled and divergence times are listed in the table with mean age and 95% highest posterior density (HPD) given in thousands of years (ka). Blue open circle represents the most recent common ancestor of D. torquatus. Posterior support (not shown) for all major nodes was 1. Grey vertical bars show the Eemian interglacial (130–115 ka) and Last Glacial Maximum (28.6–22.5 ka). b Dicrostonyx torquatus phylogeny showing the distinct clades, identified by the black closed circles. Samples are coloured by geographic location: western Europe, blue; eastern Europe, red; western Russia, green; western Siberia (east of the Ural mountains), purple; central Siberia (Taimyr), light blue; central Siberia (Yana-Kolyma), light pink; central Siberia (Ostrov Bolshevik), black; eastern Siberia, orange. Time in both figures is given in thousands of years (ka)
Fig. 3
Fig. 3
Mitochondrial demographic reconstruction of Dicrostonyx torquatus over the past 80 ka BP, constructed using BEAST 1.10.4. Female effective population size is given in a log scale. Light blue shows the 95% confidence interval. The grey bar represents the Last Glacial Maximum (LGM, 28.6–22.5 ka BP)
Fig. 4
Fig. 4
Demographic reconstruction of effective population size of Dicrostonyx torquatus using PSMC. The PSMC curve is scaled with a generation time (g) of two generations per year [23] and a mutation rate (μ) of 5.4 × 10–9 substitutions per site per generation [22]. The x axis shows time on a log scale. The dashed line represents the Pleistocene-Holocene boundary (~ 11.7 ka BP). Grey bars indicate the Last Glacial Maximum (LGM, 28.6–22.4 ka BP) and the Eemian interglacial (130–115 ka BP). Blue arrows and MIS labels designate Marine Isotope Stages 1 to 6. Light red lines represent 100 bootstrap replicates

References

    1. Brace S, Palkopoulou E, Dalen L, Lister AM, Miller R, Otte M, et al. Serial population extinctions in a small mammal indicate Late Pleistocene ecosystem instability. Proc Natl Acad Sci. 2012;109:20532–20536. - PMC - PubMed
    1. Palkopoulou E, Baca M, Abramson NI, Sablin M, Socha P, Nadachowski A, et al. Synchronous genetic turnovers across Western Eurasia in Late Pleistocene collared lemmings. Glob Chang Biol. 2016;22:1710–1721. - PubMed
    1. Campos PF, Willerslev E, Sher A, Orlando L, Axelsson E, Tikhonov A, et al. Ancient DNA analyses exclude humans as the driving force behind late Pleistocene musk ox (Ovibos moschatus) population dynamics. Proc Natl Acad Sci U S A. 2010;107:5675–5680. - PMC - PubMed
    1. Lorenzen ED, Nogués-Bravo D, Orlando L, Weinstock J, Binladen J, Marske KA, et al. Species-specific responses of Late Quaternary megafauna to climate and humans. Nature. 2011;479:359–364. - PMC - PubMed
    1. Stewart JR, Lister AM, Barnes I, Dalén L. Refugia revisited: individualistic responses of species in space and time. Proc Biol Sci. 2010;277:661–671. - PMC - PubMed

Publication types