

Exploring risk factors for cervical lymph node metastasis in papillary thyroid microcarcinoma: construction of a novel population-based predictive model
- PMID: 36329470
- PMCID: PMC9635156
- DOI: 10.1186/s12902-022-01186-1
Exploring risk factors for cervical lymph node metastasis in papillary thyroid microcarcinoma: construction of a novel population-based predictive model
Abstract
Background: Machine learning was a highly effective tool in model construction. We aim to establish a machine learning-based predictive model for predicting the cervical lymph node metastasis (LNM) in papillary thyroid microcarcinoma (PTMC).
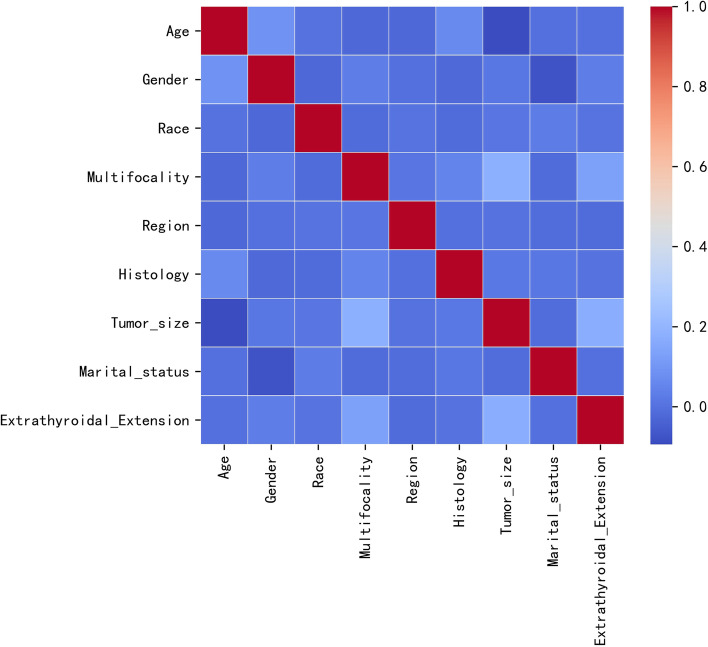
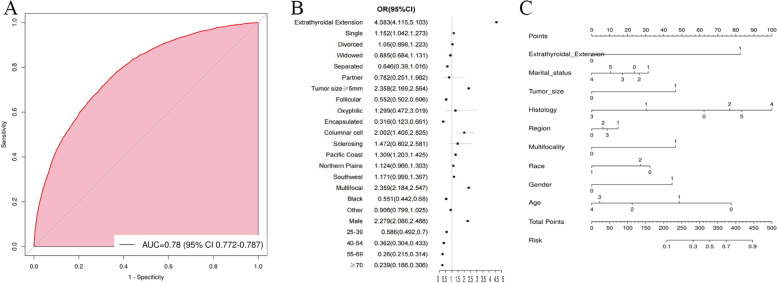
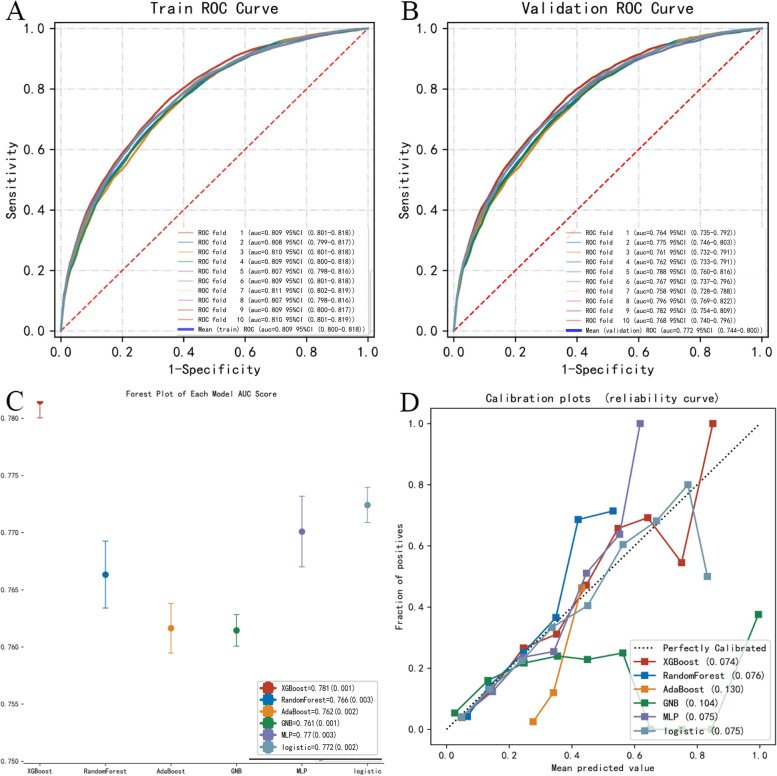
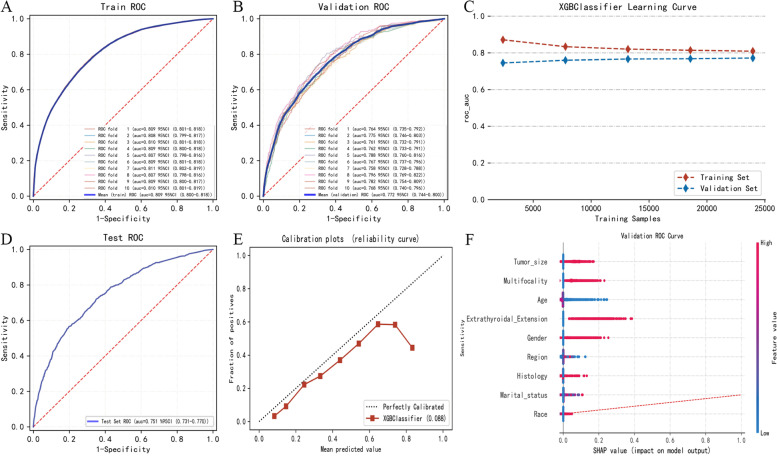
Methods: We obtained data on PTMC from the SEER database, including 10 demographic and clinicopathological characteristics. Univariate and multivariate logistic regression (LR) analyses were applied to screen the risk factors for cervical LNM in PTMC. Risk factors with P < 0.05 in multivariate LR analysis were used as modeling variables. Five different machine learning (ML) algorithms including extreme gradient boosting (XGBoost), random forest (RF), adaptive boosting (AdaBoost), gaussian naive bayes (GNB) and multi-layer perceptron (MLP) and traditional regression analysis were used to construct the prediction model. Finally, the area under the receiver operating characteristic (AUROC) curve was used to compare the model performance.
Results: Through univariate and multivariate LR analysis, we screened out 9 independent risk factors most closely associated with cervical LNM in PTMC, including age, sex, race, marital status, region, histology, tumor size, and extrathyroidal extension (ETE) and multifocality. We used these risk factors to build an ML prediction model, in which the AUROC value of the XGBoost algorithm was higher than the other 4 ML algorithms and was the best ML model. We optimized the XGBoost algorithm through 10-fold cross-validation, and its best performance on the training set (AUROC: 0.809, 95%CI 0.800-0.818) was better than traditional LR analysis (AUROC: 0.780, 95%CI 0.772-0.787).
Conclusions: ML algorithms have good predictive performance, especially the XGBoost algorithm. With the continuous development of artificial intelligence, ML algorithms have broad prospects in clinical prognosis prediction.
Keywords: Conventional regression model; Machine learning; Papillary thyroid microcarcinoma cervical lymph node metastasis; Prediction model; Risk factors.
© 2022. The Author(s).
Conflict of interest statement
The authors declare that they have no competing interests.
Figures

Similar articles
-
Predicting central lymph node metastasis in papillary thyroid microcarcinoma: a breakthrough with interpretable machine learning.Front Endocrinol (Lausanne). 2025 May 12;16:1537386. doi: 10.3389/fendo.2025.1537386. eCollection 2025. Front Endocrinol (Lausanne). 2025. PMID: 40421246 Free PMC article.
-
Machine Learning-Based Shear Wave Elastography Elastic Index (SWEEI) in Predicting Cervical Lymph Node Metastasis of Papillary Thyroid Microcarcinoma: A Comparative Analysis of Five Practical Prediction Models.Cancer Manag Res. 2022 Sep 21;14:2847-2858. doi: 10.2147/CMAR.S383152. eCollection 2022. Cancer Manag Res. 2022. PMID: 36171862 Free PMC article.
-
A prediction model for identifying high-risk lymph node metastasis in clinical low-risk papillary thyroid microcarcinoma.BMC Endocr Disord. 2023 Nov 27;23(1):260. doi: 10.1186/s12902-023-01521-0. BMC Endocr Disord. 2023. PMID: 38012653 Free PMC article.
-
Risk Factors for Central Compartment Lymph Node Metastasis in Papillary Thyroid Microcarcinoma: A Meta-Analysis.World J Surg. 2015 Oct;39(10):2459-70. doi: 10.1007/s00268-015-3108-3. World J Surg. 2015. PMID: 26099728 Review.
-
Comparison of Multivariable Logistic Regression and Other Machine Learning Algorithms for Prognostic Prediction Studies in Pregnancy Care: Systematic Review and Meta-Analysis.JMIR Med Inform. 2020 Nov 17;8(11):e16503. doi: 10.2196/16503. JMIR Med Inform. 2020. PMID: 33200995 Free PMC article. Review.
Cited by
-
Predicting central lymph node metastasis in papillary thyroid microcarcinoma: a breakthrough with interpretable machine learning.Front Endocrinol (Lausanne). 2025 May 12;16:1537386. doi: 10.3389/fendo.2025.1537386. eCollection 2025. Front Endocrinol (Lausanne). 2025. PMID: 40421246 Free PMC article.
-
Exploration of immunocytochemical biomarkers related to central lymph node metastasis in papillary thyroid microcarcinoma.Cytojournal. 2025 Feb 14;22:18. doi: 10.25259/Cytojournal_162_2024. eCollection 2025. Cytojournal. 2025. PMID: 40134573 Free PMC article.
-
Development of a clinical-molecular prediction model for central lymph node metastasis in cN0 stage papillary thyroid microcarcinoma: a retrospective study.BMC Cancer. 2025 Apr 14;25(1):693. doi: 10.1186/s12885-025-14112-0. BMC Cancer. 2025. PMID: 40229698 Free PMC article.
-
Deep learning prediction model for central lymph node metastasis in papillary thyroid microcarcinoma based on cytology.Cancer Sci. 2023 Oct;114(10):4114-4124. doi: 10.1111/cas.15930. Epub 2023 Aug 13. Cancer Sci. 2023. PMID: 37574759 Free PMC article.
-
A molecular classification of gastric cancer associated with distinct clinical outcomes and validated by an XGBoost-based prediction model.Mol Ther Nucleic Acids. 2022 Dec 27;31:224-240. doi: 10.1016/j.omtn.2022.12.014. eCollection 2023 Mar 14. Mol Ther Nucleic Acids. 2022. PMID: 36700042 Free PMC article.
References
-
- Vaccarella S, Dal Maso L, Laversanne M, Bray F, Plummer M, Franceschi S. The impact of diagnostic changes on the rise in thyroid cancer incidence: a population-based study in selected high-resource countries. Thyroid. 2015;25(10):1127–1136. - PubMed
MeSH terms
Supplementary concepts
LinkOut - more resources
Full Text Sources
Medical
