

Carbon allocation in cassava is affected by water deficit and potassium application - A 13 C-CO2 pulse labelling assessment
- PMID: 36329665
- PMCID: PMC9787844
- DOI: 10.1002/rcm.9426
Carbon allocation in cassava is affected by water deficit and potassium application - A 13 C-CO2 pulse labelling assessment
Abstract
Rationale: Cassava production faces challenges in a changing climate. Pulse labelling cassava with 13 C-CO2 has the potential to elucidate carbon allocation mechanisms of cassava under drought stress and with potassium application. Understanding these mechanisms could guide efforts to mitigate effects of drought in cassava cropping systems.
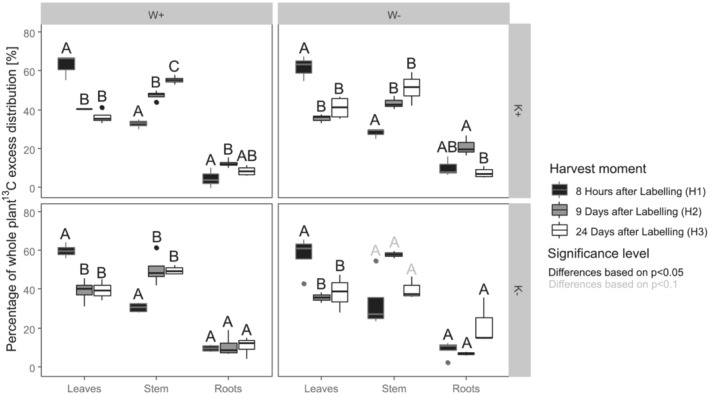
Methods: Forty-eight cassava plants received a nutrient solution high or low in potassium. Water deficit was imposed on half of the plants at bulk root initiation stage, after which they were labelled for 8 h with 13 C-CO2 in a 15 m3 growth chamber. Plants were harvested 8 h, 9 days and 24 days after labelling, and separated into leaves, stems and roots. δ13 C values of the different parts were measured using an isotope ratio mass spectrometer, from which 13 C excess was calculated.
Results: Water deficit decreased transpiration (P < 0.001) and increased carbon respiration (P < 0.05). Potassium application increased assimilate distribution to the roots (P < 0.05) at 9 days after labelling, more strongly for plants under water deficit. The opposite was found at 24 days (P < 0.05) with the legacy of water deficit additionally increasing assimilate distribution to roots (P < 0.05). Youngest, fully expanded leaves contained up to 47% of initial 13 C excess at 24 days after labelling.
Conclusions: Pulse labelling proved to be successful in shedding light on carbon allocation in relation to water and potassium availability. This technique, once adapted to field conditions, could further be used to improve fertilizer recommendations or change agronomic practices to cope with plant stress.
© 2022 The Authors. Rapid Communications in Mass Spectrometry published by John Wiley & Sons Ltd.
Figures


References
-
- Parmar A, Sturm B, Hensel O. Crops that feed the world: Production and improvement of cassava for food, feed, and industrial uses. Food Secur. 2017;9(5):907‐927. doi:10.1007/s12571-017-0717-8 - DOI
-
- FAO . FAOSTAT statistical database. Published Online 2020.
-
- Haensler A, Saeed F, Jacob D. Assessment of projected climate change signals over Central Africa based on a multitude of global and regional climate projections. Climate Change Scenarios for the Congo Basin 2013;No. 11.
-
- Jarvis A, Ramirez‐Villegas J, Vanessa B, Campo H, Navarro‐Racines C. Is cassava the answer to African climate change adaptation? Trop Plant Biol. 2012;5(1):9‐29. doi:10.1007/s12042-012-9096-7 - DOI
-
- Rippke U, Ramirez‐Villegas J, Jarvis A, et al. Timescales of transformational climate change adaptation in sub‐Saharan African agriculture. Nat Climate Change. 2016;6(6):605‐609. doi:10.1038/nclimate2947 - DOI
MeSH terms
Substances
LinkOut - more resources
Full Text Sources