

The European Union One Health 2020 Zoonoses Report
- PMID: 36329690
- PMCID: PMC9624447
- DOI: 10.2903/j.efsa.2021.6971
The European Union One Health 2020 Zoonoses Report
Abstract
This report of the EFSA and the European Centre for Disease Prevention and Control presents the results of zoonoses monitoring activities carried out in 2020 in 27 EU Member States (MS) and nine non-MS. Key statistics on zoonoses and zoonotic agents in humans, food, animals and feed are provided and interpreted historically. Two events impacted 2020 MS data collection and related statistics: the Coronavirus Disease 2019 (COVID-19) pandemic and the withdrawal of the United Kingdom from the EU. In 2020, the first and second most reported zoonoses in humans were campylobacteriosis and salmonellosis, respectively. The EU trend for confirmed human cases of these two diseases was stable (flat) from 2016 to 2020. Fourteen of the 26 MS reporting data on Salmonella control programmes in poultry met the reduction targets for all poultry categories. Salmonella results for carcases of various species performed by competent authorities were more frequently positive than own-checks conducted by food business operators. This was also the case for Campylobacter quantification results from broiler carcases for the MS group that submitted data from both samplers, whereas overall at EU level, those percentages were comparable. Yersiniosis was the third most reported zoonosis in humans, with 10-fold less cases reported than salmonellosis, followed by Shiga toxin-producing Escherichia coli (STEC) and Listeria monocytogenes infections. Illnesses caused by L. monocytogenes and West Nile virus infections were the most severe zoonotic diseases with the highest case fatality. In 2020, 27 MS reported 3,086 foodborne outbreaks (a 47.0% decrease from 2019) and 20,017 human cases (a 61.3% decrease). Salmonella remained the most frequently reported causative agent for foodborne outbreaks. Salmonella in 'eggs and egg products', norovirus in 'crustaceans, shellfish, molluscs and products containing them' and L. monocytogenes in 'fish and fish products' were the agent/food pairs of most concern. This report also provides updates on tuberculosis due to Mycobacterium bovis or Mycobacterium caprae, Brucella, Trichinella, Echinococcus, Toxoplasma, rabies, Coxiella burnetii (Q fever) and tularaemia.
Keywords: Campylobacter; Listeria; Salmonella; foodborne outbreaks; monitoring; parasites; zoonoses.
© 2021 European Food Safety Authority and European Centre for Disease Prevention and Control.
Figures

Note: The total number of confirmed cases is indicated in parentheses at the end of each bar. (a): Regarding West Nile virus infection, the total number of cases was used (includes probable and confirmed cases).

Source: Austria, Czechia, Denmark, Estonia, Finland, France, Germany, Hungary, Ireland, Italy, Latvia, Lithuania, Malta, the Netherlands, Poland, Romania, Slovakia, Slovenia and Sweden.

Source: Austria, Belgium, Czechia, Denmark, Estonia, Greece, Finland, France, Ireland, Italy, Luxembourg, Latvia, Malta, the Netherlands, Poland, Portugal, Romania, Sweden, Slovenia, Slovakia.

Vertical bars indicate the target to be reached, which was fixed at 1% for all poultry populations with the exception of laying hens for which it was 2%.

No data: Country with breeding flocks of Gallus gallus but no data were reported; Not applicable: Country without breeding flocks of Gallus gallus; Unknown: No information about the presence of breeding flocks of Gallus gallus was available.

No data: Country with breeding flocks of Gallus gallus but no data were reported; Not applicable: Country without breeding flocks of Gallus gallus; Unknown: No information about the presence of breeding flocks of Gallus gallus was available.

No data: Country with breeding flocks of Gallus gallus but no data were reported; Not applicable: Country without breeding flocks of Gallus gallus; Unknown: No information about the presence of breeding flocks of Gallus gallus was available.

No data: Country with laying hen flocks of Gallus gallus but no data were reported; Unknown: No information about the presence of laying hen flocks of Gallus gallus was available.

No data: Country with laying hen flocks of Gallus gallus but no data were reported; Unknown: No information about the presence of laying hen flocks of Gallus gallus was available.

No data: Country with broiler flocks of Gallus gallus but no data were reported; Unknown: No information about the presence of broiler flocks of Gallus gallus was available.

No data: Country with broiler flocks of Gallus gallus but no data were reported; Unknown: No information about the presence of broiler flocks of Gallus gallus was available.

No data: Country with breeding turkey flocks but no data were reported; Not applicable: Country without breeding turkey flocks; Unknown: No information about the presence of breeding turkey flocks was available.

No data: Country with fattening turkey flocks but no data were reported; Not applicable: Country without fattening turkey flocks; Unknown: No information about the presence of fattening turkey flocks was available.


Source: Austria, Czechia, Germany, Denmark, Estonia, Greece, Finland, Hungary, Ireland, Italy, Latvia, Malta, the Netherlands, Poland, Sweden and Slovakia.

The left side of the diagram shows the five most commonly reported Salmonella serovars involved in human salmonellosis cases acquired in the EU: S. Enteritidis (blue), S. Infantis (green), S. Typhimurium (orange), monophasic S. Typhimurium (
1 ,4,[5],12:i:‐) (violet) and S. Derby (magenta). Animal and food data from the same source were merged: ‘broiler’ includes isolates from broiler flocks and broiler meat, ‘bovine’ includes isolates from bovines for meat production and bovine meat, ‘pig’ includes isolates from fattening pigs and pig meat, ‘turkey’ includes isolates from fattening turkey flocks and turkey meat, and ‘layers’ includes isolates from laying hen flocks and eggs. The right side shows the five sources considered (broiler, bovine, pig, turkey and layers). The width of the coloured bands linking sources and serovars is proportional to the percentage of isolates of each serovar from each source.

The left side of the diagram shows the five most commonly reported Salmonella serovars from human salmonellosis cases acquired in the EU: S. Enteritidis (blue), S. Infantis (green), S. Typhimurium (orange), monophasic S. Typhimurium (
1 ,4,[5],12:i:‐) (violet) and S. Derby (magenta). The right side shows the reporting MS. The width of the coloured bands linking MS and serovars is proportional to the percentage of isolates of each serovar reported by each MS.

CA: Competent Authority; FBOp: Food business operator; Lm: Listeria monocytogenes; MS: Member State; RTE: ready‐to‐eat.

Source: Austria, Belgium, Czechia, Cyprus, Denmark, Estonia, Germany, Greece, Finland, France, Hungary, Ireland, Italy, Latvia, Lithuania, Malta, the Netherlands, Poland, Romania, Sweden, Slovakia, Slovenia.


Source: Austria, Czechia, Denmark, Estonia, Finland, France, Germany, Greece, Hungary, Ireland, Italy, Lithuania, Luxembourg, the Netherlands, Poland, Romania, Slovakia, Slovenia, Sweden.

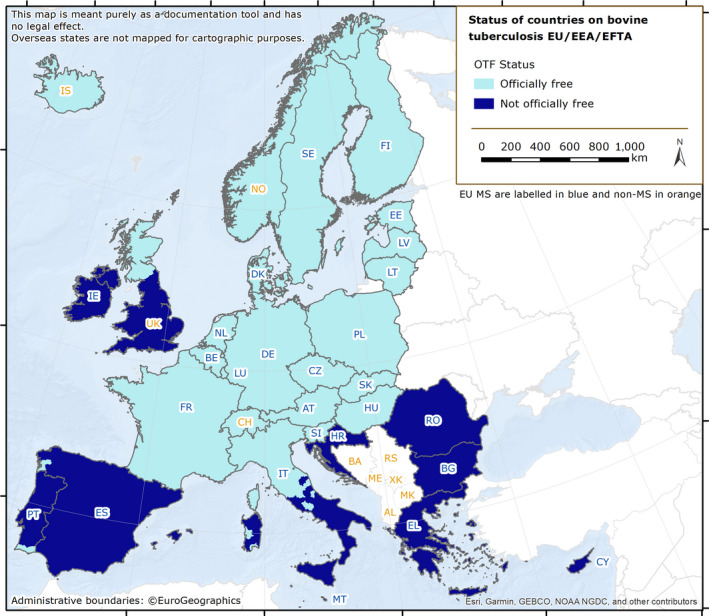

OTF: Officially bovine tuberculosis‐free in cattle.(*): Data reported by the United Kingdom in years 2016–2019 were included, when it was an EU Member State. Since 1 February 2020, the UK has become a third country.

OTF: Officially bovine tuberculosis‐free in cattle. (*): Data reported by the United Kingdom in years 2016–2019 were included, when it was an EU Member State. Since 1 February 2020, the UK has become a third country.


Source: Austria, Cyprus, Czechia, Germany, Estonia, Greece, Finland, France, Hungary, Ireland, Italy, Latvia, Lithuania, Malta, Netherlands, Poland, Portugal, Romania, Sweden, Slovenia, Slovakia.

Note: A total of 30 brucellosis cases notified in 2020 to ECDC and reported by Italy (18), Belgium (4), Germany (3), Austria (2), Bulgaria (1), Croatia (1) and Sweden (1) are not represented on the map because the origin of infection (i.e. imported or domestically acquired) was unknown.
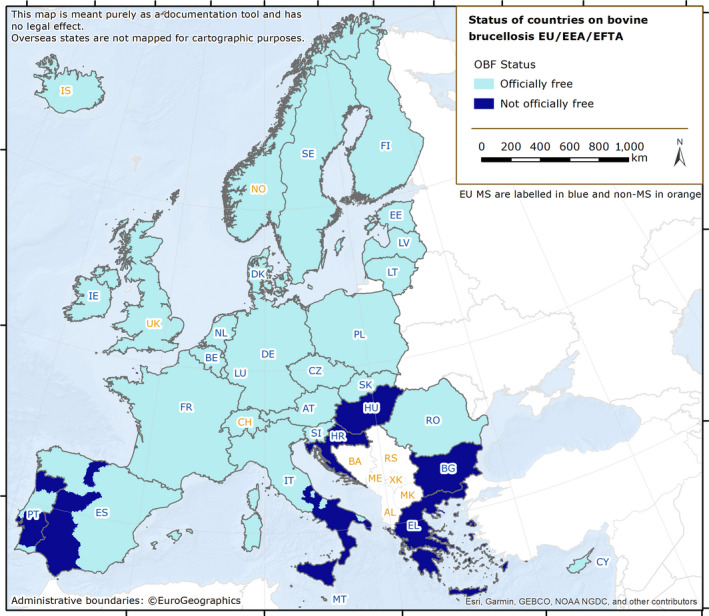

OBF: Officially brucellosis free in cattle. (*): From 2016 to 2019, the data included data reported by the United Kingdom, then an EU MS. Since 1 February 2020, the United Kingdom is a third country.


ObmF: Officially Brucella melitensis free in sheep and goats. (*): From 2016 to 2019, the data included data reported by the United Kingdom, then an EU MS. Since 1 February 2020, the United Kingdom is a third country.


Source: Austria, Cyprus, Czechia, Estonia, Greece, Finland, France, Germany, Hungary, Ireland, Italy, Latvia, Lithuania, Luxembourg, Malta, Poland, Portugal, Romania, Slovakia, Slovenia and Sweden.

These distribution maps have been built based on data from reports (EFSA and ECDC, 2015a, b, 2016, 2017, 2018a, 2019, 2021).


Intermediate hosts included on the map are cattle, deer, goats, horses, moose, mouflons, pigs, reindeer, sheep, water buffalos and wild boars. Because of the co‐endemicity with Echinococcus multilocularis, pigs were excluded from Poland, Romania, Slovakia and Slovenia data when Echinococcus species information was not reported.


Note: the number of MS reporting outbreaks is shown at the bottom (N). Outbreaks reported by the United Kingdom are included for the years 2010–2019.

Note: the number of MS reporting outbreaks is shown at the bottom (N). Cases involved in outbreaks reported by the United Kingdom are included for the years 2010–2019. Cases involved in both strong‐evidence outbreaks and weak‐evidence outbreaks are included in the figure.


Note: * indicates countries with a statistically significant trend (p < 0.05) over the period. Dark red and light red representing strong‐ and weak‐evidence outbreaks, respectively. Blue has been used to show both the trend line and the secondary Y‐axis representing the outbreak reporting rate. This was adopted for Latvia, Lithuania, Malta and Slovakia, in order to highlight a scale that is different to that of the other countries.

Note: Only FBO reported by EU Member States are shown in the figure. Marine biotoxins includes ciguatoxin and other unspecified marine toxins.
Other viruses includes Tick‐borne encephalitis virus (TBE), Hepatitis E and other unspecified viruses. Other bacterial agents includes Vibrio parahaemolyticus, Enteropathogenic Escherichia coli (EPEC) and other unspecified bacteria. Other parasites includes Anisakis, Giardia and Enterocytozoon bieneusi. Other causative agents includes lectin.

Note: The table may be read by column (country) or by row (causative agent). The number at the end of each row is the number of countries that reported for 2020 a given causative agent for outbreaks in 2020 while the number at the top of each column indicates refers to the number of causative agents identified in outbreaks by a given country in 2020. Slovenia is not shown because no outbreaks were detected in 2020. ‘Escherichia coli' other than STEC includes Enteropathogenic Escherichia coli (EPEC). ‘Bacillus cereus toxins’ include Bacillus cereus, Bacillus cereus enterotoxins. ‘Staphylococcus aureus toxins’ include staphylococcal enterotoxins. ‘Norovirus and other calicivirus’ include norovirus (Norwalk‐like virus), sapovirus (Sapporo‐like virus), and calicivirus unspecified. ‘Other viruses' include Hepatitis E and other unspecified viruses. ‘Histamine and scombrotoxin’ include histamine and scombrotoxin. ‘Marine biotoxins' include ciguatoxin and other unspecified marine toxins. ‘Other agents' include lectin.

Causative agents are shown in different colours. The size of each sector is proportional to the number of outbreaks (internal circle) and human cases (external circle) involved in outbreaks. The number of cases is shown inside the circle. The number of outbreaks is shown outside the circle.Information on the number of involved cases was not available for one outbreak in Germany caused by norovirus and for nine outbreaks from Ireland caused by Hepatitis A, Shiga toxin‐producing E. coli and an unknown agent. Slovenia is not shown because no outbreaks were detected in 2020.‘Other bacterial agents include’: Escherichia coli other than STEC, Shigella, Vibrio parahaemolyticus, bacteria unspecified.‘Bacillus toxins’ include Bacillus cereus, Bacillus cereus enterotoxins, and B. subtilis (only one outbreak of B. subtilis reported by the United Kingdom).‘Staphylococcus aureus toxins’ include staphylococcal enterotoxins.‘Norovirus and other calicivirus’ include norovirus (Norwalk‐like virus), sapovirus (Sapporo‐like virus), calicivirus unspecified.‘Other viruses' include Hepatitis E and other unspecified viruses.‘Marine biotoxins' includes ciguatoxin and other unspecified marine toxins.‘Other agents’ includes lectin.‘Other parasites’ includes Anisakis, Enterocytozoon bieneusi, Giardia.

A blank value in the variation (%) column indicates that the 2020/2019 variation cannot be calculated because no outbreaks were reported in 2020 or in 2019. Slovenia is not shown because no outbreaks were detected in 2020.‘Bacillus toxins’ includes Bacillus cereus, Bacillus cereus enterotoxins, and B. subtilis (only one outbreak of B. subtilis reported by the United Kingdom).‘Staphylococcus aureus toxins’ includes staphylococcal enterotoxins.‘Norovirus and other calicivirus’ includes norovirus (Norwalk‐like virus), sapovirus (Sapporo‐like virus), calicivirus unspecified.‘Marine biotoxins' includes ciguatoxin and other unspecified marine toxins.

Note: N = number of strong‐evidence outbreaks by food type.‘Other bacterial agents’ include Escherichia coli other than STEC, Shigella, Vibrio parahaemolyticus and other bacteria, unspecified.‘Bacillus cereus toxins’ include Bacillus cereus, Bacillus cereus enterotoxins.‘Staphylococcus aureus toxins’ include staphylococcal enterotoxins.‘Norovirus and other calicivirus’ include norovirus (Norwalk‐like virus), sapovirus (Sapporo‐like virus), calicivirus unspecified.‘Marine biotoxins' include ciguatoxin and other unspecified marine toxins.Composite foods, multi‐ingredients foods and other foods include ‘Bakery products', ‘Bakery products ‐ cakes', ‘Bakery products ‐ cakes ‐ containing raw cream', ‘Bakery products ‐ desserts ‐ containing raw eggs', ‘Bakery products ‐ pastry ‐ yeast leavened pastry', ‘Buffet meals', ‘Canned food products', ‘Mixed food', ‘Other foods', ‘Other processed food products and prepared dishes', ‘Other processed food products and prepared dishes ‐ meat based dishes', ‘Other processed food products and prepared dishes ‐ pasta', ‘Other processed food products and prepared dishes ‐ pasta based dishes', ‘Other processed food products and prepared dishes ‐ sushi', ‘Soups', ‘Sweets and chocolate'.Eggs and egg products include ‘Eggs', ‘Eggs ‐ raw material (liquid egg) for egg products', ‘Eggs ‐ table eggs ‐ mixed whole', ‘Eggs and egg products'.Fish and fishery products include ‘Crustaceans, shellfish, molluscs and products thereof', ‘Fish ‐ smoked', ‘Fish ‐ smoked ‐ hot‐smoked', ‘Fish and fish products', ‘Live bivalve molluscs ‐ oysters'.Foods of non‐animal origin includes ‘Cereal products including rice and seeds/pulses (nuts, almonds)’, ‘Fruit, berries and juices and other products thereof', ‘Fruit ‐ whole', ‘Herbs and spices', ‘Nuts and nut products', ‘Vegetables', ‘Vegetables ‐ pre‐cut', ‘Vegetables and juices and other products thereof'.Meat and meat products includes ‘Bovine meat and products thereof', ‘Broiler meat (Gallus gallus) and products thereof', ‘Meat and meat products', ‘Meat from bovine animals ‐ meat products', ‘Meat from bovine animals ‐ meat products ‐ ready‐to‐eat', ‘Meat from pig ‐ fresh', ‘Meat from pig ‐ meat products ‐ fresh raw sausages', ‘Meat from poultry, unspecified ‐ meat products ‐ non‐ready‐to‐eat', ‘Meat from wild boar ‐ meat products ‐ fresh raw sausages', ‘Meat, mixed meat ‐ meat products ‐ ready‐to‐eat', ‘Other or mixed red meat and products thereof', ‘Other, mixed or unspecified poultry meat and products thereof', ‘Pig meat and products thereof'.Milk and milk products includes ‘Cheese', ‘Cheeses made from cows' milk', ‘Dairy products (other than cheeses)', ‘Milk, cows' ‐ pasteurised milk', ‘Milk, cows' ‐ raw milk', ‘Milk, goats' ‐ raw milk', ‘Milk, sheep's ‐ raw milk'.Water (and other beverages) includes ‘Tap water, including well water', ‘Water'.


Note: N = number of strong‐evidence outbreaks by food type.‘Other bacterial agents’ include Escherichia coli other than STEC, Shigella, Vibrio parahaemolyticus and other bacteria, unspecified.‘Bacillus toxins’ include Bacillus cereus, Bacillus cereus enterotoxins, and B. subtilis (only one outbreak of B. subtilis reported by the United Kingdom).‘Staphylococcus aureus toxins’ include Staphylococcal enterotoxins.‘Norovirus and other calicivirus’ include norovirus (Norwalk‐like virus), sapovirus (Sapporo‐like virus), calicivirus unspecified.‘Marine biotoxins' include ciguatoxin and other unspecified marine toxins.

Note: Restaurant, pub, street vendors, takeaway, etc. includes Restaurant or café or pub or bar or hotel or catering service, mobile retailer or market/street vendor, takeaway or fast‐food outlet.Canteen or catering at workplace, school, hospital, etc., includes school or kindergarten, residential institution (nursing home or prison or boarding school), canteen or workplace catering, hospital or medical care facility, catering on aircraft or ship or train.Other settings includes camp or picnic, farm, multiple places of exposure in one country, multiple places of exposure in more than one country, other settings unspecified, temporary mass catering (fairs or festivals).

Note: Outbreaks reported by the United Kingdom are included for the years 2010–2019.‘Escherichia coli' other than STEC includes Enteropathogenic Escherichia coli (EPEC).‘Bacillus cereus toxins’ include Bacillus cereus, and Bacillus cereus enterotoxins.‘Staphylococcus aureus toxins’ include staphylococcal enterotoxins.‘Norovirus and other calicivirus’ include norovirus (Norwalk‐like virus), sapovirus (Sapporo‐like virus), and calicivirus unspecified.‘Marine biotoxins' include ciguatoxin and other unspecified marine toxins.

Note: The orange line (right axis) in the graphs represents the Salmonella outbreak reporting rate and was measured on the same scale for all MS (except for Slovakia), to allow a direct comparison between countries. The blue bars show the yearly trend in terms of absolute numbers of Salmonella outbreaks (left axis), using the most appropriate scale for each country.Blue has been used to show both the trend line and the secondary Y‐axis representing the outbreak reporting rate. This was adopted for Slovakia to highlight that the scale was different from the other countries.* Indicates countries with a statistically significant trend (p < 0.05) over several years.

Note: only causative agents and countries with statistically significant trends and more than five outbreaks reported per year, on average are shown.

Note: only food vehicles and countries with statistically significant trends and more than five outbreaks reported per year, on average, are shown.

Source(s): Austria, Cyprus, Czechia, Denmark, Estonia, Finland, Germany, Hungary, Ireland, Italy, Latvia, Luxembourg, Malta, Poland, Romania, Slovakia, Slovenia, Sweden.


Source: Data from Cyprus, Czechia, Estonia, Finland, France, Germany, Greece, Hungary, Ireland, Latvia, Lithuania, Malta, the Netherlands, Poland, Portugal, Romania, Slovakia, Slovenia and Sweden. Austria, Belgium, Bulgaria, Croatia, Denmark, Italy, Luxembourg and Spain did not report data at the level of detail required for the analysis.

Data source: ECDC for human cases, ADNS for animal outbreaks. Outbreaks in birds or equids that were not notified to the ADNS are not included in the map.

Source(s): Austria, Belgium, Cyprus, Czechia, Estonia, Finland, France, Greece, Hungary, Ireland, Italy, Latvia, Lithuania, Luxembourg, Malta, the Netherlands, Poland, Romania, Slovakia, Slovenia, Spain and Sweden. Bulgaria, Croatia, Germany and Portugal did not report data to the level of detail required for the analysis.


Data source: ADNS for animal outbreaks. Outbreaks in birds or equids that were not notified to ADNS are not included.

Source: Austria, Cyprus, Czechia, Estonia, Finland, France, Germany, Greece, Hungary, Ireland, Latvia, Luxembourg, Malta, Poland, Romania, Slovakia, Slovenia, Spain and Sweden. Belgium, Bulgaria, Croatia, Denmark, Italy, Lithuania, the Netherlands and Portugal did not report data to the level of detail required for the analysis.
References
-
- Abubakar RH, Madoroba E, Adenubi O, Morar‐Leather D and Fasina FO, 2017. Bacterial pathogens of pigs with particular reference to Escherichia coli: a systematic review and meta‐analysis. Journal of Veterinary Medicine and Animal Health, 9, 159–185.
-
- Alban L, Pozio E, Boes J, Boireau P, Boué F, Claes M, Cook AJC, Dorny P, Enemark HL, van der Giessen J, Hunt KR, Howell M, Kirjusina M, Nöckler K, Rossi P, Smith GC, Snow L, Taylor MA, Theodoropoulos G, Vallée I, Viera‐Pinto MM and Zimmer IA, 2011. Towards a standardised surveillance for Trichinella in the European Union. Preventive Veterinary Medicine, 99, 148–160. 10.1016/j.prevetmed.2011.02.008 - DOI - PubMed
-
- APHA (Animal and Plant Health Agency) , 2021. Canine Brucellosis: Summary Information Sheet.
LinkOut - more resources
Full Text Sources
Miscellaneous