. 2022 Jul 14;9(3):320-344.
doi: 10.3934/Neuroscience.2022018. eCollection 2022.

Environmental enrichment reverses cerebellar impairments caused by prenatal exposure to a synthetic glucocorticoid

Affiliations

Environmental enrichment reverses cerebellar impairments caused by prenatal exposure to a synthetic glucocorticoid

Martina Valencia et al. AIMS Neurosci. .

Abstract

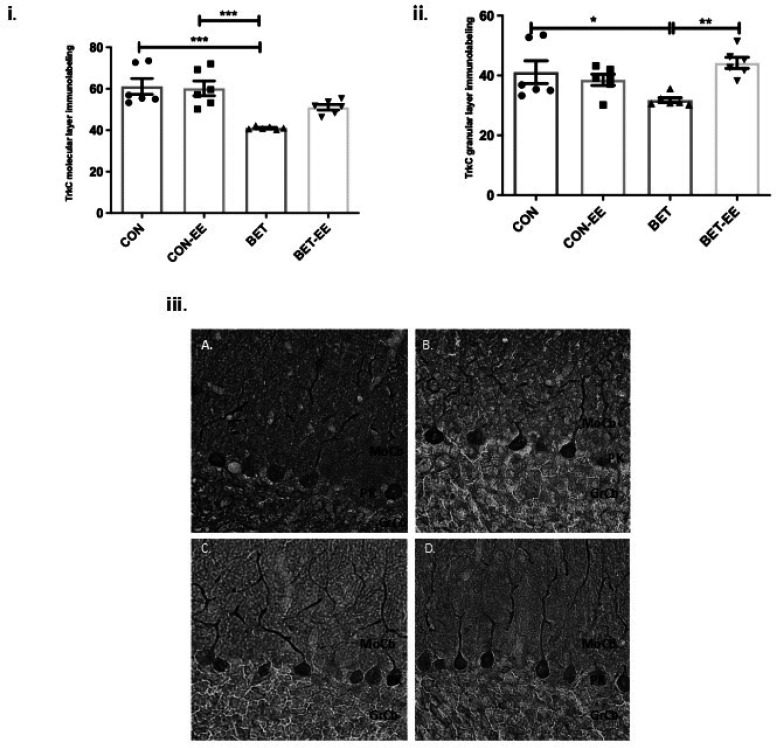
During prenatal life, exposure to synthetic glucocorticoids (SGCs) can alter normal foetal development, resulting in disease later in life. Previously, we have shown alterations in the dendritic cytoarchitecture of Purkinje cells in adolescent rat progeny prenatally exposed to glucocorticoids. However, the molecular mechanisms underlying these alterations remain unclear. A possible molecular candidate whose deregulation may underlie these changes is the glucocorticoid receptor (GR) and neurotrophin 3/ tropomyosin receptor kinase C, neurotrophic complex (NT-3/TrkC), which specifically modulates the development of the neuronal connections in the cerebellar vermis. To date, no evidence has shown that the cerebellar expression levels of this neurotrophic complex are affected by exposure to a synthetic glucocorticoid in utero. Therefore, the first objective of this investigation was to evaluate the expression of GR, NT-3 and TrkC in the cerebellar vermis using immunohistochemistry and western blot techniques by evaluating the progeny during the postnatal stage equivalent to adolescence (postnatal Day 52). Additionally, we evaluated anxiety-like behaviours in progeny using the elevated plus maze and the marble burying test. In addition, an environmental enrichment (EE) can increase the expression of some neurotrophins and has anxiolytic power. Therefore, we wanted to assess whether an EE reversed the long-term alterations induced by prenatal betamethasone exposure. The major findings of this study were as follows: i) prenatal betamethasone (BET) administration decreases GR, NT-3 and TrkC expression in the cerebellar vermis ii) prenatal BET administration decreases GR expression in the cerebellar hemispheres and iii) enhances the anxiety-like behaviours in the same progeny, and iv) exposure to an EE reverses the reduced expression of GR, NT-3 and TrkC in the cerebellar vermis and v) decreases anxiety-like behaviours. In conclusion, an enriched environment applied 18 days post-weaning was able to restabilize GR, NT-3 and TrkC expression levels and reverse anxious behaviours observed in adolescent rats prenatally exposed to betamethasone.

Keywords: GR; NT-3; TrkC; anxiety-like behaviours; betamethasone; environmental enrichment.


Conflict of interest statement

Conflict of interest: The authors declare no conflict of interest.

Figures

Figure 1.
Figure 1.. Representative scheme of the methods. BET: Betamethasone; G20: gestational day 20; P21: Postnatal day 21; EE: environmental enrichment; P39: Postnatal day 39; P52: Postnatal day 52; EPM: elevated plus maze; MB: marble burying test; IHQ: immunohistochemistry; WB: western blot; V: cerebellar lobule V; VIa: cerebellar lobule Via; VIb: cerebellar lobule VIb; VII: cerebellar lobule VII; VIII: cerebellar lobule VIII; IX: cerebellar lobule IX; GR: glucocorticoid receptor; NT-3: neurotrophin 3; TrkC: tropomyosin receptor kinase C.
Figure 2.
Figure 2.. (i) The bar graph show the time (seconds) spent in open arms and the time spent in closed arms from 5-minutes session in the EPM test. The data as presented as the mean ± standard error of the mean from: (CON) control animals; (CON-EE) control- EE treated animals.; (BET) betamethasone treated animals.; (BET-EE) betamethasone-EE treated animals (N = 10; respectivelly) on P52 (age in days). The mean time (sec) in the open arms of the CON, CON-EE, BET, BET-EE groups (23.7, 37.8, 3.2, 25.3, respectively) and the mean time (sec) in the closed arms of the CON, CON-EE, BET, BET-EE groups (275.7, 261.7, 296.6, 274.2, respectively). The data were analyzed using two-way ANOVA (*p < 0.05, ****p < 0.0001) followed by Sidak post hoc comparisons. (ii) The bar graph show the time (seconds) spent in open arms and the time spent in closed arms from 5-minutes session in the EPM test. The data as presented as the mean ± standard error of the mean from: (CON-EE) control- EE treated animals.; (BET-EE) betamethasone-EE treated animals (N = 10; respectively) on P52 (age in days). The mean time (sec) in the open arms of CON-EE, BET-EE groups (37.8, 25.3, respectively) and the mean time (sec) in the closed arms of the CON-EE, BET-EE groups (261.7, 274.2, respectively). The data were analyzed using two-way ANOVA (*p < 0.05, ****p < 0.0001) followed by Sidak post hoc comparisons.
Figure 3.
Figure 3.. The bar graph shows the total number of buried marbles (10-minute session). The data as presented as the mean ± standard error of the mean from: (CON) control animals; (CON-EE) control- EE treated animals.; (BET) betamethasone treated animals.; (BET-EE) betamethasone-EE treated animals (N = 16, 12, 17, 13; respectively). The data were analyzed using one-way ANOVA (*p < 0.05, **p < 0.01) followed by Bonferroni post hoc comparisons. The statistical bars only show the significant differences among the groups.
Figure 4.
Figure 4.. The labelling intensity of GR in the digital photomicrographs was analysed in the cerebellar Molecular Layer (i) and Granular Layer (ii) of the cerebellar vermis of control (CON) animals, the control EE-treated (CON-EE) animals, the betamethasone-treated (BET) animals, and the betamethasone EE-treated (BET-EE) animals on P52. The data are presented as the mean ± standard error (N = 6 per group). The data were analysed using one-way ANOVA (*p < 0.05, **p < 0.01) followed by Tukey post hoc comparisons. (iii) Representatives photomicrographs of Molecular Layer and Granular Layer stained with anti-GR; A: control (CON) animals; B: the control EE-treated (CON-EE) animals; C: the betamethasone-treated (BET) animals; D: the betamethasone- and EE-treated (BET-EE) animals on P52. MoCb: Molecular layer cerebellum; PK: Purkinje cell layer cerebellum; GrCb: Granule cell layer cerebellum.
Figure 5.
Figure 5.. The labelling intensity of GR in the digital photomicrographs was analysed in the cerebellar left hemisphere (i) and the cerebellar right hemisphere (iii) of the control (CON) animals, the control EE-treated (CON-EE) animals, the betamethasone-treated (BET) animals, and the betamethasone EE-treated (BET-EE) animals on P52. The data are presented as the mean ± standard error (N = 6 per group). The data were analysed using two-way ANOVA (*p < 0.05, **p < 0.01) followed by Tukey post hoc comparisons. The statistical bars only show the significant differences among the groups. Representative photomicrographs of Molecular Layer (ML) and Granular Layer (GL) stained with anti-GR of the cerebellar left hemisphere (ii) and the cerebellar right hemisphere (iv); A: control (CON) animals; B: the control EE-treated (CON-EE) animals; C: the betamethasone-treated (BET) animals; D: the betamethasone- and EE-treated (BET-EE) animals on P52. MoCb: Molecular layer cerebellum; PK: Purkinje cell layer cerebellum; GrCb: Granule cell layer cerebellum.
Figure 6.
Figure 6.. The labelling intensity of NT-3 in the digital photomicrographs was analysed in the cerebellar Molecular Layer (i) and Granular Layer (ii) of the cerebellar vermis of the control (CON) animals, the control EE-treated (CON-EE) animals, the betamethasone-treated (BET) animals, and the betamethasone EE-treated (BET-EE) animals on P52. The data are presented as the mean ± standard error (N = 6 per group). The data were analysed using one-way ANOVA (*p < 0.05, **p < 0.01, ***p < 0.001) followed by Tukey post hoc comparisons. (iii) Representatives photomicrographs of Molecular Layer and Granular Layer stained with anti-NT-3; A: control (CON) animals; B: the control EE-treated (CON-EE) animals; C: the betamethasone-treated (BET) animals; D: the betamethasone- and EE-treated (BET-EE) animals on P52. MoCb: Molecular layer cerebellum; PK: Purkinje cell layer cerebellum; GrCb: Granule cell layer cerebellum.
Figure 7.
Figure 7.. The labelling intensity of TrkC in the digital photomicrographs was analysed in the cerebellar Molecular Layer (i) and Granular Layer (ii) of the cerebellar vermis of the control (CON) animals, the control EE-treated (CON-EE) animals, the betamethasone-treated (BET) animals, and the betamethasone EE-treated (BET-EE) animals on P52. The data are presented as the mean ± standard error (N = 6 per group). The data were analysed using one-way ANOVA (*p < 0.05, **p < 0.01, ***p < 0.001) followed by Tukey post hoc comparisons. (iii) Representatives photomicrographs of Molecular Layer and Granular Layer stained with anti-TrkC (iii); A: control (CON) animals; B: the control EE-treated (CON-EE) animals; C: the betamethasone-treated (BET) animals; D: the betamethasone- and EE-treated (BET-EE) animals on P52. MoCb: Molecular layer cerebellum; PK: Purkinje cell layer cerebellum; GrCb: Granule cell layer cerebellum.
Figure 8.
Figure 8.. The GR expression levels in the cerebellar vermis of rats prenatally exposed to BET were determined by WB analysis. The data are presented as the mean ± standard error of the control of (CON) animals, the control EE-treated (CON-EE) animals, the betamethasone-treated (BET) animals, and the betamethasone- and EE-treated (BET-EE) animals (N = 6 per group). The data were analysed using Kruskall-Wallis (*p < 0.05, **p < 0.01) followed by Dunns post hoc comparisons. The statistical bars only show the significant differences among the groups.
Figure 9.
Figure 9.. The GR expression levels in the cerebellar right (i) and left (ii) hemispheres of rats prenatally exposed to BET were determined by WB analysis. The data are presented as the mean ± standard error of the control of (CON) animals, the control EE-treated (CON-EE) animals, the betamethasone-treated (BET) animals, and the betamethasone- and EE-treated (BET-EE) animals (N = 6 per group). The data were analysed using Kruskall-Wallis (*p < 0.05, **p < 0.01) followed by Dunns post hoc comparisons. The statistical bars only show the significant differences among the groups.
Figure 10.
Figure 10.. The NT-3 (i) and the TrkC (ii) expression levels in the cerebellar vermis of rats prenatally exposed to BET were determined by WB analysis. The data are presented as the mean ± standard error of the control of (CON) animals, the control EE-treated (CON-EE) animals, the betamethasone-treated (BET) animals, and the betamethasone- and EE-treated (BET-EE) animals (N = 6 per group). The data were analysed using Kruskall-Wallis (*p < 0.05, **p < 0.01) followed by Dunns post hoc comparisons. The statistical bars only show the significant differences among the groups.

Similar articles

Cited by

References

    1. Gutteling BM, de Weerth C, Zandbelt N, et al. Does maternal prenatal stress adversely affect the child's learning and memory at age six? J Abnorm Child Psychol. 2006;34(6):789–798. doi: 10.1007/s10802-006-9054-7. - DOI - PubMed
    1. Cirulli F, Francia N, Berry A, et al. Early life stress as a risk factor for mental health: role of neurotrophins from rodents to non-human primates. Neurosci Biobehav Rev. 2009;33(4):573–585. doi: 10.1016/j.neubiorev.2008.09.001. - DOI - PMC - PubMed
    1. Lunghi L, Pavan B, Biondi C, et al. Use of glucocorticoids in pregnancy. Curr Pharm Des. 2010;16(32):3616–3637. doi: 10.2174/138161210793797898. - DOI - PubMed
    1. Alexander N, Rosenlocher F, Stalder T, et al. Impact of antenatal synthetic glucocorticoid exposure on endocrine stress reactivity in term-born children. J Clin Endocrinol Metab. 2012;97(10):3538–3544. doi: 10.1210/jc.2012-1970. - DOI - PubMed
    1. Stalnacke J, Diaz Heijtz R, Norberg H, et al. Cognitive outcome in adolescents and young adults after repeat courses of antenatal corticosteroids. J Pediatr. 2013;163(2):441–446. doi: 10.1016/j.jpeds.2013.01.030. - DOI - PubMed

LinkOut - more resources